| Param | Original file | Final file |
|---|---|---|
| Filename | modeM0/AS1P01_180T10_9000000192_01080cztM0_level2.evt | modeM0/AS1P01_180T10_9000000192_01080cztM0_level2_quad_clean.evt |
| Size (bytes) | 282,222,720 | 22,754,880 |
| Size | 269.1 MB | 21.7 MB |
| Events in quadrant A | 2,089,144 | 145,934 |
| Events in quadrant B | 2,196,720 | 144,252 |
| Events in quadrant C | 2,193,175 | 139,418 |
| Events in quadrant D | 1,959,314 | 140,751 |
| Mode SS | |||
|---|---|---|---|
| Quadrant | BADHDUFLAG | Total packets | Discarded packets |
| A | 0 | 32 | 0 |
| B | 0 | 32 | 0 |
| C | 0 | 32 | 0 |
| D | 0 | 32 | 0 |
| Mode M0 | |||
|---|---|---|---|
| Quadrant | BADHDUFLAG | Total packets | Discarded packets |
| A | 0 | 7332 | 1 |
| B | 0 | 7674 | 1 |
| C | 0 | 7640 | 1 |
| D | 0 | 6958 | 1 |
| Mode M9 | |||
|---|---|---|---|
| Quadrant | BADHDUFLAG | Total packets | Discarded packets |
| A | 0 | 10 | 0 |
| B | 0 | 10 | 0 |
| C | 0 | 10 | 0 |
| D | 0 | 10 | 0 |
| Quadrant | Total seconds | Saturated seconds | Saturation percentage |
|---|---|---|---|
| A | 1609 | 5 | 0.310752% |
| B | 1609 | 9 | 0.559354% |
| C | 1609 | 3 | 0.186451% |
| D | 1609 | 5 | 0.310752% |
Noise dominated data is calculated using 1-second bins in cleaned event files. If a bin has >2000 counts, and if more than 50% of those come from <1% of pixels, then it is considered to be noise-dominated and hence unusable.
| Quadrant | # 1 sec bins | Bins with >0 counts | Bins with >2000 counts | High rate bins dominated by noise | Noise dominated (total time) | Noise dominated (detector-on time) | Marked lightcurve |
|---|---|---|---|---|---|---|---|
| A | 2534 | 1609 | 66 | 66 | 2.60% | 4.10% | 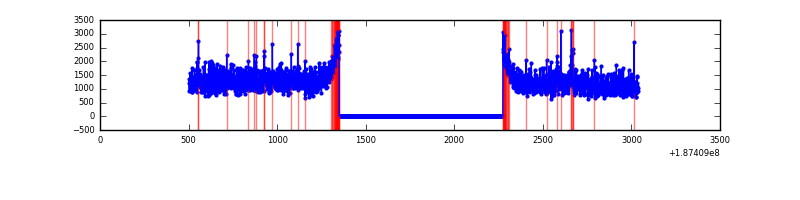 |
| B | 2534 | 1610 | 98 | 98 | 3.87% | 6.09% | 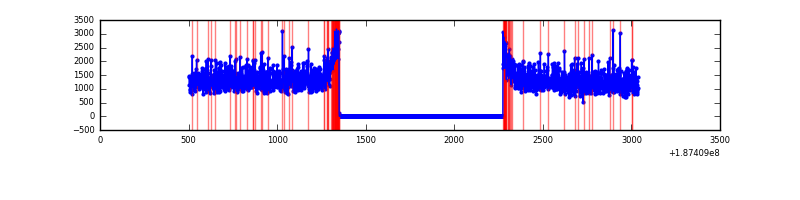 |
| C | 2534 | 1610 | 92 | 92 | 3.63% | 5.71% | 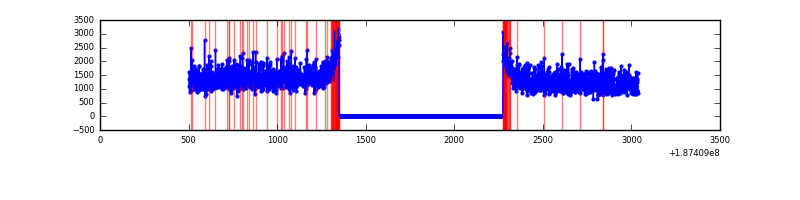 |
| D | 2534 | 1610 | 54 | 54 | 2.13% | 3.35% | 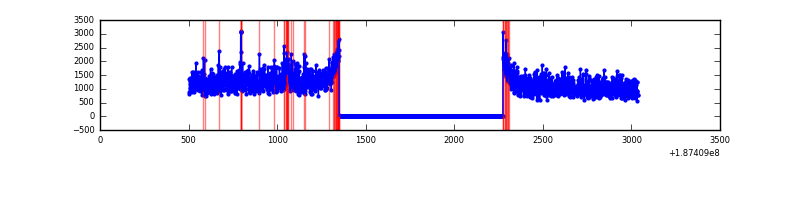 |
Top three noisy pixels from each quadrant. If the there are fewer than three noisy pixels in the level2.evt file, extra rows are filled as -1
| Pixel properties | Quadrant properties | ||||||
|---|---|---|---|---|---|---|---|
| Quadrant | DetID | PixID | Counts | Sigma | Mean | Median | Sigma |
| A | 15 | 233 | 26563 | 200.38 | 537 | 540 | 129.9 |
| A | 12 | 243 | 1735 | 9.2 | 537 | 540 | 129.9 |
| A | 3 | 111 | 1730 | 9.16 | 537 | 540 | 129.9 |
| B | 5 | 191 | 8639 | 58.82 | 574 | 573 | 137.1 |
| B | 5 | 249 | 5648 | 37.01 | 574 | 573 | 137.1 |
| B | 5 | 184 | 1752 | 8.6 | 574 | 573 | 137.1 |
| C | 15 | 241 | 75638 | 496.82 | 536 | 556 | 151.1 |
| C | 3 | 79 | 8815 | 54.65 | 536 | 556 | 151.1 |
| C | 3 | 111 | 7034 | 42.87 | 536 | 556 | 151.1 |
| D | 2 | 216 | 19431 | 118.19 | 510 | 530 | 159.9 |
| D | 15 | 13 | 14827 | 89.4 | 510 | 530 | 159.9 |
| D | 10 | 125 | 7873 | 45.92 | 510 | 530 | 159.9 |
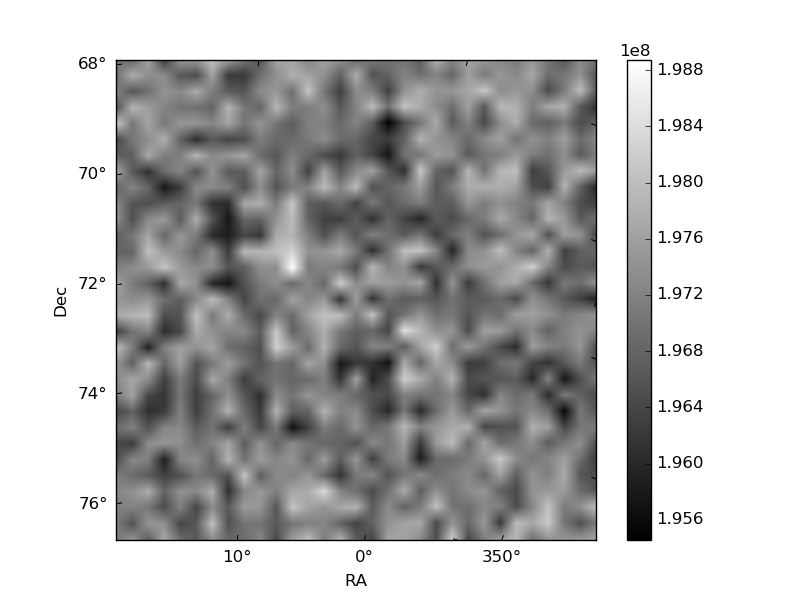
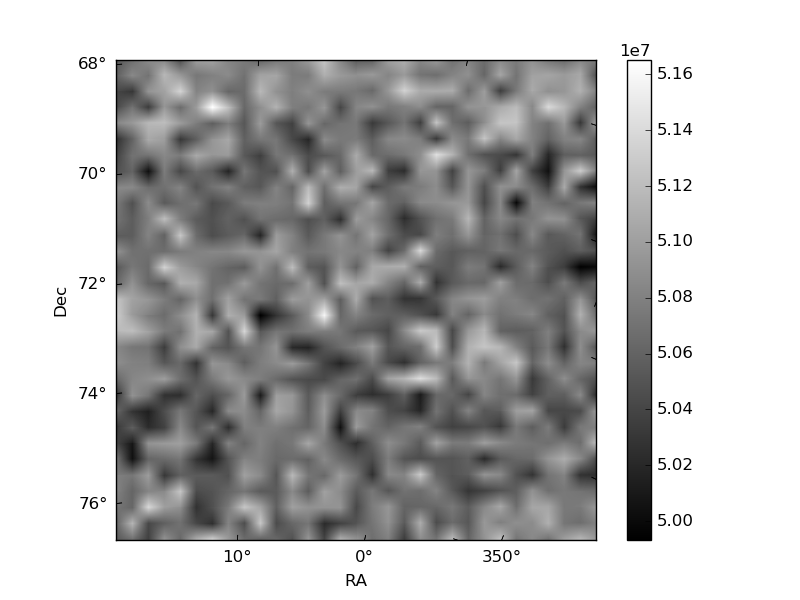
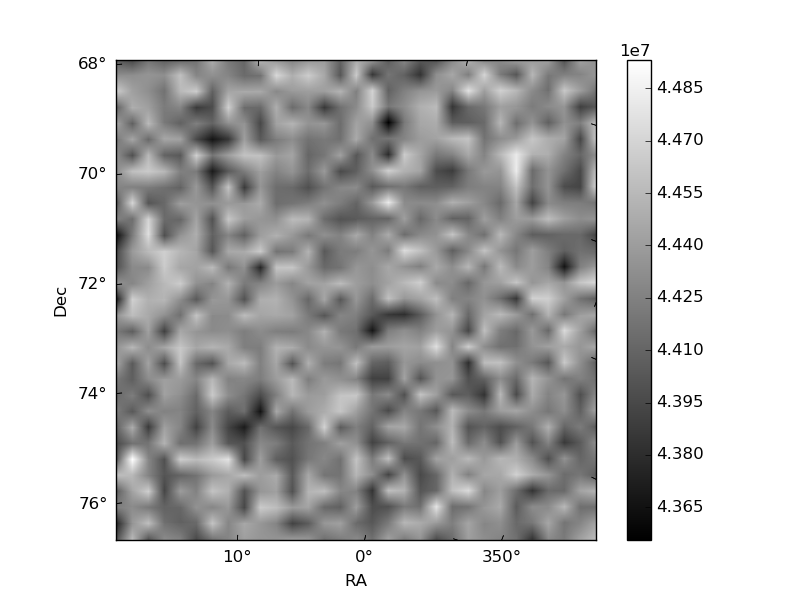
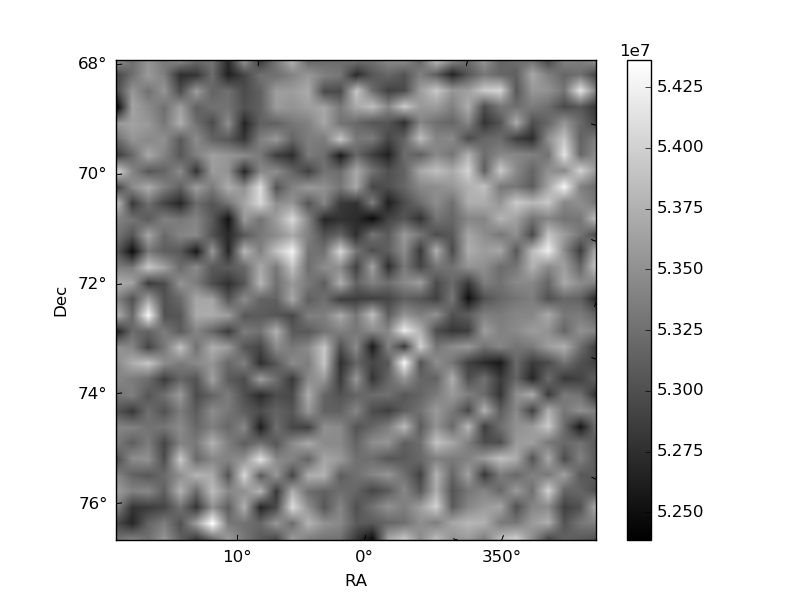
Histogram calculated using DETX and DETY for each event in the final _common_clean file
| Quadrant A | 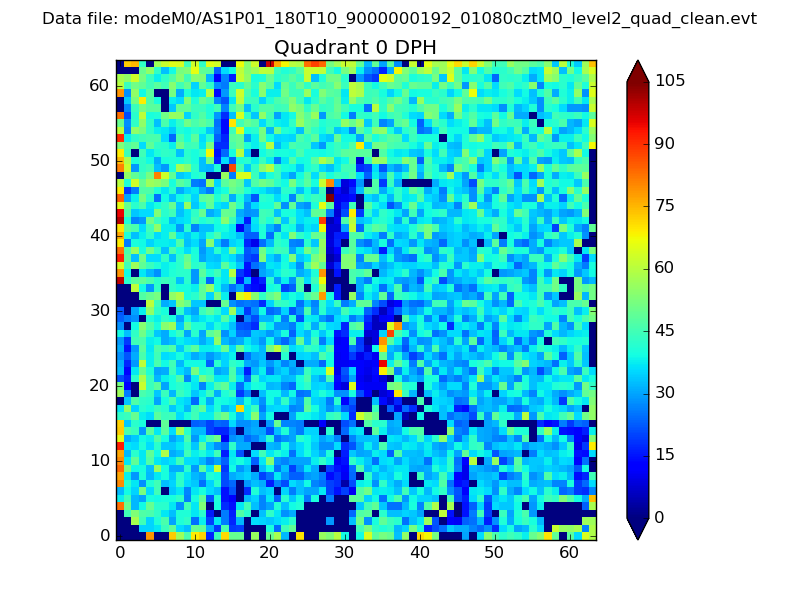 |
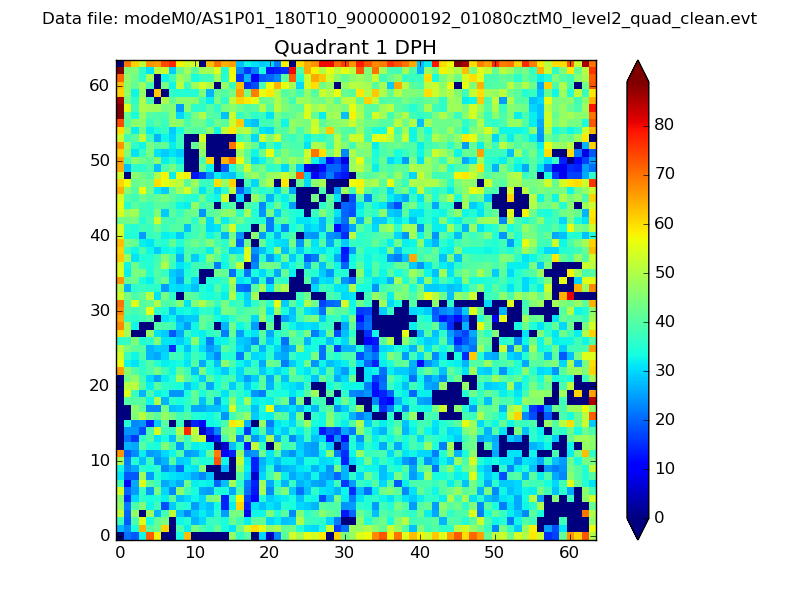 |
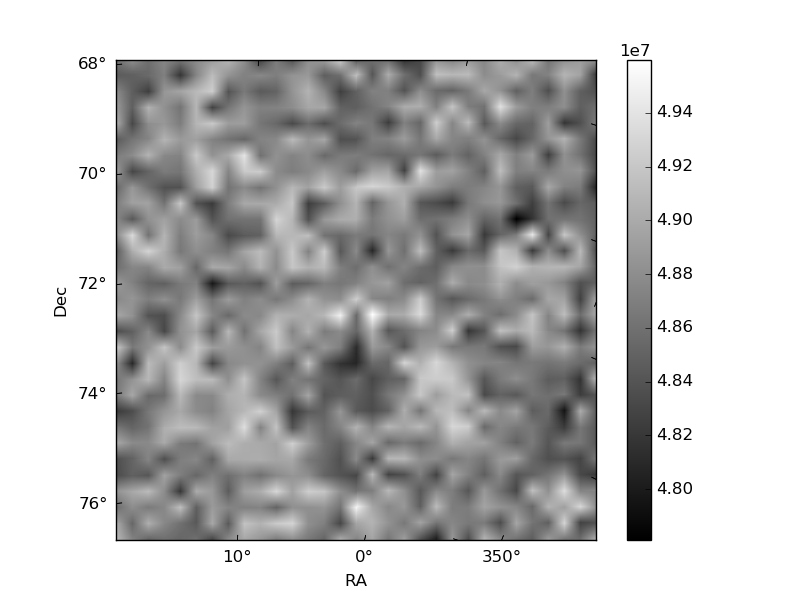
Quadrant B |
|---|---|---|---|
| Quadrant D | 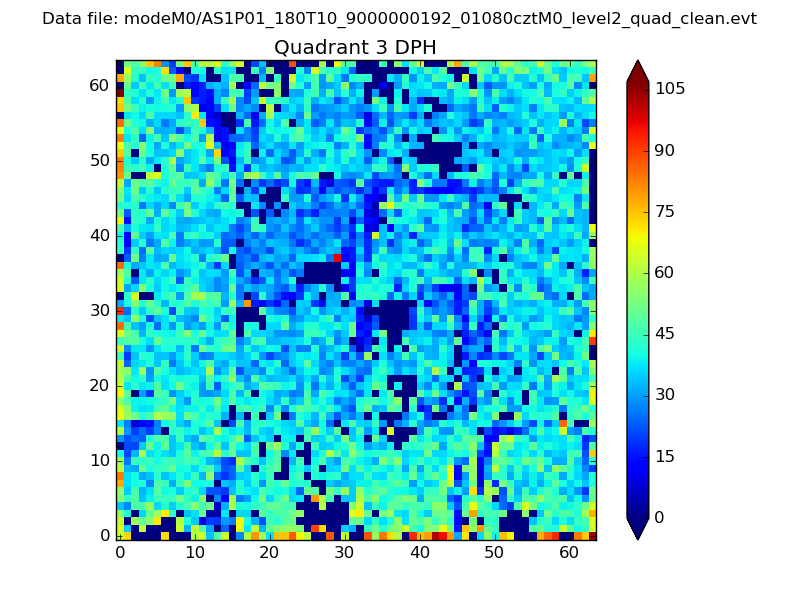 |
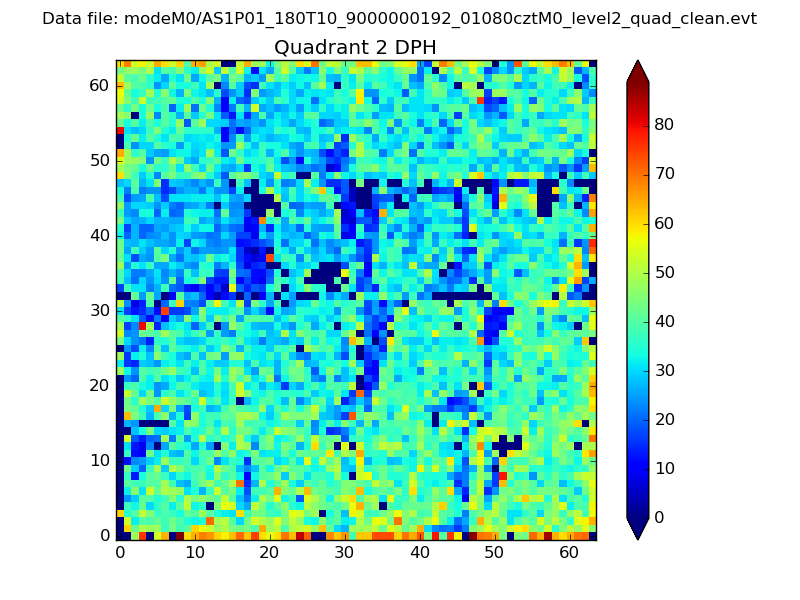 |
Quadrant C |
| Plot type | Count rate plots | Images |
|---|---|---|
| Comparison with Poisson distribution Blue bars denote a histogram of data divided into 1 sec bins. Red curve is a Poisson curve with rate = median count rate of data. |
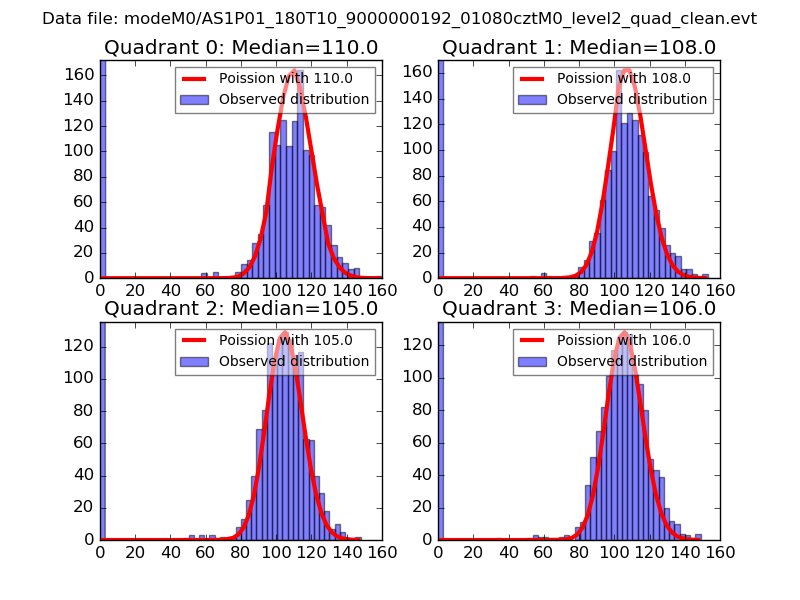 |
 |
| Quadrant-wise count rates Data is divided into 100 sec bins |
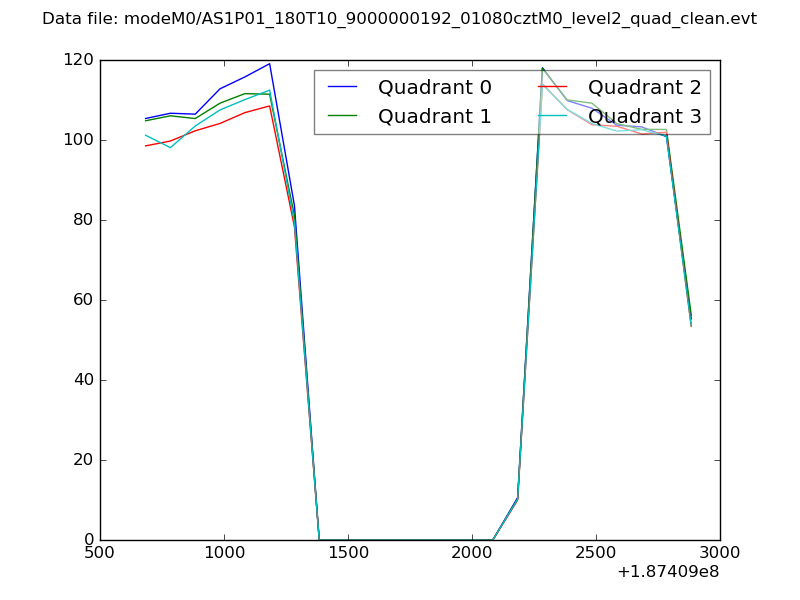 |
|
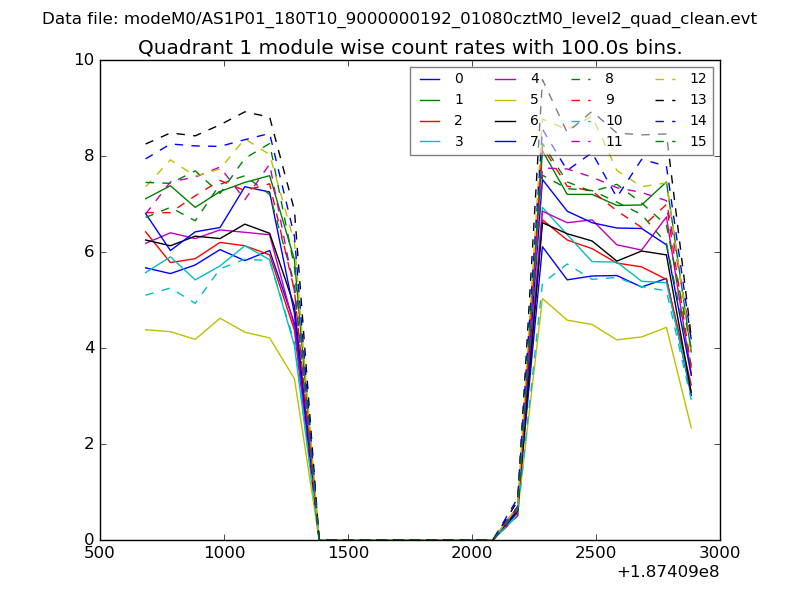
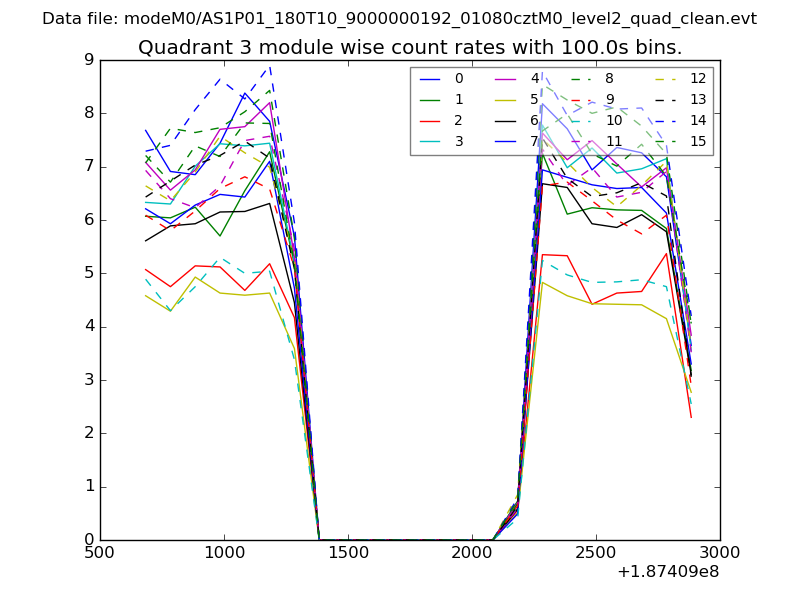
| Module-wise count rates for Quadrant A Data is divided into 100 sec bins |
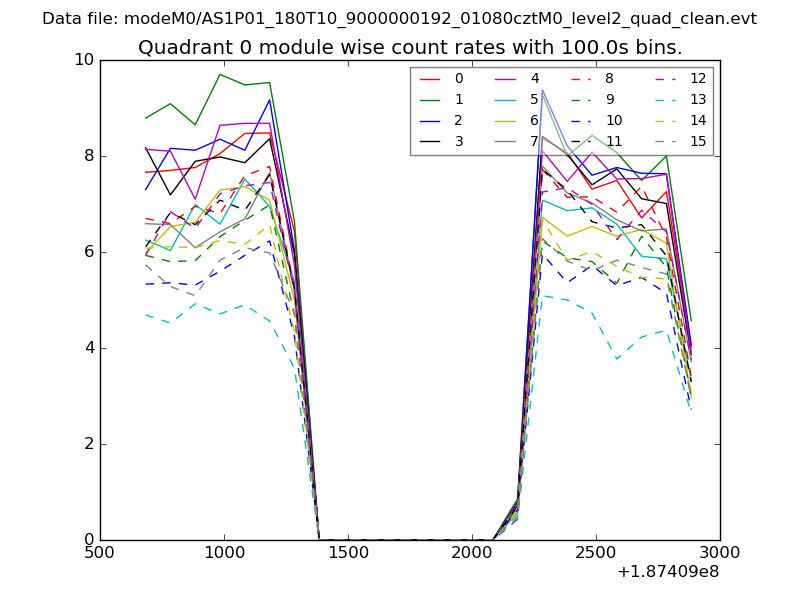 |
 |
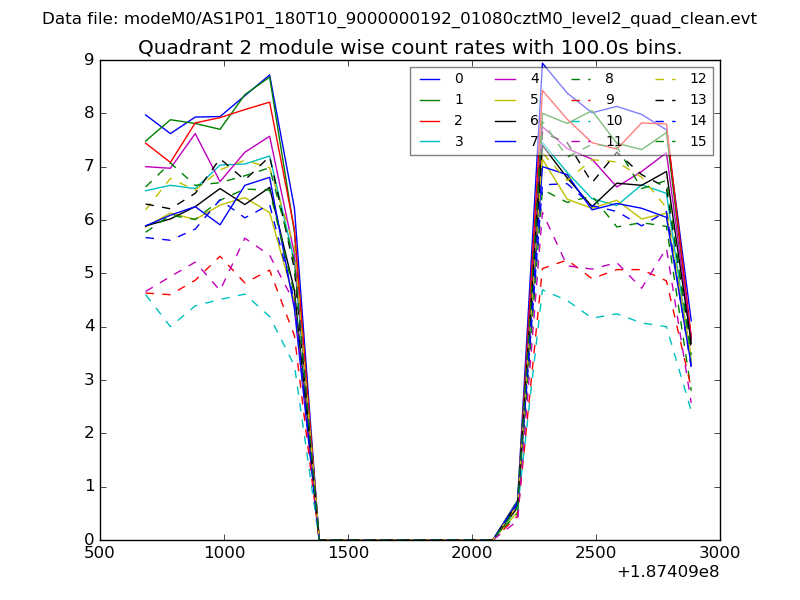
| Module-wise count rates for Quadrant B Data is divided into 100 sec bins |
 |
 |
| Module-wise count rates for Quadrant C Data is divided into 100 sec bins |
 |
 |
| Module-wise count rates for Quadrant D Data is divided into 100 sec bins |
 |
 |
| Parameter | Plot |
|---|---|
| CZT HV Monitor | 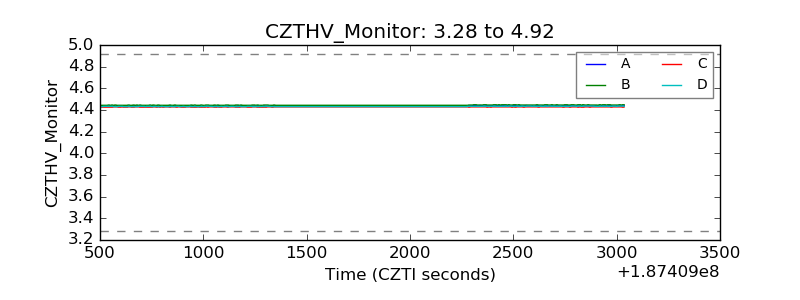 |
| D_VDD | 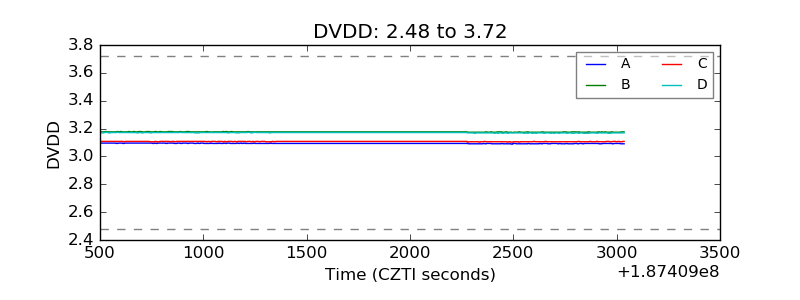 |
| Temperature 1 | 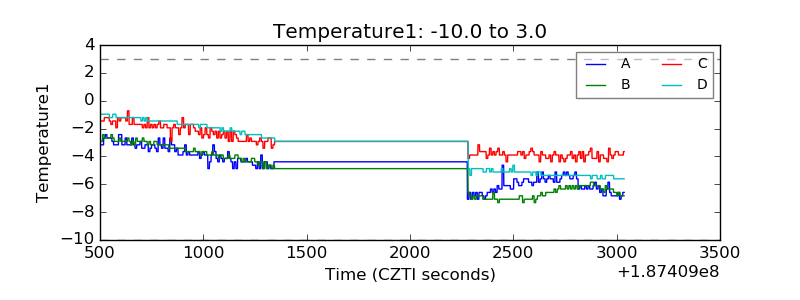 |
| Veto HV Monitor | 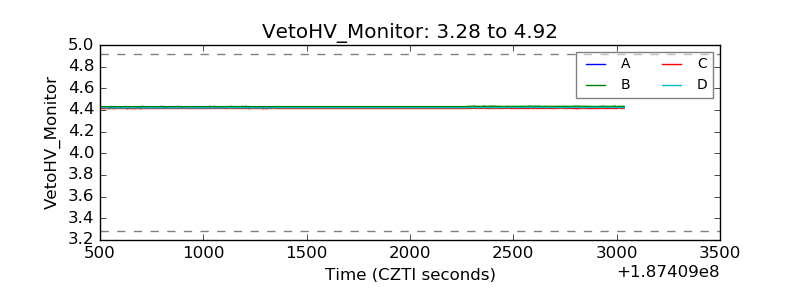 |
| Veto LLD | 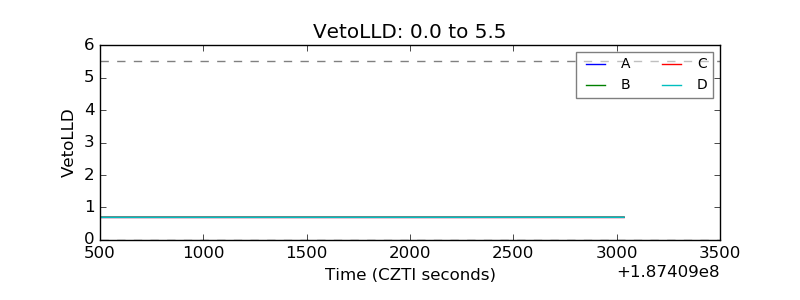 |
| Alpha Counter | 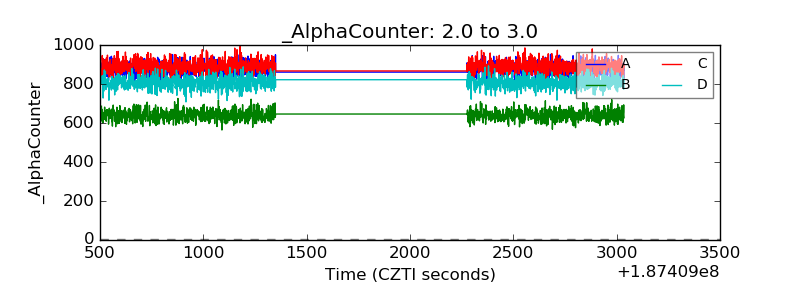 |
| _CPM_Rate | 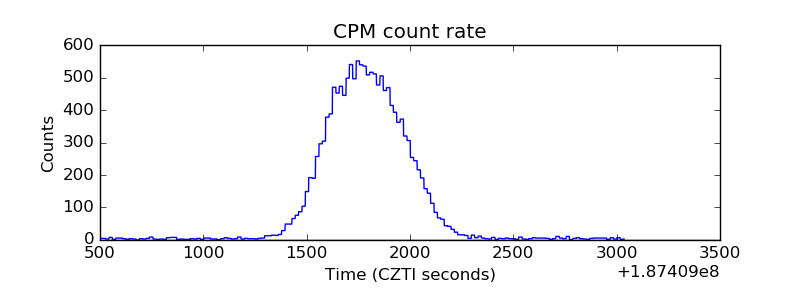 |
| CZT Counter | 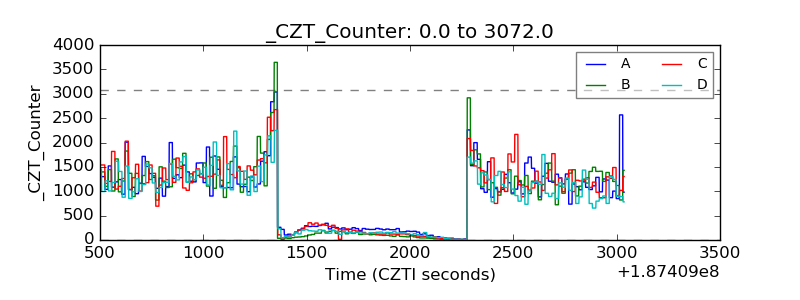 |
| +2.5 Volts monitor |  |
| +5 Volts monitor |  |
| _ROLL_ROT | 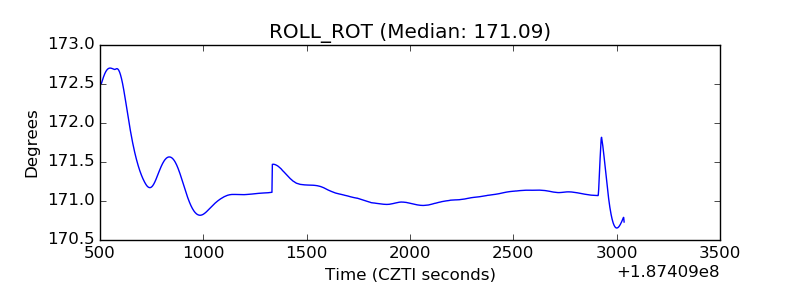 |
| _Roll_DEC | 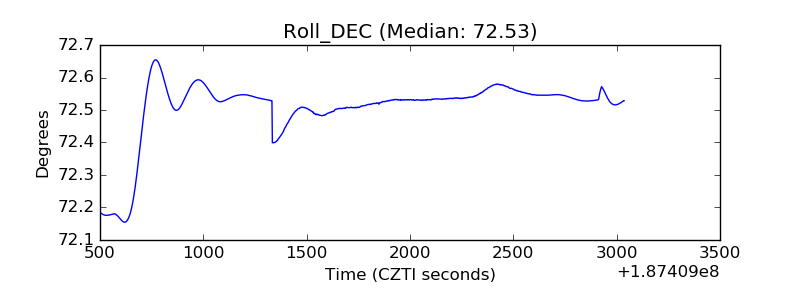 |
| _Roll_RA | 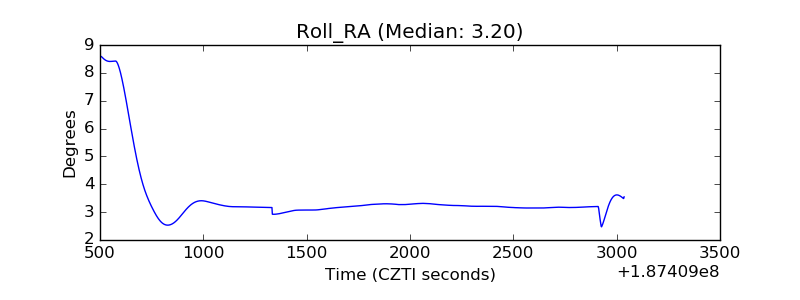 |
| Veto Counter | 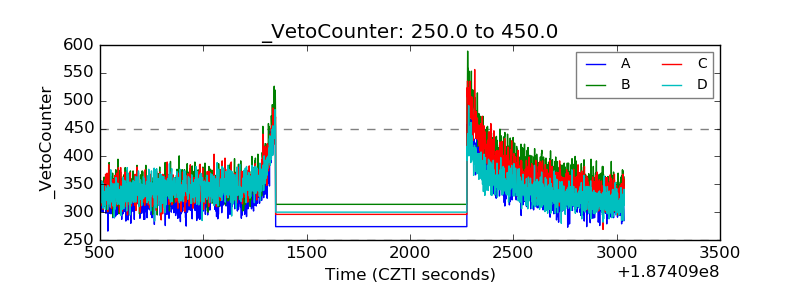 |