| Param | Original file | Final file |
|---|---|---|
| Filename | modeM0/AS1P01_180T10_9000000192_01082cztM0_level2.evt | modeM0/AS1P01_180T10_9000000192_01082cztM0_level2_quad_clean.evt |
| Size (bytes) | 125,904,960 | 12,507,840 |
| Size | 120.1 MB | 11.9 MB |
| Events in quadrant A | 944,491 | 80,103 |
| Events in quadrant B | 1,009,489 | 80,308 |
| Events in quadrant C | 972,774 | 78,752 |
| Events in quadrant D | 832,634 | 78,596 |
| Mode SS | |||
|---|---|---|---|
| Quadrant | BADHDUFLAG | Total packets | Discarded packets |
| A | 0 | 14 | 0 |
| B | 0 | 14 | 0 |
| C | 0 | 14 | 0 |
| D | 0 | 14 | 0 |
| Mode M0 | |||
|---|---|---|---|
| Quadrant | BADHDUFLAG | Total packets | Discarded packets |
| A | 0 | 3330 | 1 |
| B | 0 | 3535 | 1 |
| C | 0 | 3424 | 1 |
| D | 0 | 3012 | 1 |
| Quadrant | Total seconds | Saturated seconds | Saturation percentage |
|---|---|---|---|
| A | 761 | 2 | 0.262812% |
| B | 761 | 1 | 0.131406% |
| C | 761 | 0 | 0.000000% |
| D | 761 | 0 | 0.000000% |
Noise dominated data is calculated using 1-second bins in cleaned event files. If a bin has >2000 counts, and if more than 50% of those come from <1% of pixels, then it is considered to be noise-dominated and hence unusable.
| Quadrant | # 1 sec bins | Bins with >0 counts | Bins with >2000 counts | High rate bins dominated by noise | Noise dominated (total time) | Noise dominated (detector-on time) | Marked lightcurve |
|---|---|---|---|---|---|---|---|
| A | 761 | 761 | 26 | 26 | 3.42% | 3.42% | 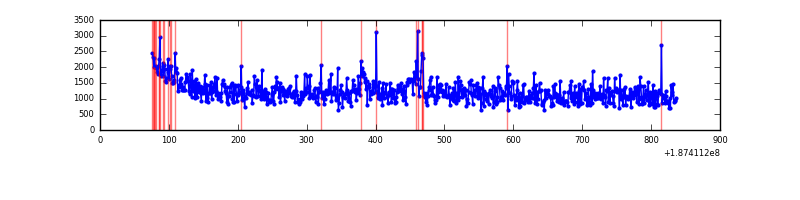 |
| B | 761 | 761 | 34 | 34 | 4.47% | 4.47% | 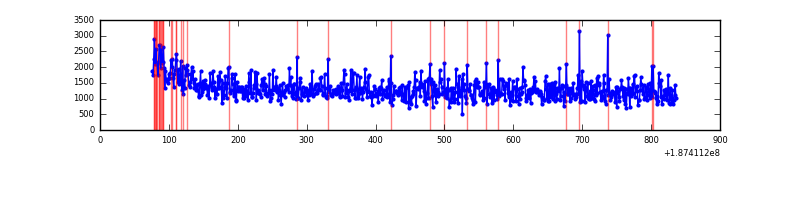 |
| C | 761 | 761 | 29 | 29 | 3.81% | 3.81% | 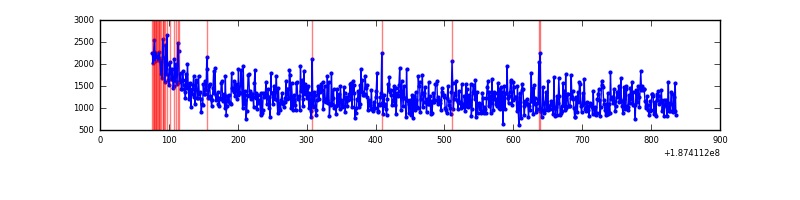 |
| D | 761 | 761 | 10 | 10 | 1.31% | 1.31% | 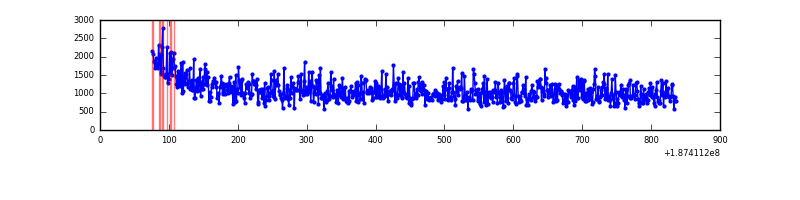 |
Top three noisy pixels from each quadrant. If the there are fewer than three noisy pixels in the level2.evt file, extra rows are filled as -1
| Pixel properties | Quadrant properties | ||||||
|---|---|---|---|---|---|---|---|
| Quadrant | DetID | PixID | Counts | Sigma | Mean | Median | Sigma |
| A | 15 | 233 | 26277 | 439.27 | 239 | 241 | 59.3 |
| A | 12 | 243 | 1330 | 18.37 | 239 | 241 | 59.3 |
| A | 3 | 111 | 851 | 10.29 | 239 | 241 | 59.3 |
| B | 5 | 191 | 2723 | 38.93 | 264 | 265 | 63.1 |
| B | 5 | 184 | 1308 | 16.52 | 264 | 265 | 63.1 |
| B | 15 | 255 | 959 | 10.99 | 264 | 265 | 63.1 |
| C | 15 | 241 | 34561 | 501.69 | 238 | 247 | 68.4 |
| C | 9 | 202 | 2539 | 33.51 | 238 | 247 | 68.4 |
| C | 7 | 159 | 1855 | 23.51 | 238 | 247 | 68.4 |
| D | 10 | 125 | 4738 | 64.01 | 219 | 226 | 70.5 |
| D | 15 | 13 | 2674 | 34.73 | 219 | 226 | 70.5 |
| D | 7 | 143 | 1413 | 16.84 | 219 | 226 | 70.5 |
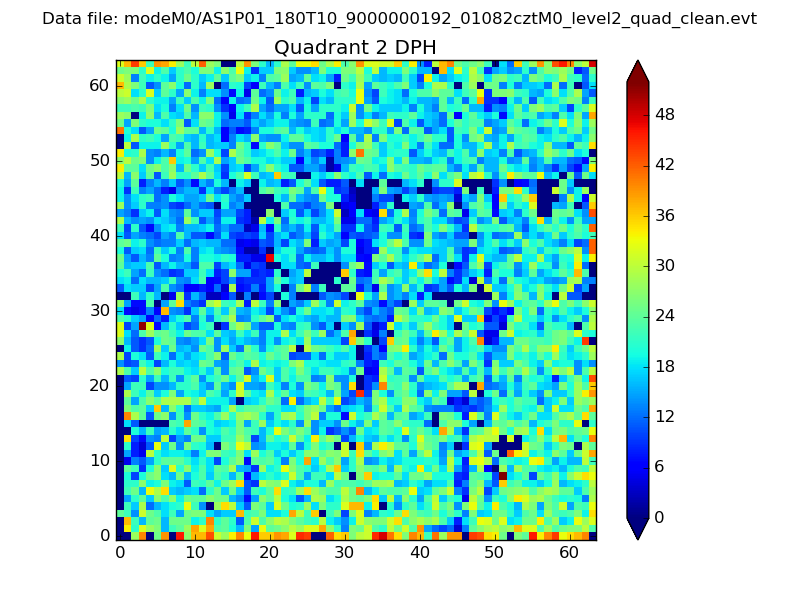
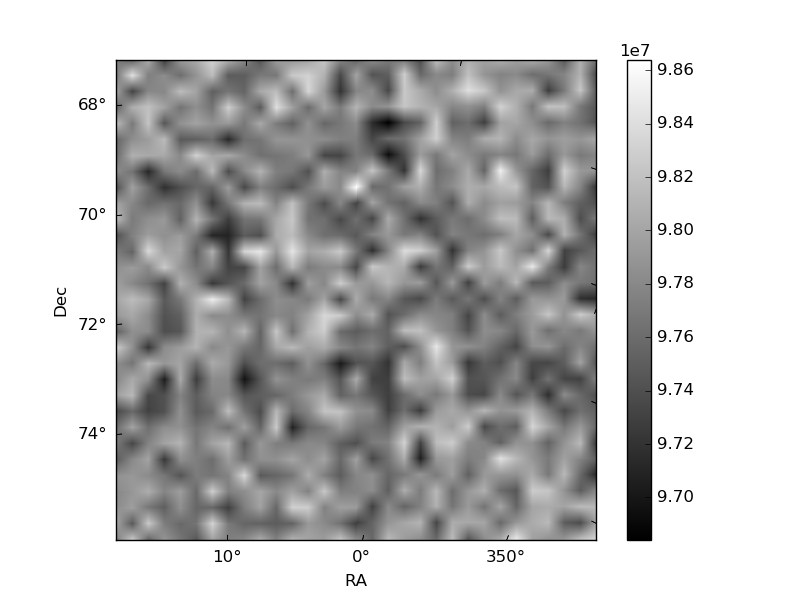
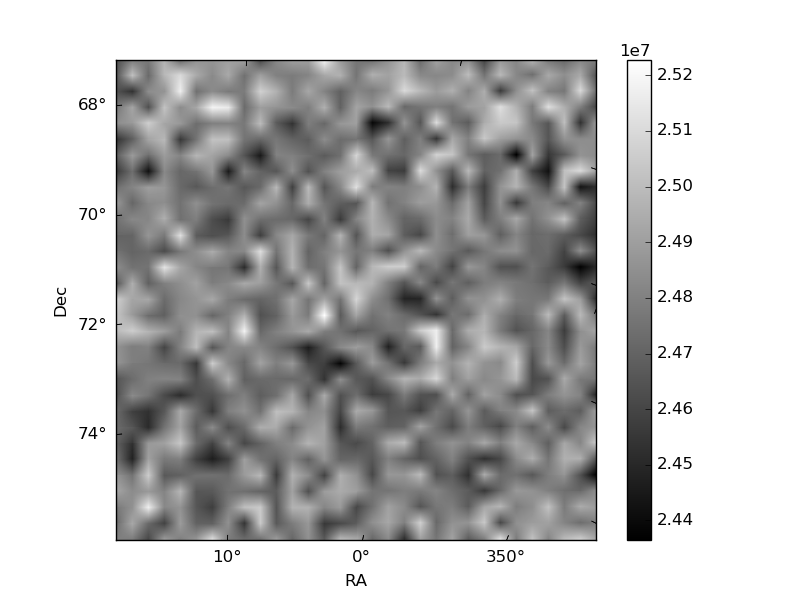
Histogram calculated using DETX and DETY for each event in the final _common_clean file
| Quadrant A | 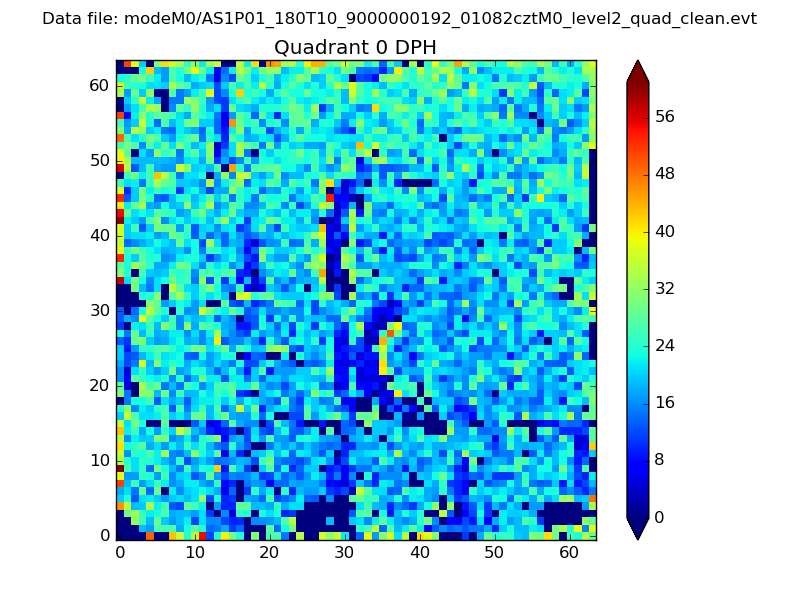 |
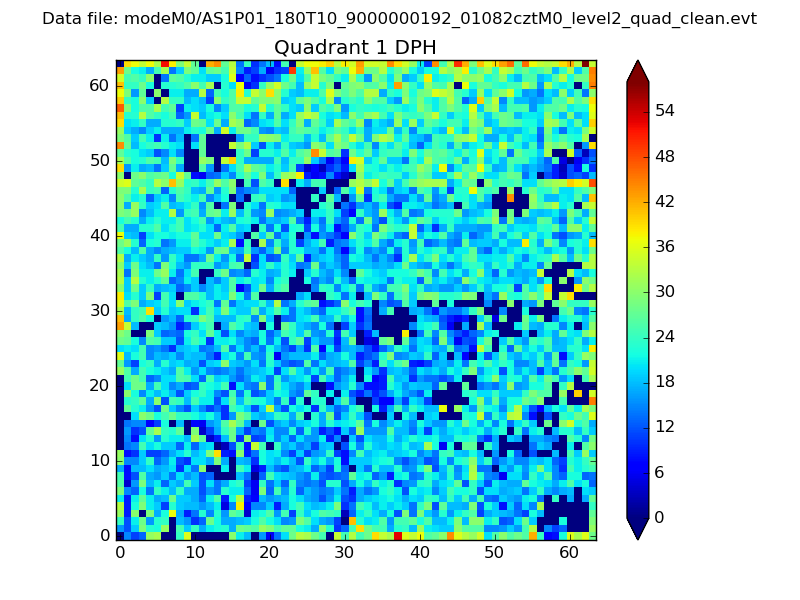 |
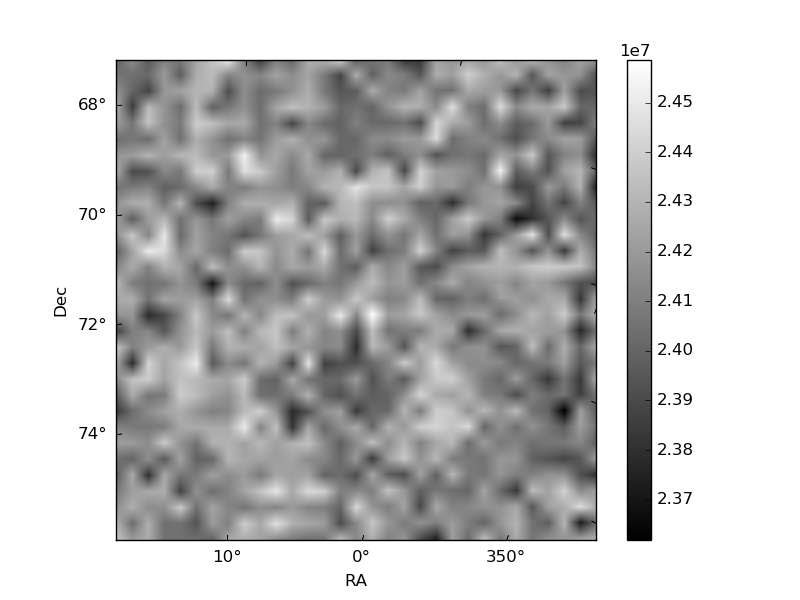
Quadrant B |
|---|---|---|---|
| Quadrant D | 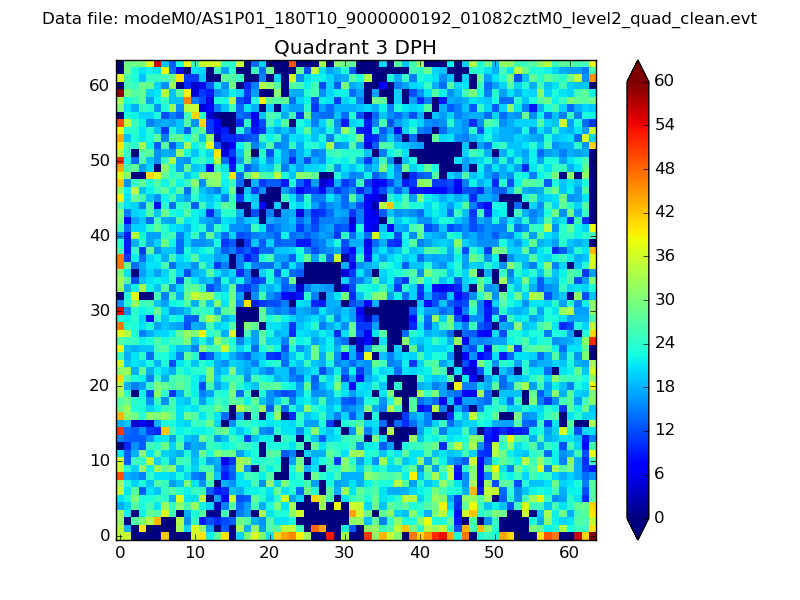 |
 |
Quadrant C |
| Plot type | Count rate plots | Images |
|---|---|---|
| Comparison with Poisson distribution Blue bars denote a histogram of data divided into 1 sec bins. Red curve is a Poisson curve with rate = median count rate of data. |
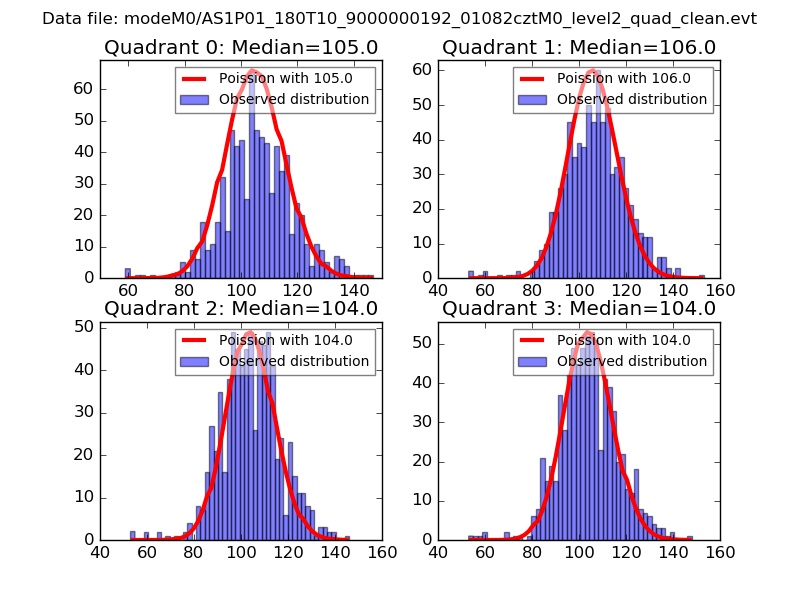 |
 |
| Quadrant-wise count rates Data is divided into 100 sec bins |
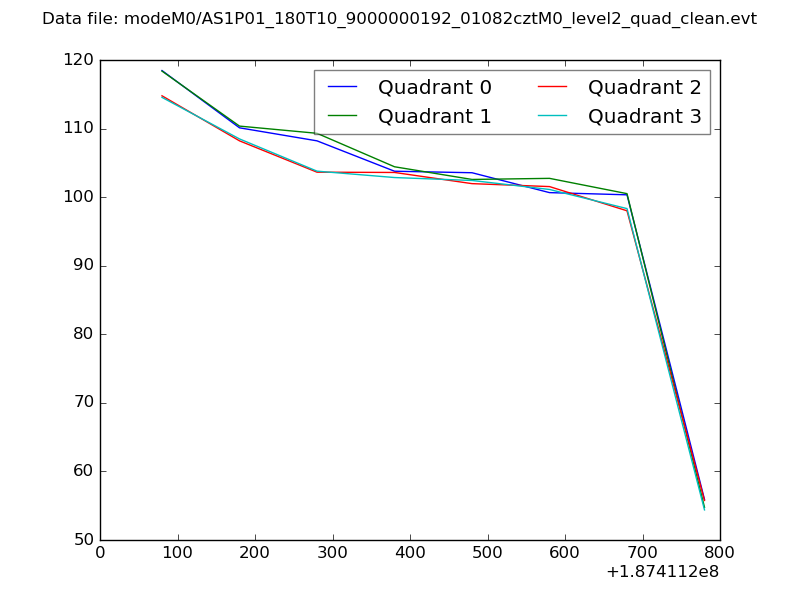 |
|
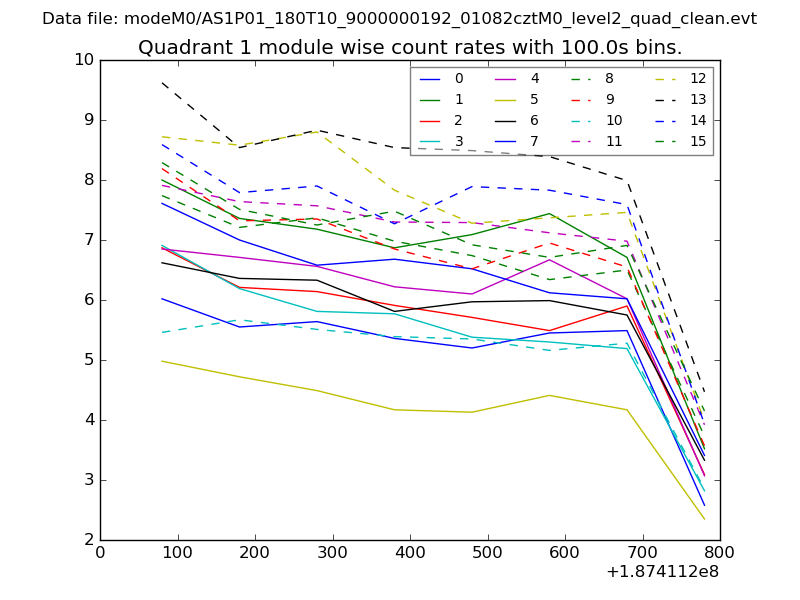
| Module-wise count rates for Quadrant A Data is divided into 100 sec bins |
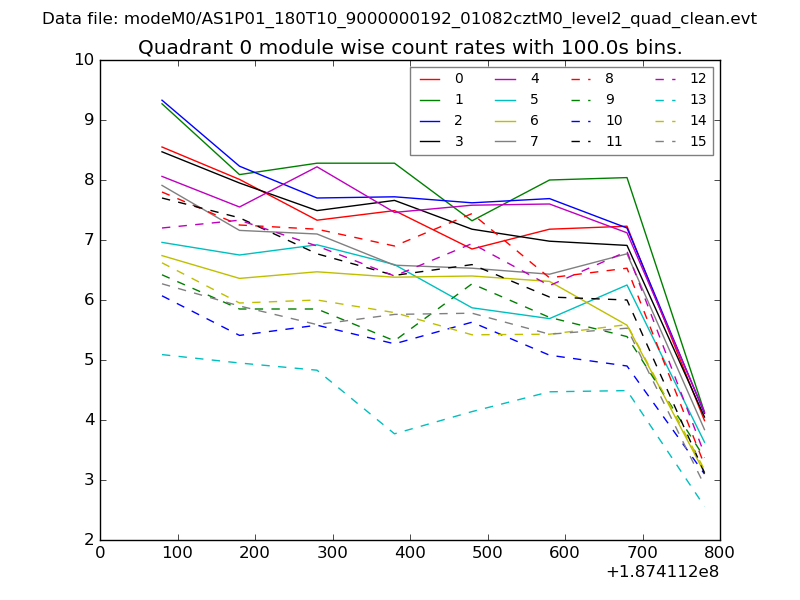 |
 |
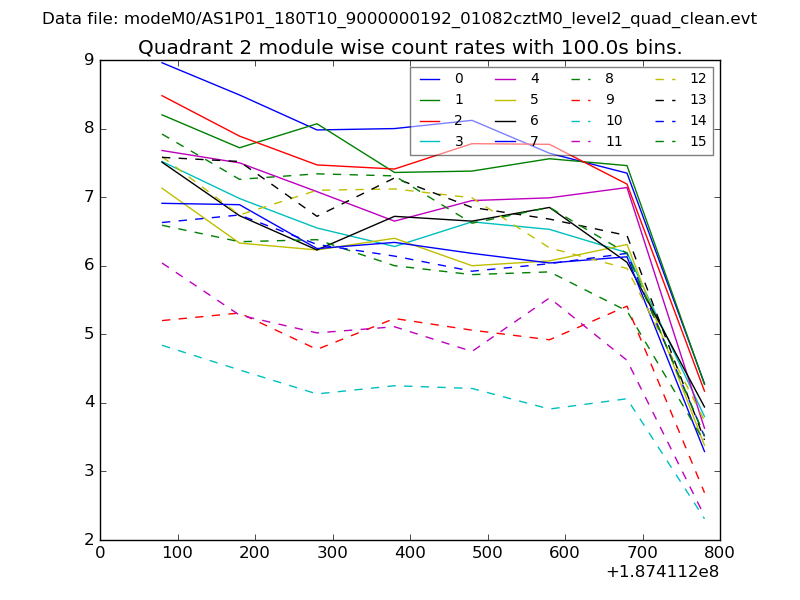
| Module-wise count rates for Quadrant B Data is divided into 100 sec bins |
 |
 |
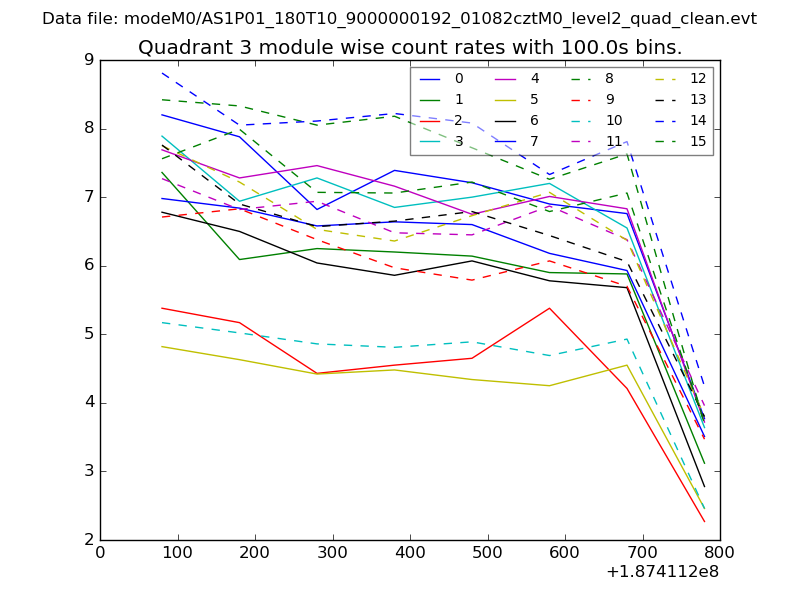
| Module-wise count rates for Quadrant C Data is divided into 100 sec bins |
 |
 |
| Module-wise count rates for Quadrant D Data is divided into 100 sec bins |
 |
 |
| Parameter | Plot |
|---|---|
| CZT HV Monitor | 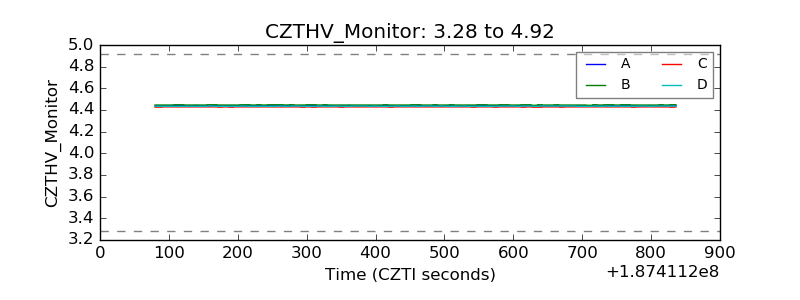 |
| D_VDD | 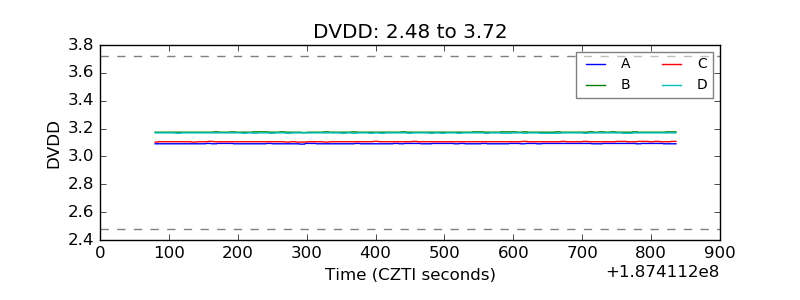 |
| Temperature 1 | 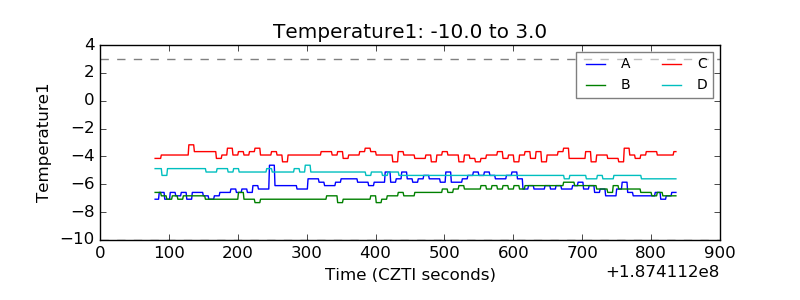 |
| Veto HV Monitor | 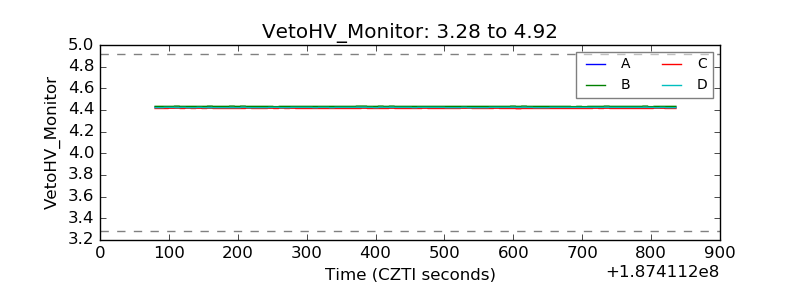 |
| Veto LLD | 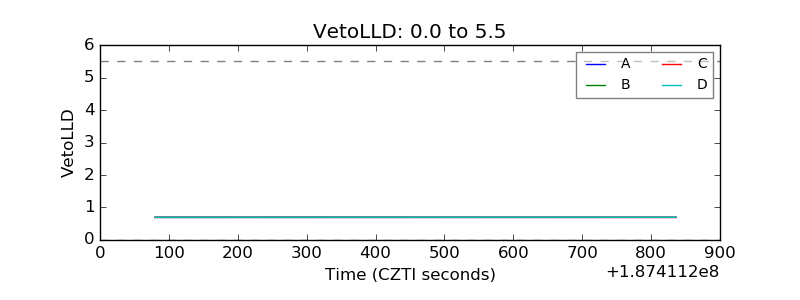 |
| Alpha Counter | 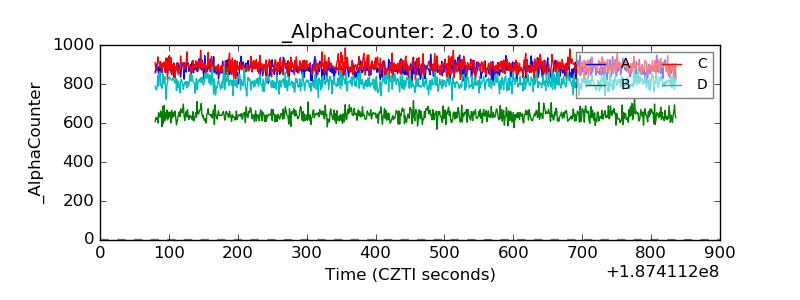 |
| _CPM_Rate | 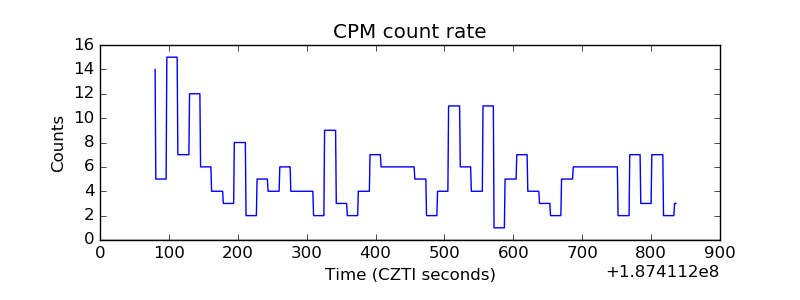 |
| CZT Counter | 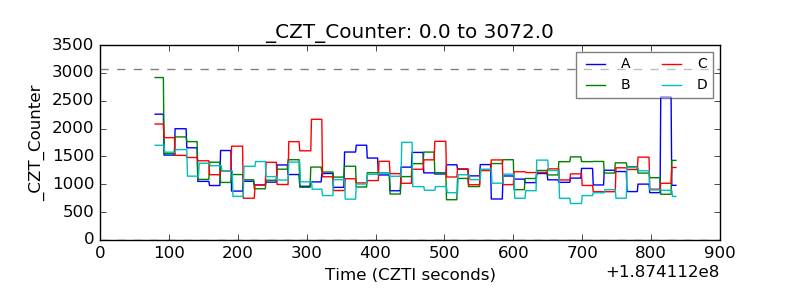 |
| +2.5 Volts monitor | 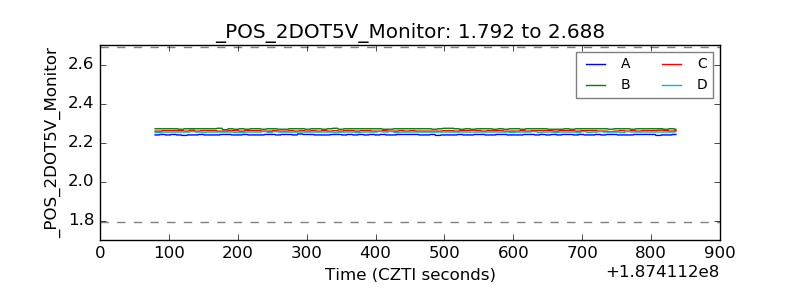 |
| +5 Volts monitor | 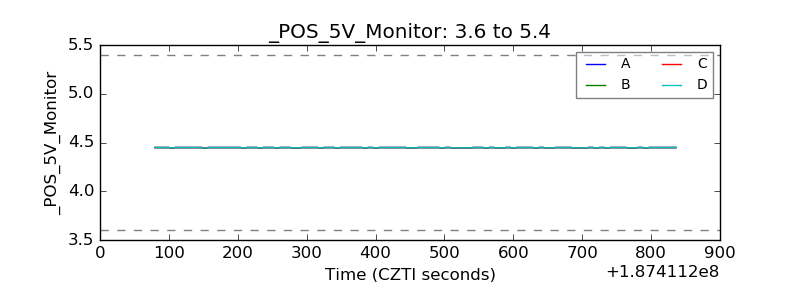 |
| _ROLL_ROT | 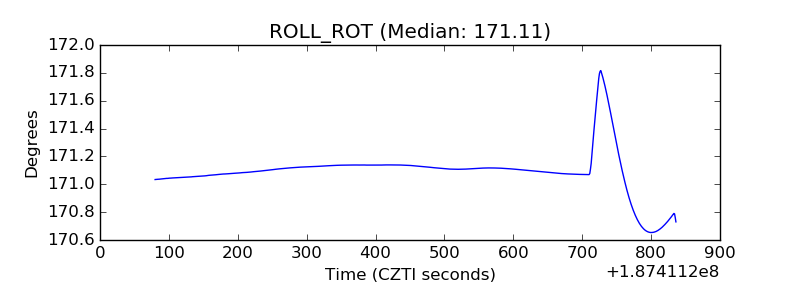 |
| _Roll_DEC | 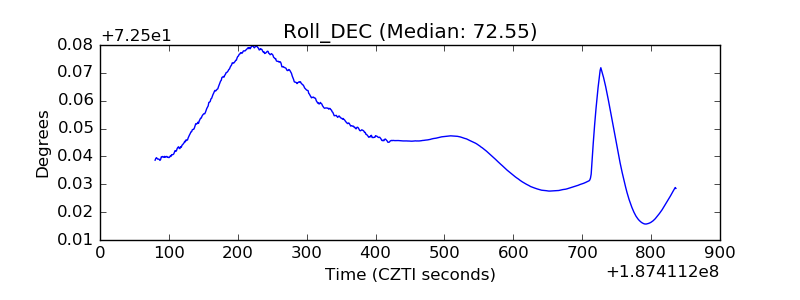 |
| _Roll_RA | 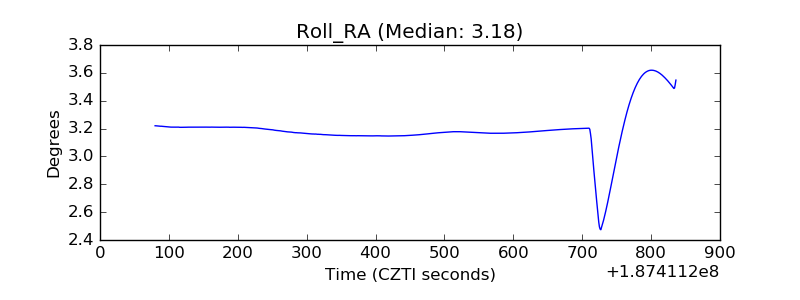 |
| Veto Counter | 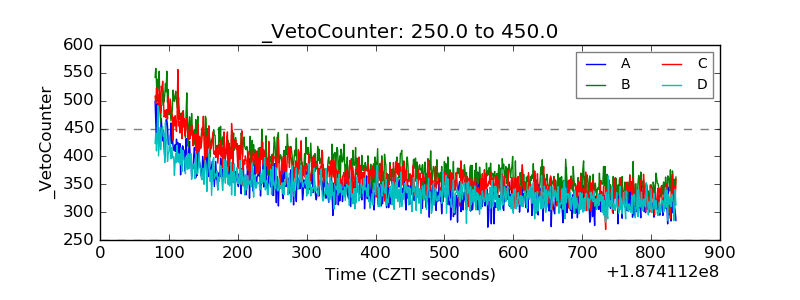 |