| Param | Original file | Final file |
|---|---|---|
| Filename | modeM0/AS1P01_180T10_9000000196cztM0_level2.fits | modeM0/AS1P01_180T10_9000000196cztM0_level2_quad_clean.evt |
| Size (bytes) | 27,397,440 | 19,771,200 |
| Size | 26.1 MB | 18.9 MB |
| Events in quadrant A | 159,176 | 101,479 |
| Events in quadrant B | 147,328 | 83,585 |
| Events in quadrant C | 153,928 | 90,452 |
| Events in quadrant D | 134,804 | 87,540 |
| Mode M9 | |||
|---|---|---|---|
| Quadrant | BADHDUFLAG | Total packets | Discarded packets |
| A | 0 | 11 | 0 |
| B | 0 | 11 | 0 |
| C | 0 | 11 | 0 |
| D | 0 | 11 | 0 |
| Mode SS | |||
|---|---|---|---|
| Quadrant | BADHDUFLAG | Total packets | Discarded packets |
| A | 0 | 68 | 0 |
| B | 0 | 68 | 0 |
| C | 0 | 68 | 0 |
| D | 0 | 68 | 0 |
| Mode M0 | |||
|---|---|---|---|
| Quadrant | BADHDUFLAG | Total packets | Discarded packets |
| A | 0 | 14073 | 0 |
| B | 0 | 16239 | 0 |
| C | 0 | 14126 | 0 |
| D | 0 | 13368 | 0 |
| Quadrant | Total seconds | Saturated seconds | Saturation percentage |
|---|---|---|---|
| A | 3304 | 3 | 0.090799% |
| B | 3304 | 216 | 6.537530% |
| C | 3304 | 3 | 0.090799% |
| D | 3304 | 3 | 0.090799% |
Noise dominated data is calculated using 1-second bins in cleaned event files. If a bin has >2000 counts, and if more than 50% of those come from <1% of pixels, then it is considered to be noise-dominated and hence unusable.
| Quadrant | # 1 sec bins | Bins with >0 counts | Bins with >2000 counts | High rate bins dominated by noise | Noise dominated (total time) | Noise dominated (detector-on time) | Marked lightcurve |
|---|---|---|---|---|---|---|---|
| A | 4388 | 3303 | 0 | 0 | 0.00% | 0.00% |  |
| B | 4388 | 3296 | 0 | 0 | 0.00% | 0.00% |  |
| C | 4388 | 3303 | 0 | 0 | 0.00% | 0.00% |  |
| D | 4389 | 3303 | 0 | 0 | 0.00% | 0.00% |  |
Top three noisy pixels from each quadrant. If the there are fewer than three noisy pixels in the level2.evt file, extra rows are filled as -1
| Pixel properties | Quadrant properties | ||||||
|---|---|---|---|---|---|---|---|
| Quadrant | DetID | PixID | Counts | Sigma | Mean | Median | Sigma |
| A | 7 | 110 | 159 | 10.07 | 41 | 39 | 11.9 |
| A | 0 | 29 | 149 | 9.23 | 41 | 39 | 11.9 |
| A | 14 | 30 | 135 | 8.06 | 41 | 39 | 11.9 |
| B | 14 | 254 | 108 | 7.44 | 39 | 37 | 9.5 |
| B | 2 | 9 | 104 | 7.02 | 39 | 37 | 9.5 |
| B | 14 | 223 | 94 | 5.97 | 39 | 37 | 9.5 |
| C | 12 | 241 | 108 | 5.9 | 40 | 38 | 11.9 |
| C | 2 | 191 | 104 | 5.56 | 40 | 38 | 11.9 |
| C | 14 | 38 | 103 | 5.48 | 40 | 38 | 11.9 |
| D | 6 | 238 | 106 | 6.55 | 38 | 35 | 10.8 |
| D | 6 | 44 | 100 | 6.0 | 38 | 35 | 10.8 |
| D | 3 | 30 | 99 | 5.9 | 38 | 35 | 10.8 |
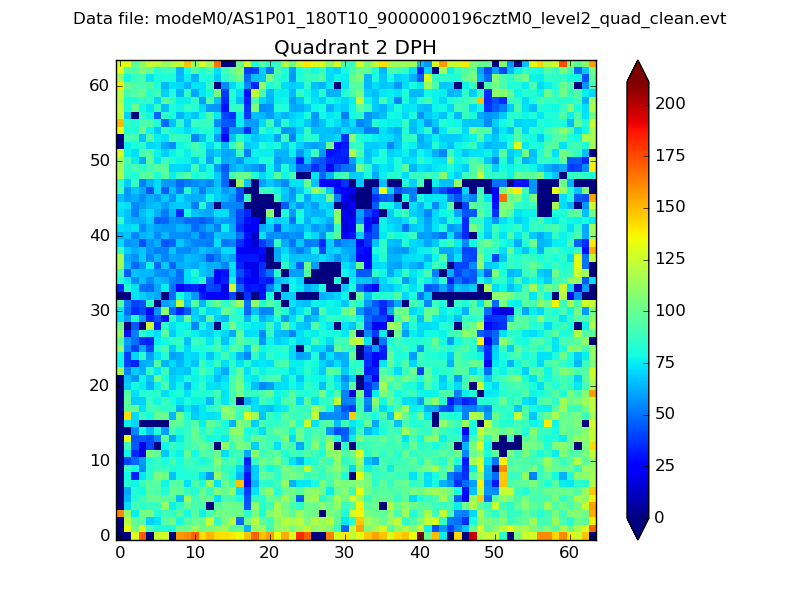
Histogram calculated using DETX and DETY for each event in the final _common_clean file
| Quadrant A |  |
 |
Quadrant B |
|---|---|---|---|
| Quadrant D | 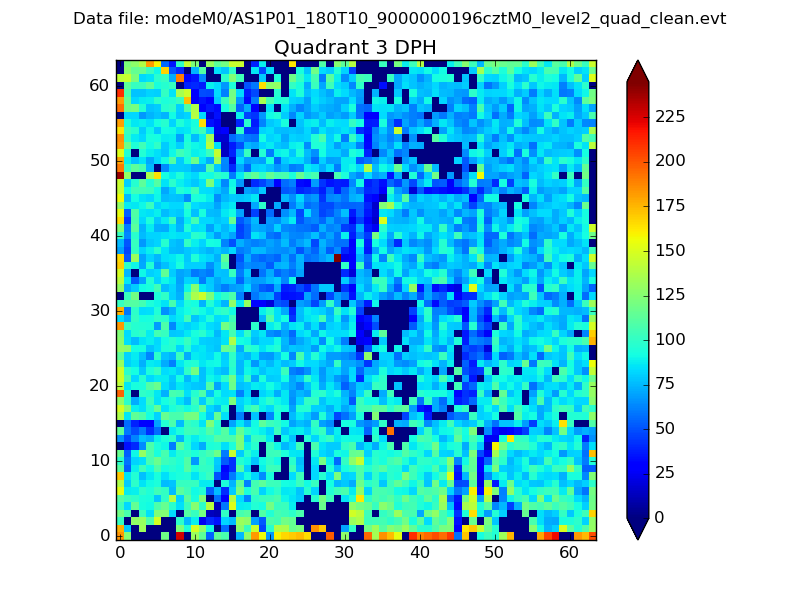 |
 |
Quadrant C |
| Plot type | Count rate plots | Images |
|---|---|---|
| Comparison with Poisson distribution Blue bars denote a histogram of data divided into 1 sec bins. Red curve is a Poisson curve with rate = median count rate of data. |
 |
 |
| Quadrant-wise count rates Data is divided into 100 sec bins |
 |
|
| Module-wise count rates for Quadrant A Data is divided into 100 sec bins |
 |
 |
| Module-wise count rates for Quadrant B Data is divided into 100 sec bins |
 |
 |
| Module-wise count rates for Quadrant C Data is divided into 100 sec bins |
 |
 |
| Module-wise count rates for Quadrant D Data is divided into 100 sec bins |
 |
 |
| Parameter | Plot |
|---|---|
| CZT HV Monitor |  |
| D_VDD |  |
| Temperature 1 |  |
| Veto HV Monitor | 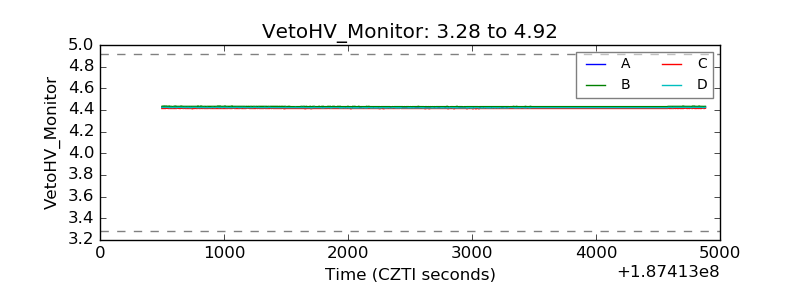 |
| Veto LLD |  |
| Alpha Counter |  |
| _CPM_Rate |  |
| CZT Counter |  |
| +2.5 Volts monitor |  |
| +5 Volts monitor |  |
| _ROLL_ROT |  |
| _Roll_DEC |  |
| _Roll_RA |  |
| Veto Counter |  |