| Param | Original file | Final file |
|---|---|---|
| Filename | modeM0/AS1P01_180T10_9000000200cztM0_level2.fits | modeM0/AS1P01_180T10_9000000200cztM0_level2_quad_clean.evt |
| Size (bytes) | 27,518,400 | 23,506,560 |
| Size | 26.2 MB | 22.4 MB |
| Events in quadrant A | 155,948 | 126,630 |
| Events in quadrant B | 153,742 | 123,558 |
| Events in quadrant C | 152,754 | 114,927 |
| Events in quadrant D | 133,678 | 108,353 |
| Mode SS | |||
|---|---|---|---|
| Quadrant | BADHDUFLAG | Total packets | Discarded packets |
| A | 0 | 70 | 0 |
| B | 0 | 70 | 0 |
| C | 0 | 70 | 0 |
| D | 0 | 70 | 0 |
| Mode M0 | |||
|---|---|---|---|
| Quadrant | BADHDUFLAG | Total packets | Discarded packets |
| A | 0 | 13905 | 0 |
| B | 0 | 14778 | 0 |
| C | 0 | 14123 | 0 |
| D | 0 | 13647 | 0 |
| Mode M9 | |||
|---|---|---|---|
| Quadrant | BADHDUFLAG | Total packets | Discarded packets |
| A | 0 | 10 | 0 |
| B | 0 | 10 | 0 |
| C | 0 | 10 | 0 |
| D | 0 | 10 | 0 |
| Quadrant | Total seconds | Saturated seconds | Saturation percentage |
|---|---|---|---|
| A | 3342 | 37 | 1.107121% |
| B | 3342 | 60 | 1.795332% |
| C | 3342 | 24 | 0.718133% |
| D | 3342 | 31 | 0.927588% |
Noise dominated data is calculated using 1-second bins in cleaned event files. If a bin has >2000 counts, and if more than 50% of those come from <1% of pixels, then it is considered to be noise-dominated and hence unusable.
| Quadrant | # 1 sec bins | Bins with >0 counts | Bins with >2000 counts | High rate bins dominated by noise | Noise dominated (total time) | Noise dominated (detector-on time) | Marked lightcurve |
|---|---|---|---|---|---|---|---|
| A | 3341 | 3341 | 0 | 0 | 0.00% | 0.00% |  |
| B | 3341 | 3341 | 0 | 0 | 0.00% | 0.00% |  |
| C | 3341 | 3341 | 0 | 0 | 0.00% | 0.00% |  |
| D | 3341 | 3341 | 0 | 0 | 0.00% | 0.00% |  |
Top three noisy pixels from each quadrant. If the there are fewer than three noisy pixels in the level2.evt file, extra rows are filled as -1
| Pixel properties | Quadrant properties | ||||||
|---|---|---|---|---|---|---|---|
| Quadrant | DetID | PixID | Counts | Sigma | Mean | Median | Sigma |
| A | 9 | 19 | 130 | 8.03 | 40 | 38 | 11.5 |
| A | 0 | 29 | 128 | 7.86 | 40 | 38 | 11.5 |
| A | 7 | 110 | 126 | 7.68 | 40 | 38 | 11.5 |
| B | 2 | 9 | 127 | 8.92 | 40 | 39 | 9.9 |
| B | 14 | 254 | 109 | 7.09 | 40 | 39 | 9.9 |
| B | 2 | 238 | 109 | 7.09 | 40 | 39 | 9.9 |
| C | 2 | 127 | 109 | 6.19 | 40 | 37 | 11.6 |
| C | 1 | 160 | 108 | 6.11 | 40 | 37 | 11.6 |
| C | 9 | 188 | 106 | 5.93 | 40 | 37 | 11.6 |
| D | 10 | 189 | 122 | 8.16 | 38 | 35 | 10.7 |
| D | 6 | 38 | 109 | 6.94 | 38 | 35 | 10.7 |
| D | 11 | 82 | 101 | 6.19 | 38 | 35 | 10.7 |
Histogram calculated using DETX and DETY for each event in the final _common_clean file
| Quadrant A |  |
 |
Quadrant B |
|---|---|---|---|
| Quadrant D | 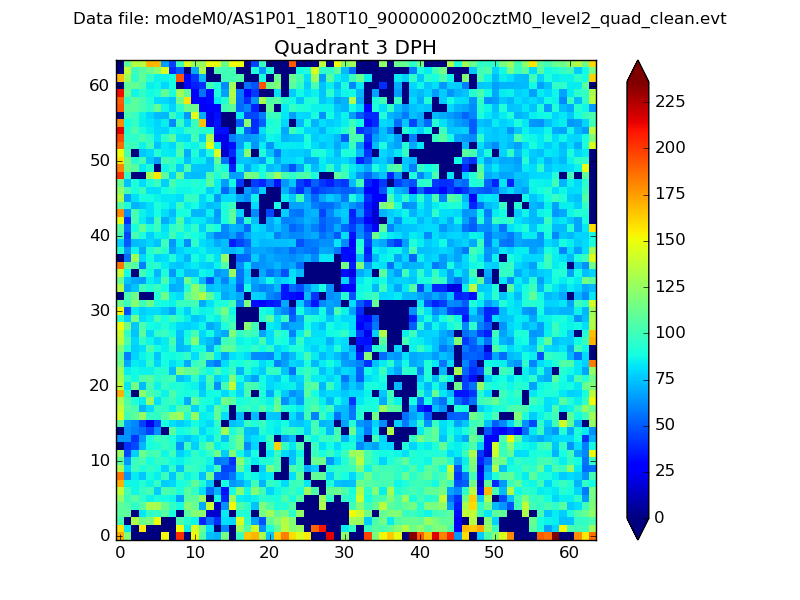 |
 |
Quadrant C |
| Plot type | Count rate plots | Images |
|---|---|---|
| Comparison with Poisson distribution Blue bars denote a histogram of data divided into 1 sec bins. Red curve is a Poisson curve with rate = median count rate of data. |
 |
 |
| Quadrant-wise count rates Data is divided into 100 sec bins |
 |
|
| Module-wise count rates for Quadrant A Data is divided into 100 sec bins |
 |
 |
| Module-wise count rates for Quadrant B Data is divided into 100 sec bins |
 |
 |
| Module-wise count rates for Quadrant C Data is divided into 100 sec bins |
 |
 |
| Module-wise count rates for Quadrant D Data is divided into 100 sec bins |
 |
 |
| Parameter | Plot |
|---|---|
| CZT HV Monitor |  |
| D_VDD | 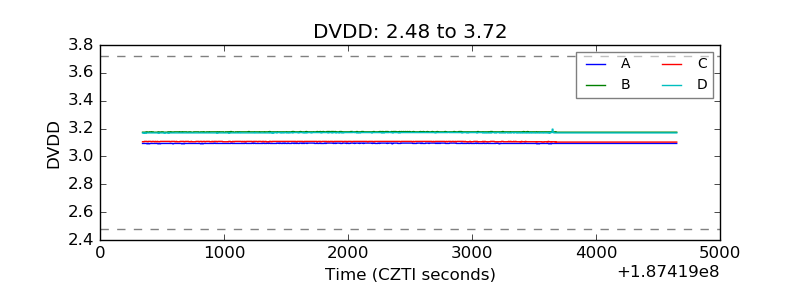 |
| Temperature 1 |  |
| Veto HV Monitor |  |
| Veto LLD |  |
| Alpha Counter |  |
| _CPM_Rate |  |
| CZT Counter |  |
| +2.5 Volts monitor |  |
| +5 Volts monitor |  |
| _ROLL_ROT |  |
| _Roll_DEC |  |
| _Roll_RA |  |
| Veto Counter |  |