| Param | Original file | Final file |
|---|---|---|
| Filename | modeM0/AS1P01_180T10_9000000200_01083cztM0_level2.evt | modeM0/AS1P01_180T10_9000000200_01083cztM0_level2_quad_clean.evt |
| Size (bytes) | 528,802,560 | 50,676,480 |
| Size | 504.3 MB | 48.3 MB |
| Events in quadrant A | 3,883,647 | 333,020 |
| Events in quadrant B | 4,171,735 | 329,829 |
| Events in quadrant C | 3,951,312 | 317,916 |
| Events in quadrant D | 3,784,221 | 316,168 |
| Mode SS | |||
|---|---|---|---|
| Quadrant | BADHDUFLAG | Total packets | Discarded packets |
| A | 0 | 70 | 0 |
| B | 0 | 70 | 0 |
| C | 0 | 70 | 0 |
| D | 0 | 70 | 0 |
| Mode M0 | |||
|---|---|---|---|
| Quadrant | BADHDUFLAG | Total packets | Discarded packets |
| A | 0 | 13905 | 0 |
| B | 0 | 14778 | 0 |
| C | 0 | 14123 | 0 |
| D | 0 | 13647 | 0 |
| Mode M9 | |||
|---|---|---|---|
| Quadrant | BADHDUFLAG | Total packets | Discarded packets |
| A | 0 | 10 | 0 |
| B | 0 | 10 | 0 |
| C | 0 | 10 | 0 |
| D | 0 | 10 | 0 |
| Quadrant | Total seconds | Saturated seconds | Saturation percentage |
|---|---|---|---|
| A | 3342 | 37 | 1.107121% |
| B | 3342 | 60 | 1.795332% |
| C | 3342 | 24 | 0.718133% |
| D | 3342 | 31 | 0.927588% |
Noise dominated data is calculated using 1-second bins in cleaned event files. If a bin has >2000 counts, and if more than 50% of those come from <1% of pixels, then it is considered to be noise-dominated and hence unusable.
| Quadrant | # 1 sec bins | Bins with >0 counts | Bins with >2000 counts | High rate bins dominated by noise | Noise dominated (total time) | Noise dominated (detector-on time) | Marked lightcurve |
|---|---|---|---|---|---|---|---|
| A | 3341 | 3341 | 79 | 79 | 2.36% | 2.36% | 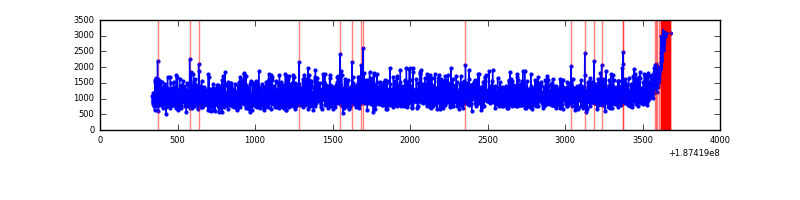 |
| B | 3341 | 3341 | 146 | 146 | 4.37% | 4.37% | 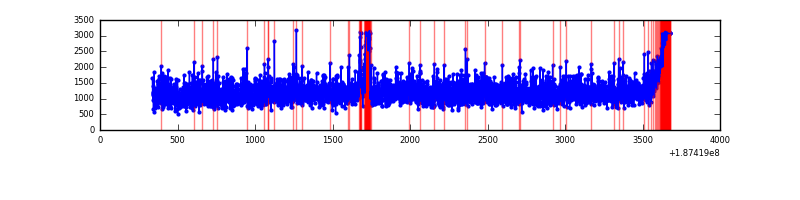 |
| C | 3341 | 3341 | 105 | 105 | 3.14% | 3.14% |  |
| D | 3341 | 3341 | 97 | 97 | 2.90% | 2.90% | 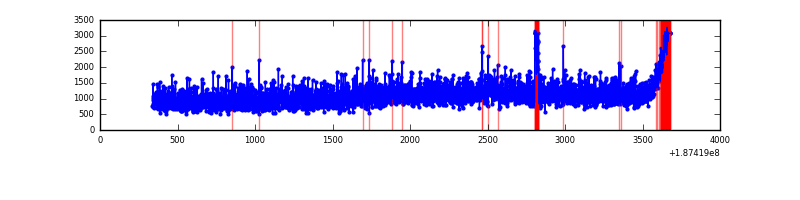 |
Top three noisy pixels from each quadrant. If the there are fewer than three noisy pixels in the level2.evt file, extra rows are filled as -1
| Pixel properties | Quadrant properties | ||||||
|---|---|---|---|---|---|---|---|
| Quadrant | DetID | PixID | Counts | Sigma | Mean | Median | Sigma |
| A | 11 | 79 | 3012 | 8.13 | 1011 | 1016 | 245.5 |
| A | 3 | 111 | 2940 | 7.84 | 1011 | 1016 | 245.5 |
| A | 14 | 203 | 2614 | 6.51 | 1011 | 1016 | 245.5 |
| B | 15 | 22 | 70736 | 278.54 | 1038 | 1042 | 250.2 |
| B | 4 | 172 | 65486 | 257.56 | 1038 | 1042 | 250.2 |
| B | 4 | 187 | 32660 | 126.36 | 1038 | 1042 | 250.2 |
| C | 15 | 241 | 160990 | 595.03 | 958 | 991 | 268.9 |
| C | 3 | 79 | 23321 | 83.04 | 958 | 991 | 268.9 |
| C | 3 | 111 | 16425 | 57.4 | 958 | 991 | 268.9 |
| D | 12 | 22 | 129725 | 439.8 | 953 | 985 | 292.7 |
| D | 2 | 253 | 43644 | 145.73 | 953 | 985 | 292.7 |
| D | 10 | 166 | 19841 | 64.42 | 953 | 985 | 292.7 |
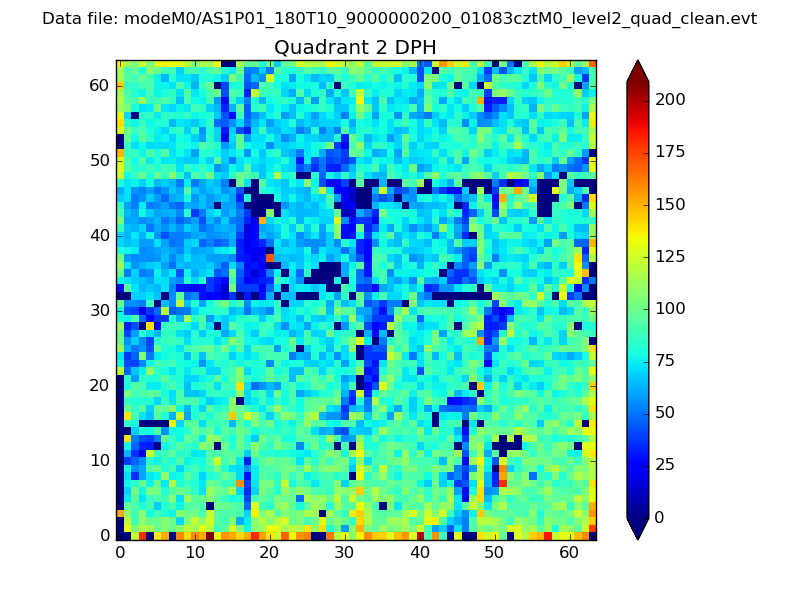
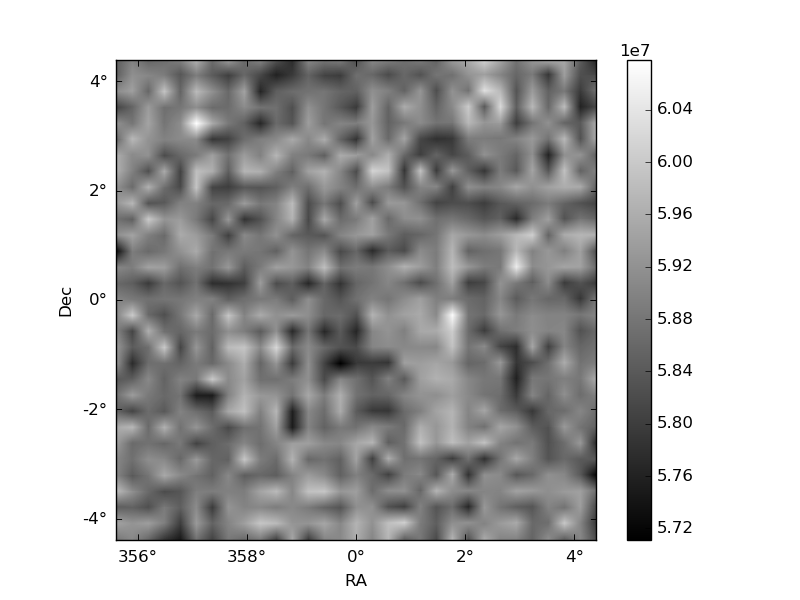
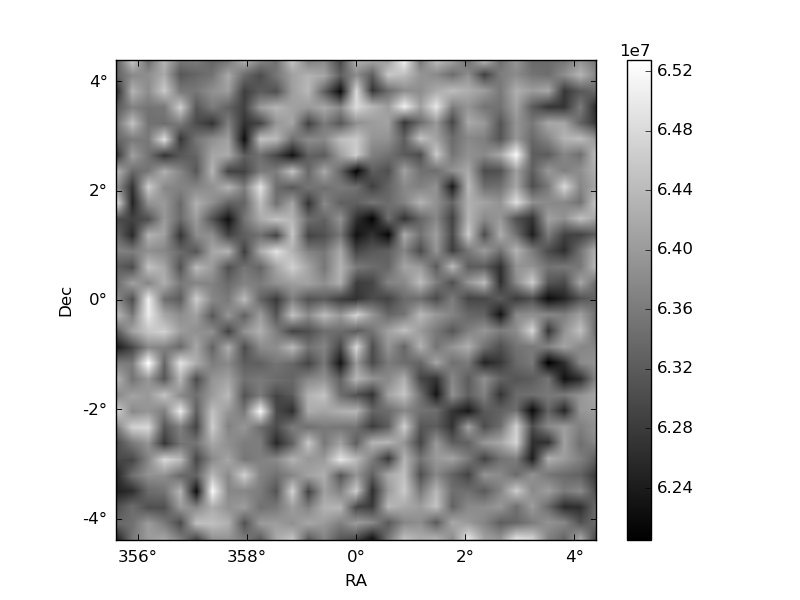
Histogram calculated using DETX and DETY for each event in the final _common_clean file
| Quadrant A |  |
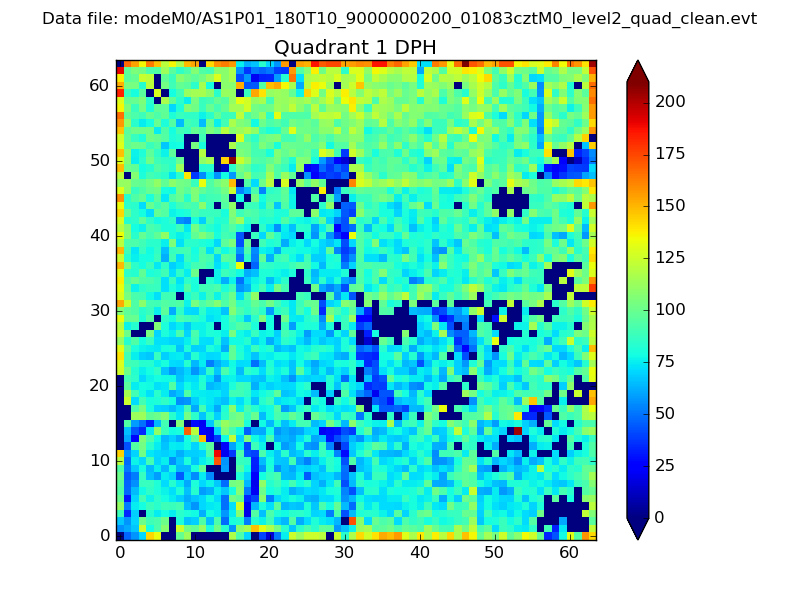 |
Quadrant B |
|---|---|---|---|
| Quadrant D | 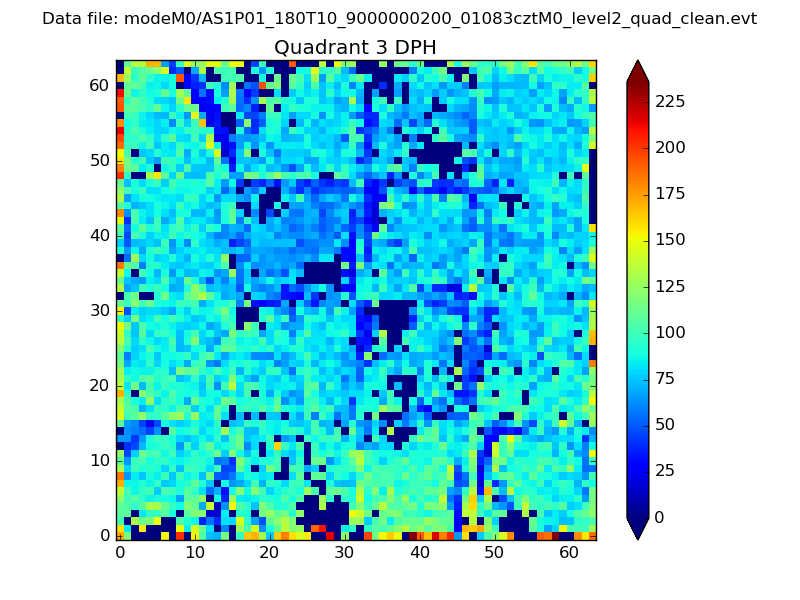 |
 |
Quadrant C |
| Plot type | Count rate plots | Images |
|---|---|---|
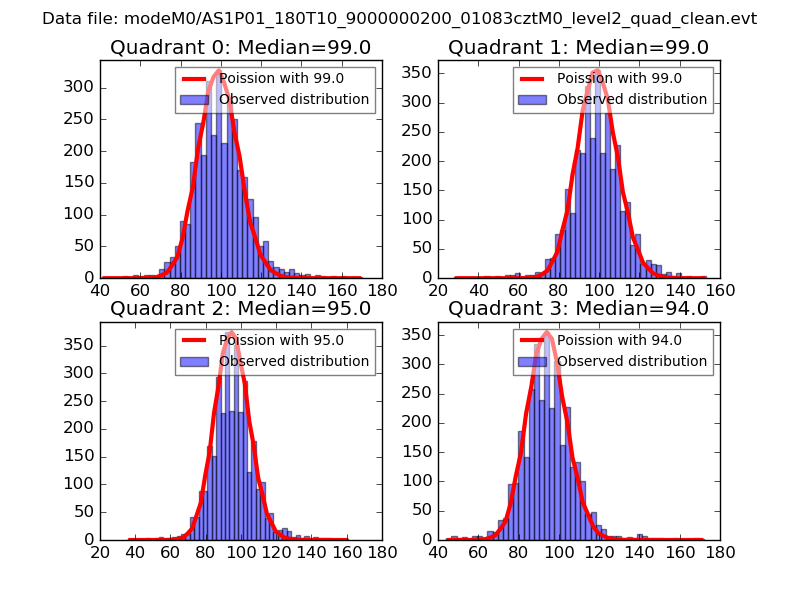
| Comparison with Poisson distribution Blue bars denote a histogram of data divided into 1 sec bins. Red curve is a Poisson curve with rate = median count rate of data. |
 |
 |
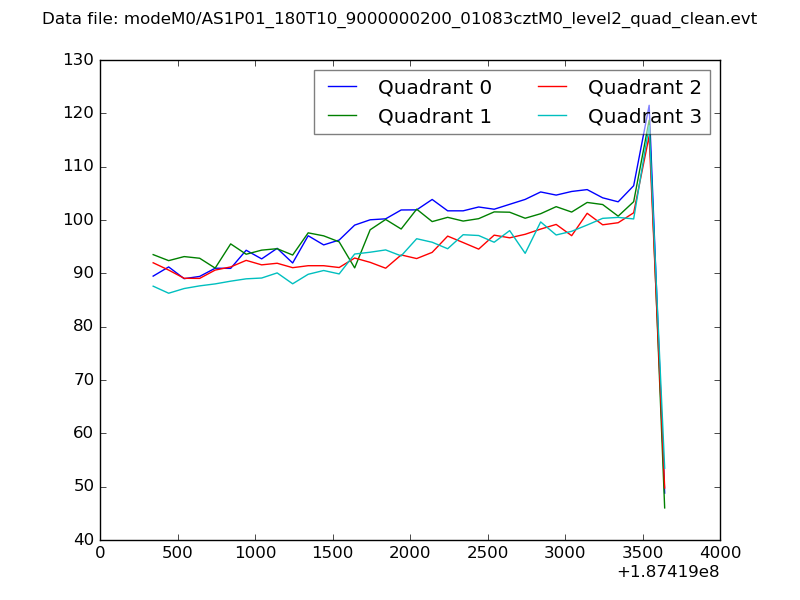
| Quadrant-wise count rates Data is divided into 100 sec bins |
 |
|
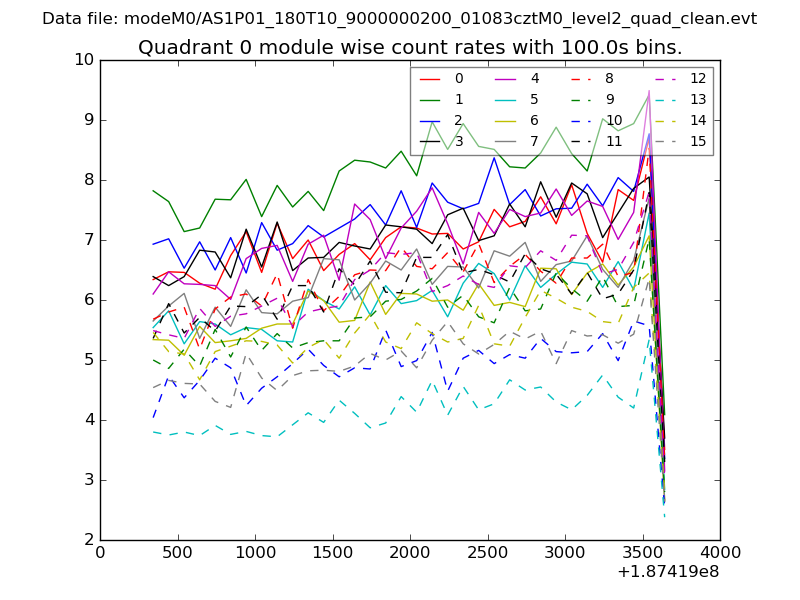
| Module-wise count rates for Quadrant A Data is divided into 100 sec bins |
 |
 |
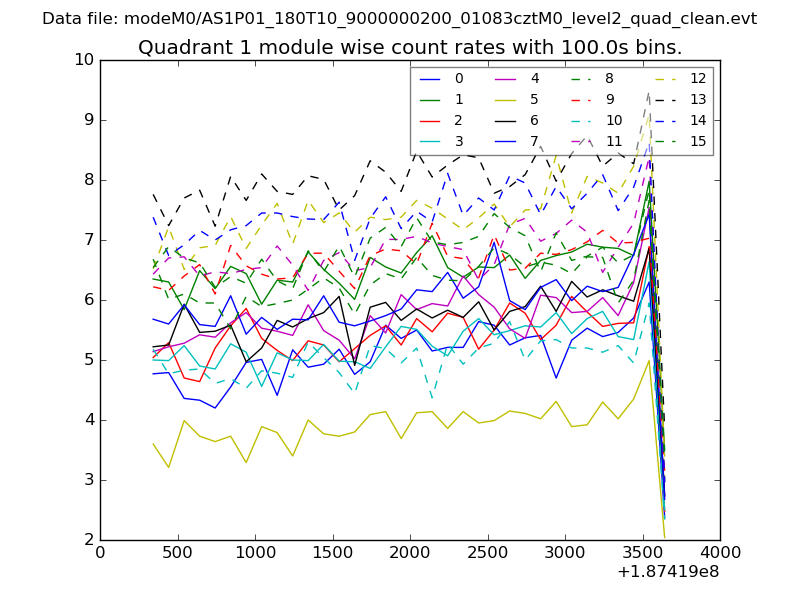
| Module-wise count rates for Quadrant B Data is divided into 100 sec bins |
 |
 |
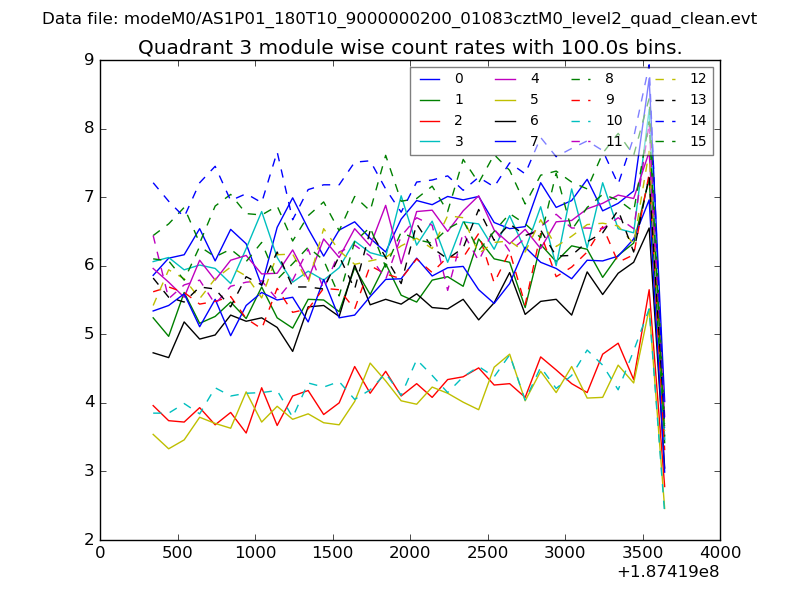
| Module-wise count rates for Quadrant C Data is divided into 100 sec bins |
 |
 |
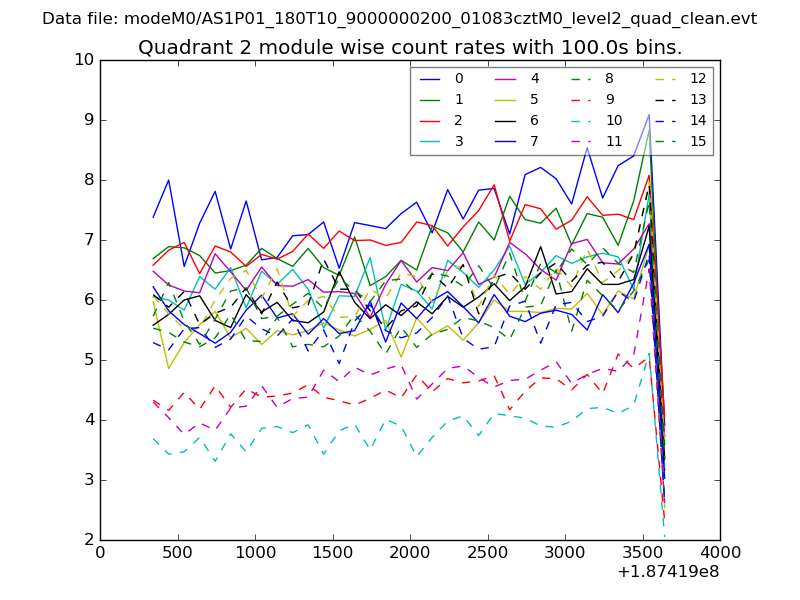
| Module-wise count rates for Quadrant D Data is divided into 100 sec bins |
 |
 |
| Parameter | Plot |
|---|---|
| CZT HV Monitor | 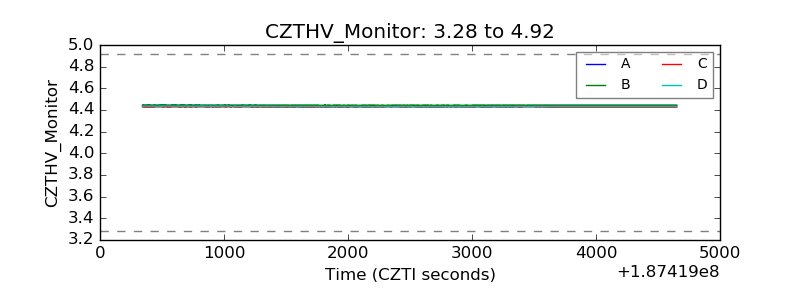 |
| D_VDD | 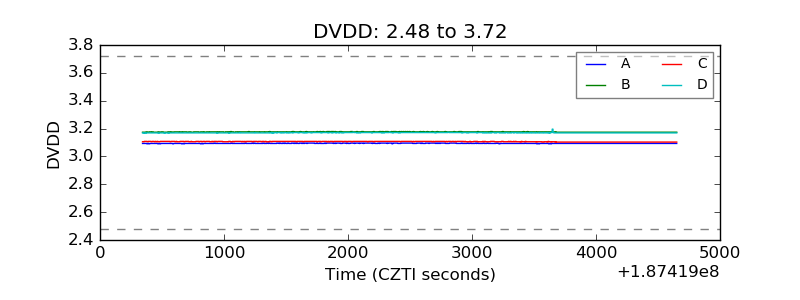 |
| Temperature 1 | 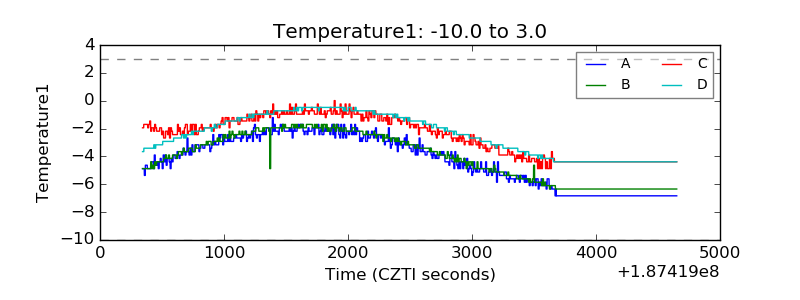 |
| Veto HV Monitor | 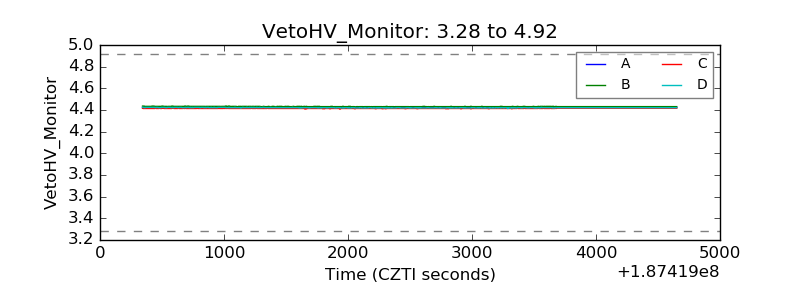 |
| Veto LLD | 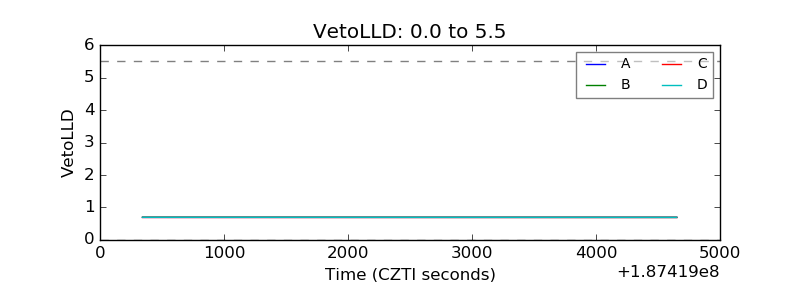 |
| Alpha Counter | 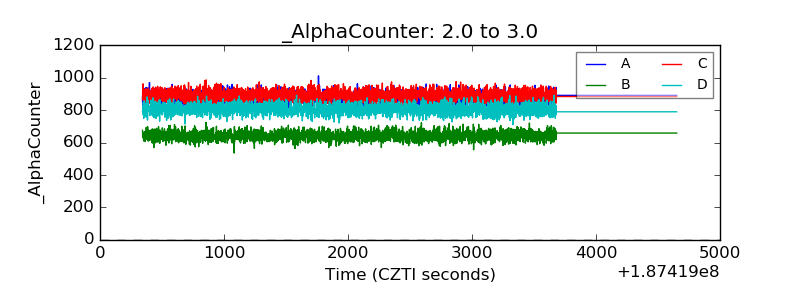 |
| _CPM_Rate | 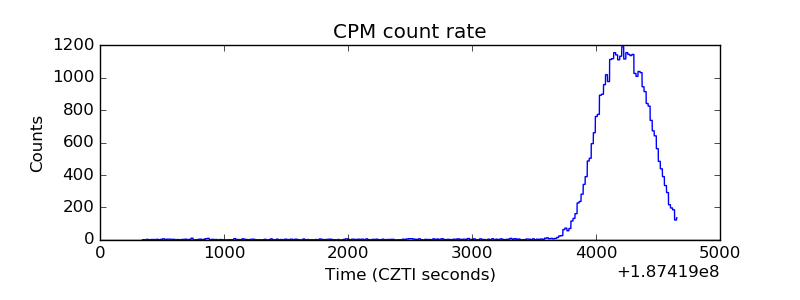 |
| CZT Counter | 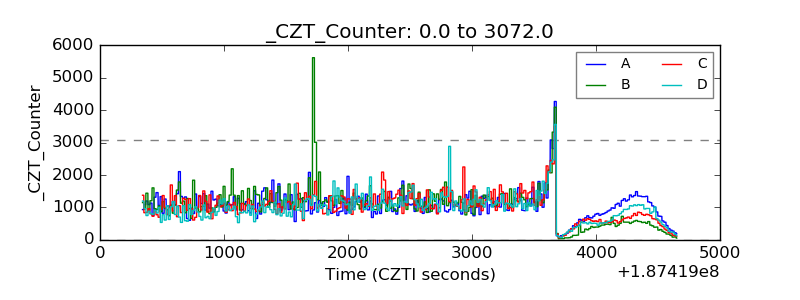 |
| +2.5 Volts monitor |  |
| +5 Volts monitor |  |
| _ROLL_ROT | 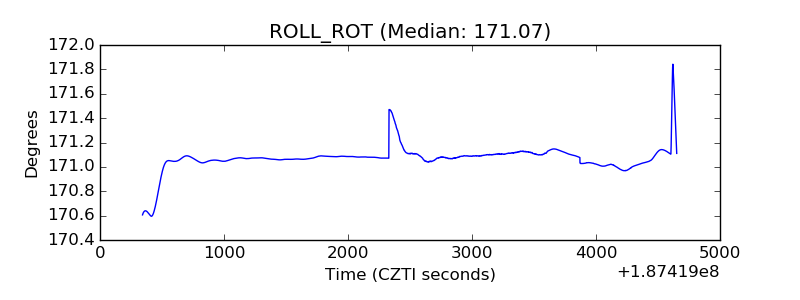 |
| _Roll_DEC | 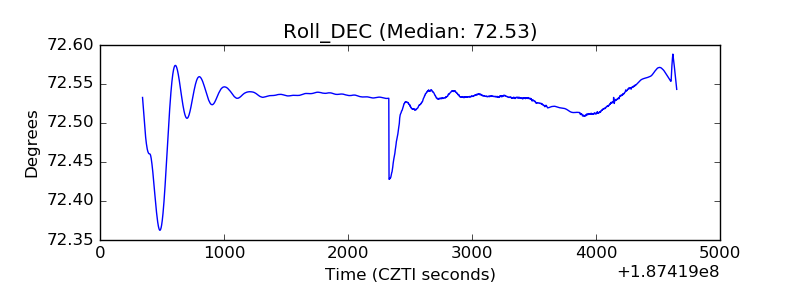 |
| _Roll_RA | 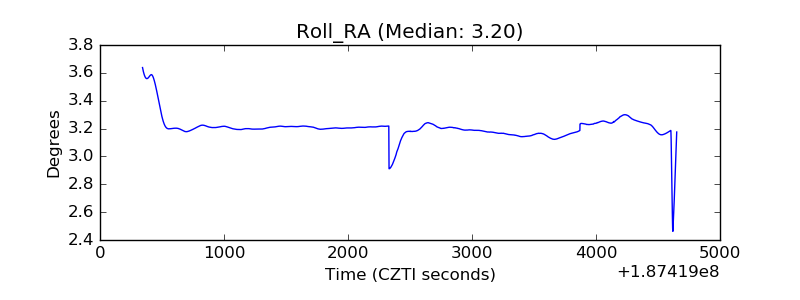 |
| Veto Counter | 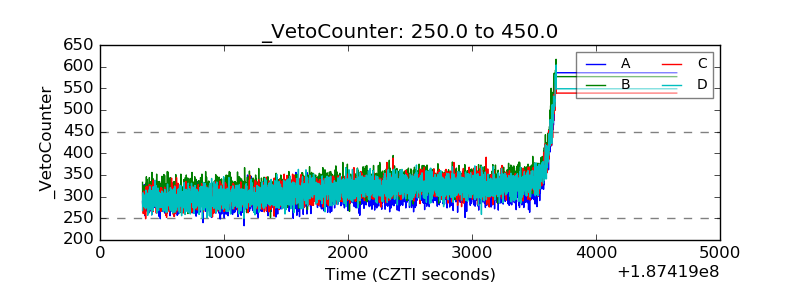 |