| Param | Original file | Final file |
|---|---|---|
| Filename | modeM0/AS1P01_180T10_9000000204_01084cztM0_level2.evt | modeM0/AS1P01_180T10_9000000204_01084cztM0_level2_quad_clean.evt |
| Size (bytes) | 568,952,640 | 57,507,840 |
| Size | 542.6 MB | 54.8 MB |
| Events in quadrant A | 4,265,130 | 382,184 |
| Events in quadrant B | 4,398,357 | 376,567 |
| Events in quadrant C | 4,295,089 | 361,039 |
| Events in quadrant D | 4,027,005 | 362,023 |
| Mode M9 | |||
|---|---|---|---|
| Quadrant | BADHDUFLAG | Total packets | Discarded packets |
| A | 0 | 7 | 0 |
| B | 0 | 7 | 0 |
| C | 0 | 7 | 0 |
| D | 0 | 7 | 0 |
| Mode SS | |||
|---|---|---|---|
| Quadrant | BADHDUFLAG | Total packets | Discarded packets |
| A | 0 | 76 | 0 |
| B | 0 | 76 | 0 |
| C | 0 | 76 | 0 |
| D | 0 | 76 | 0 |
| Mode M0 | |||
|---|---|---|---|
| Quadrant | BADHDUFLAG | Total packets | Discarded packets |
| A | 0 | 15276 | 1 |
| B | 0 | 15655 | 1 |
| C | 0 | 15371 | 1 |
| D | 0 | 14553 | 1 |
| Quadrant | Total seconds | Saturated seconds | Saturation percentage |
|---|---|---|---|
| A | 3665 | 34 | 0.927694% |
| B | 3665 | 32 | 0.873124% |
| C | 3665 | 29 | 0.791269% |
| D | 3665 | 40 | 1.091405% |
Noise dominated data is calculated using 1-second bins in cleaned event files. If a bin has >2000 counts, and if more than 50% of those come from <1% of pixels, then it is considered to be noise-dominated and hence unusable.
| Quadrant | # 1 sec bins | Bins with >0 counts | Bins with >2000 counts | High rate bins dominated by noise | Noise dominated (total time) | Noise dominated (detector-on time) | Marked lightcurve |
|---|---|---|---|---|---|---|---|
| A | 3679 | 3665 | 98 | 98 | 2.66% | 2.67% | 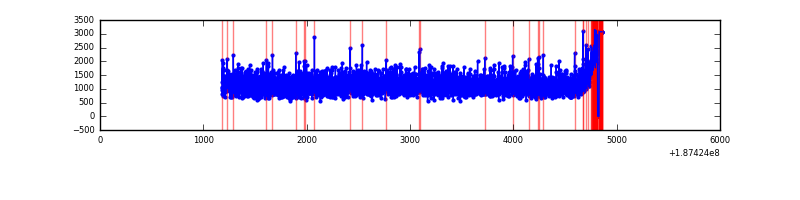 |
| B | 3679 | 3665 | 118 | 118 | 3.21% | 3.22% | 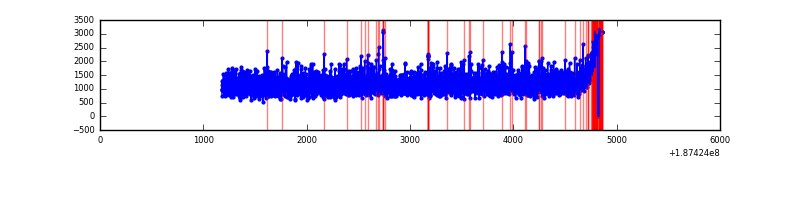 |
| C | 3679 | 3665 | 89 | 89 | 2.42% | 2.43% | 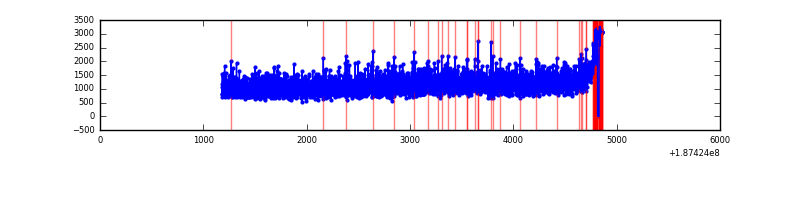 |
| D | 3679 | 3665 | 100 | 100 | 2.72% | 2.73% | 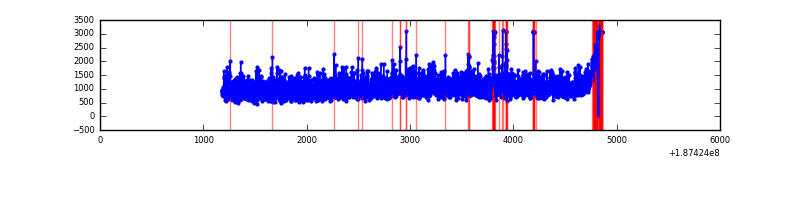 |
Top three noisy pixels from each quadrant. If the there are fewer than three noisy pixels in the level2.evt file, extra rows are filled as -1
| Pixel properties | Quadrant properties | ||||||
|---|---|---|---|---|---|---|---|
| Quadrant | DetID | PixID | Counts | Sigma | Mean | Median | Sigma |
| A | 12 | 243 | 5276 | 15.75 | 1109 | 1114 | 264.3 |
| A | 11 | 79 | 4578 | 13.11 | 1109 | 1114 | 264.3 |
| A | 13 | 9 | 4056 | 11.13 | 1109 | 1114 | 264.3 |
| B | 5 | 249 | 27842 | 100.21 | 1134 | 1139 | 266.5 |
| B | 8 | 219 | 21693 | 77.13 | 1134 | 1139 | 266.5 |
| B | 4 | 187 | 16108 | 56.18 | 1134 | 1139 | 266.5 |
| C | 15 | 241 | 172789 | 595.18 | 1043 | 1082 | 288.5 |
| C | 3 | 79 | 20828 | 68.44 | 1043 | 1082 | 288.5 |
| C | 3 | 111 | 16603 | 53.8 | 1043 | 1082 | 288.5 |
| D | 2 | 216 | 88600 | 275.08 | 1033 | 1070 | 318.2 |
| D | 10 | 125 | 58546 | 180.63 | 1033 | 1070 | 318.2 |
| D | 13 | 13 | 7088 | 18.91 | 1033 | 1070 | 318.2 |
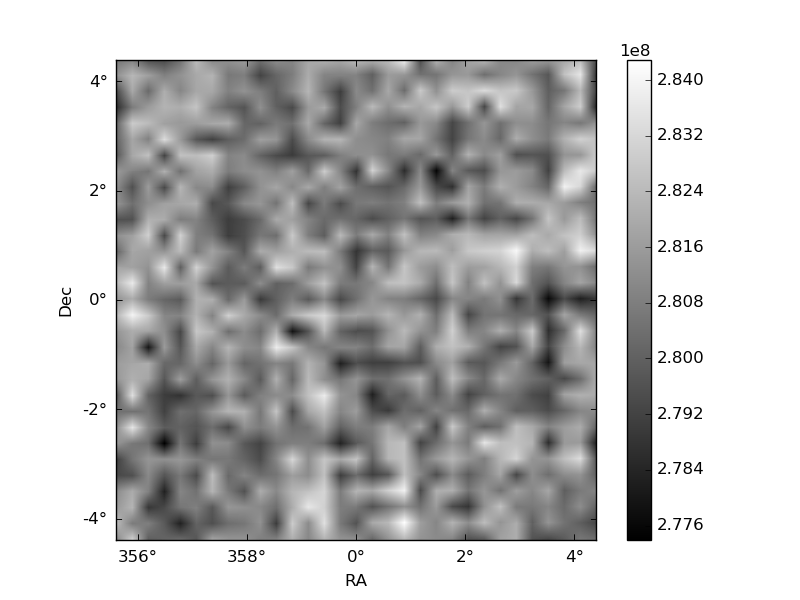
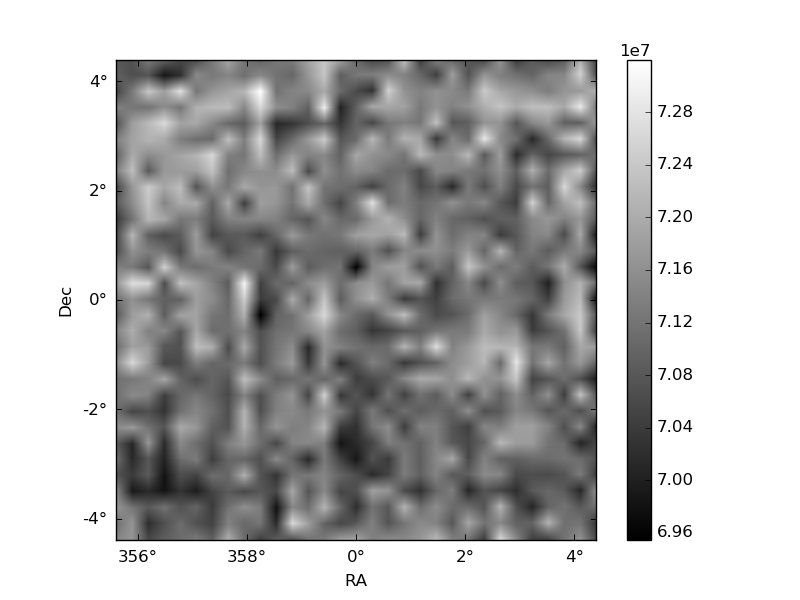
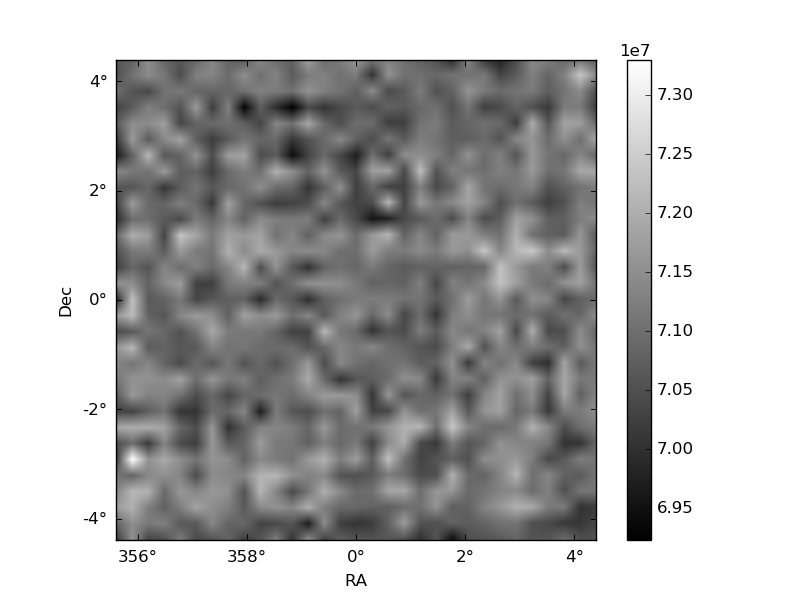
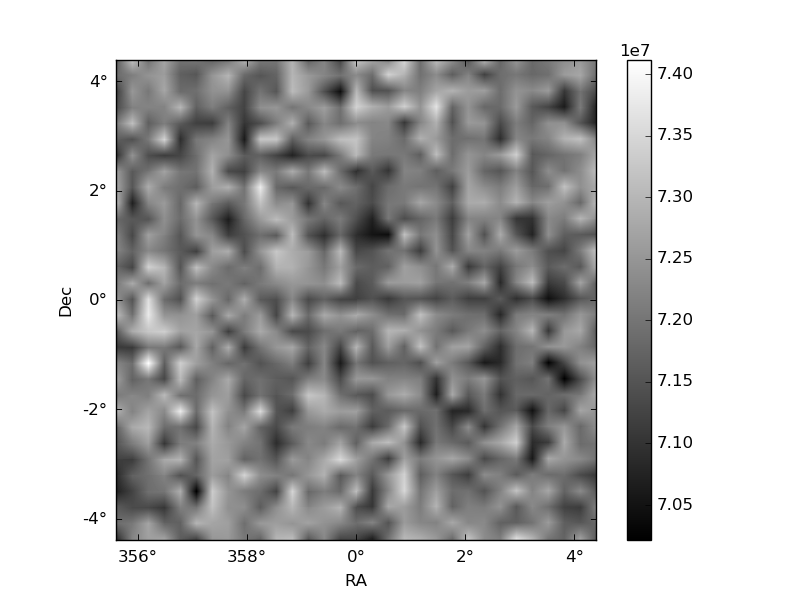
Histogram calculated using DETX and DETY for each event in the final _common_clean file
| Quadrant A | 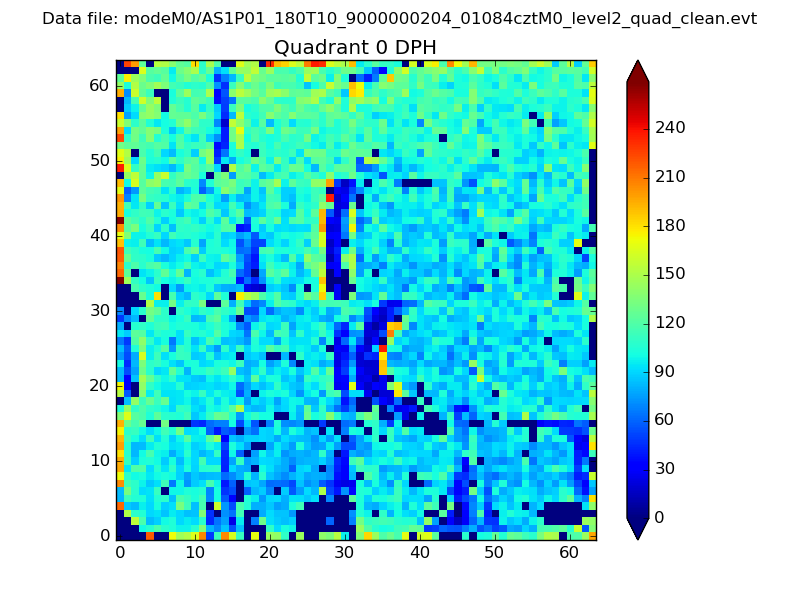 |
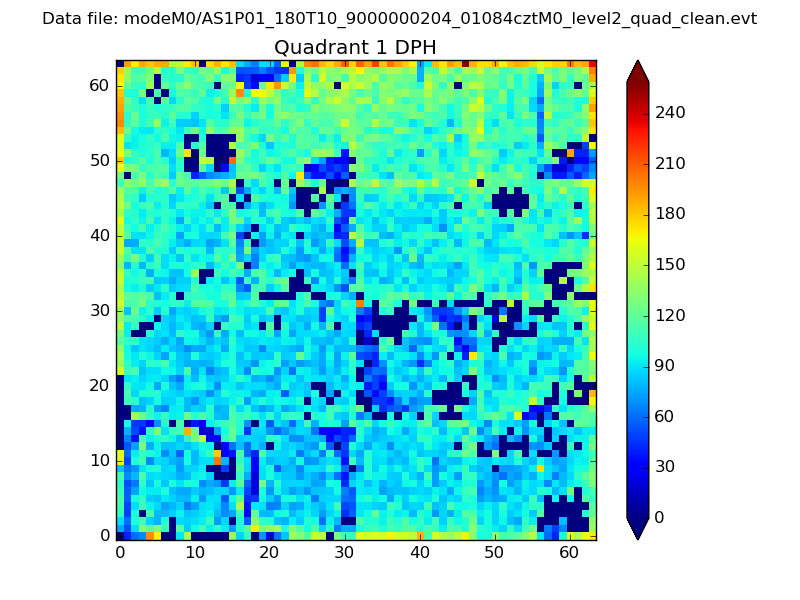 |
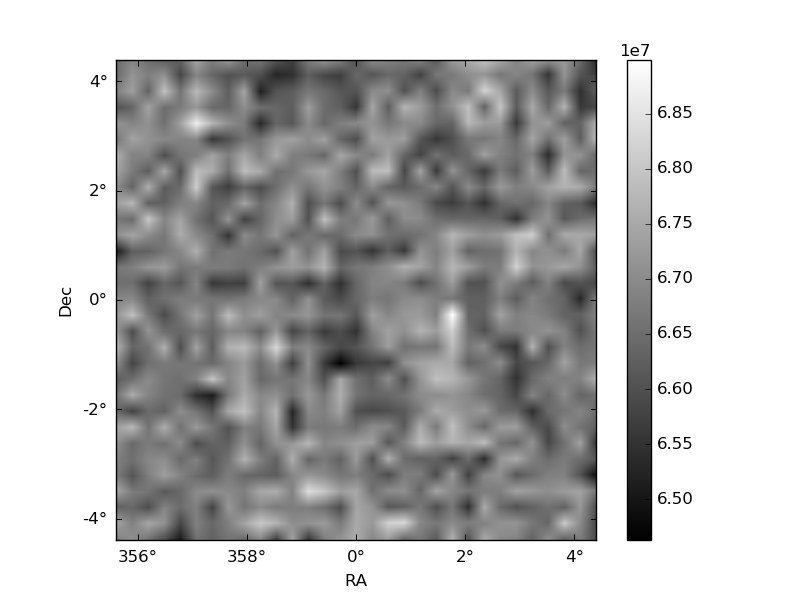
Quadrant B |
|---|---|---|---|
| Quadrant D | 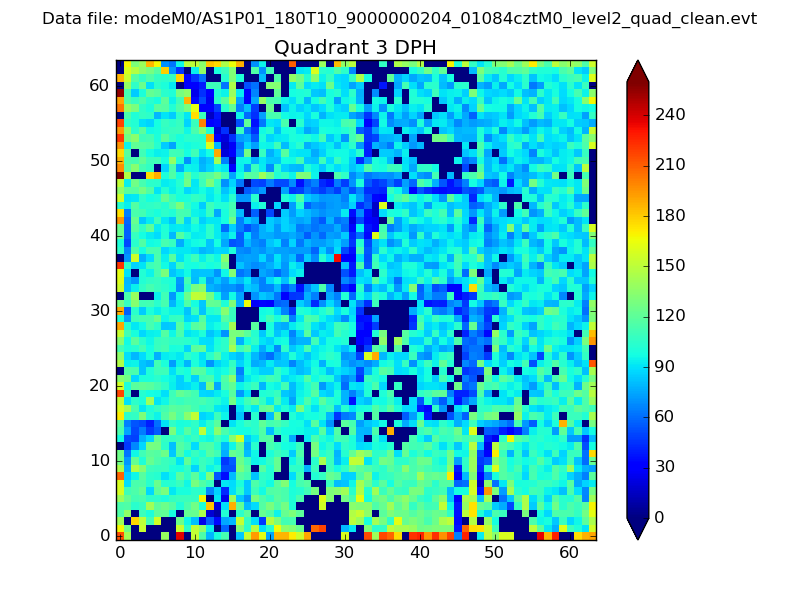 |
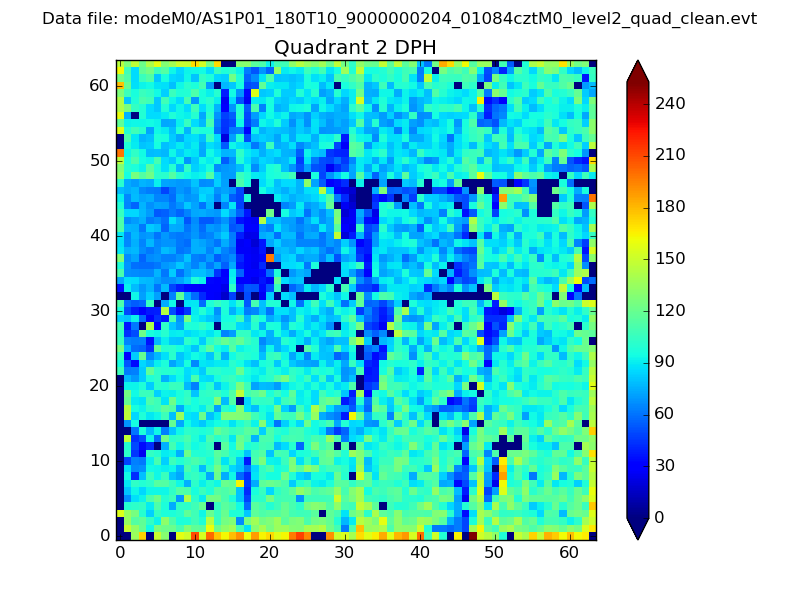 |
Quadrant C |
| Plot type | Count rate plots | Images |
|---|---|---|
| Comparison with Poisson distribution Blue bars denote a histogram of data divided into 1 sec bins. Red curve is a Poisson curve with rate = median count rate of data. |
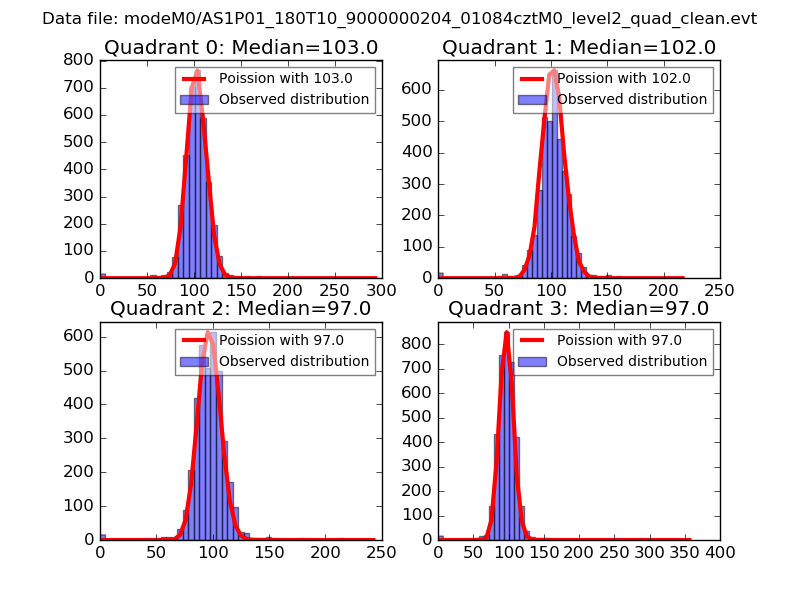 |
 |
| Quadrant-wise count rates Data is divided into 100 sec bins |
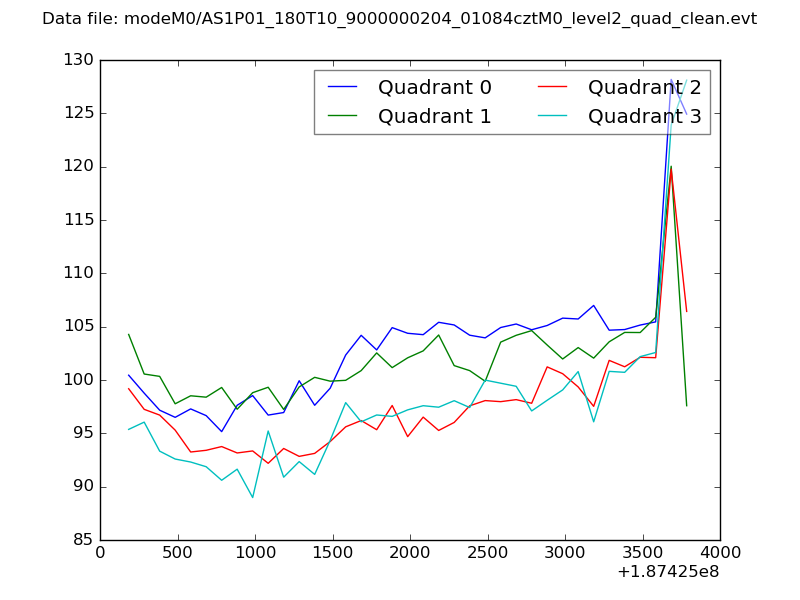 |
|
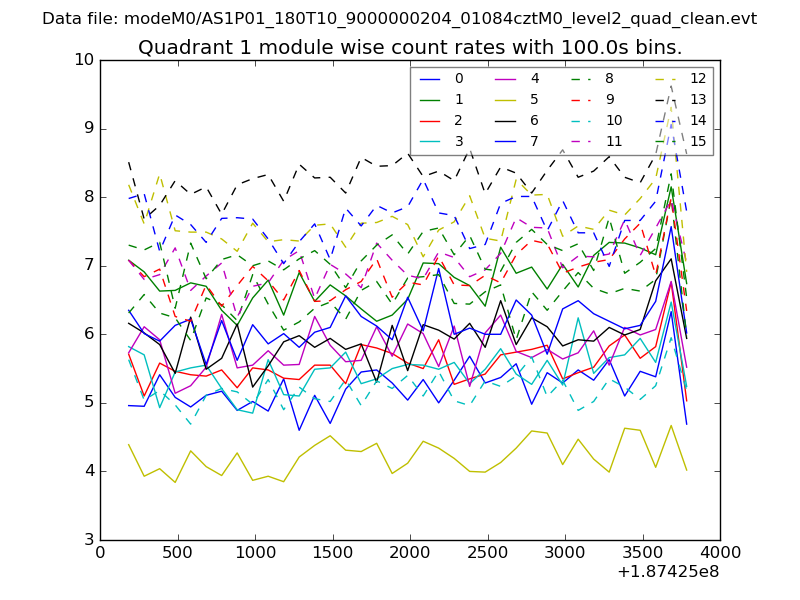
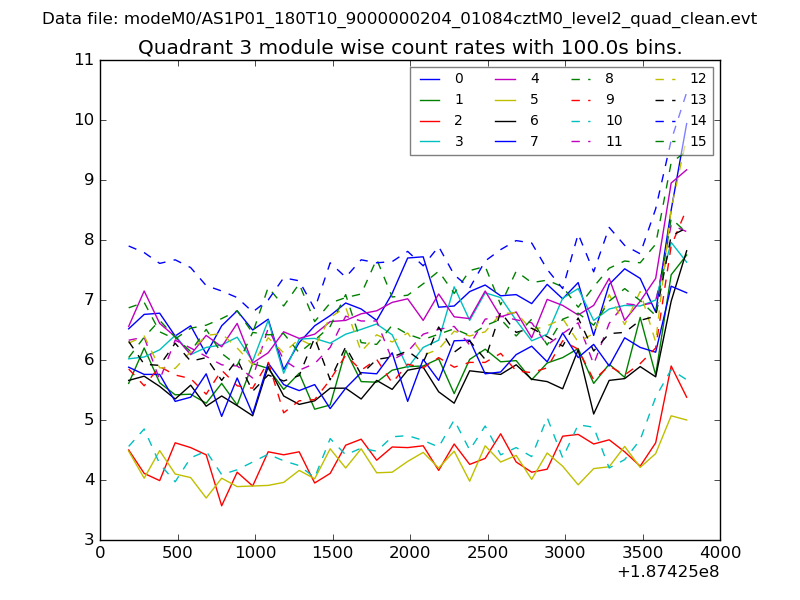
| Module-wise count rates for Quadrant A Data is divided into 100 sec bins |
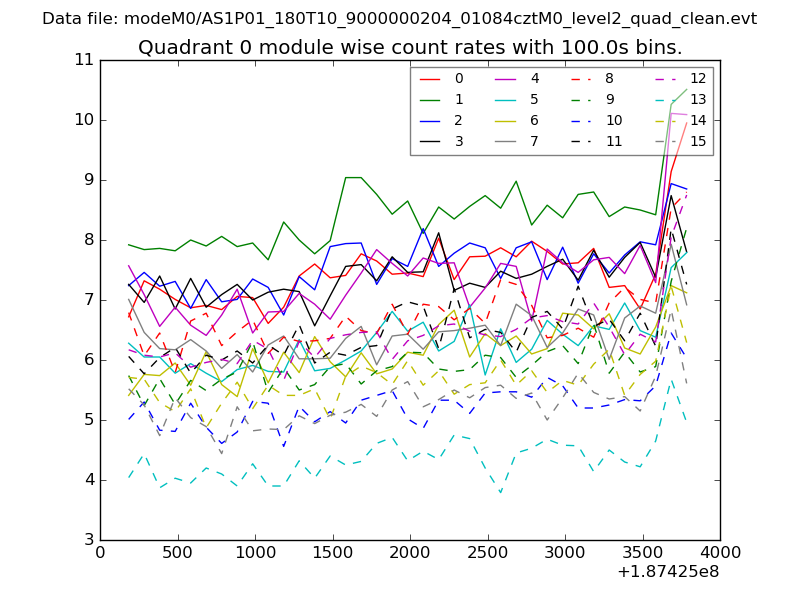 |
 |
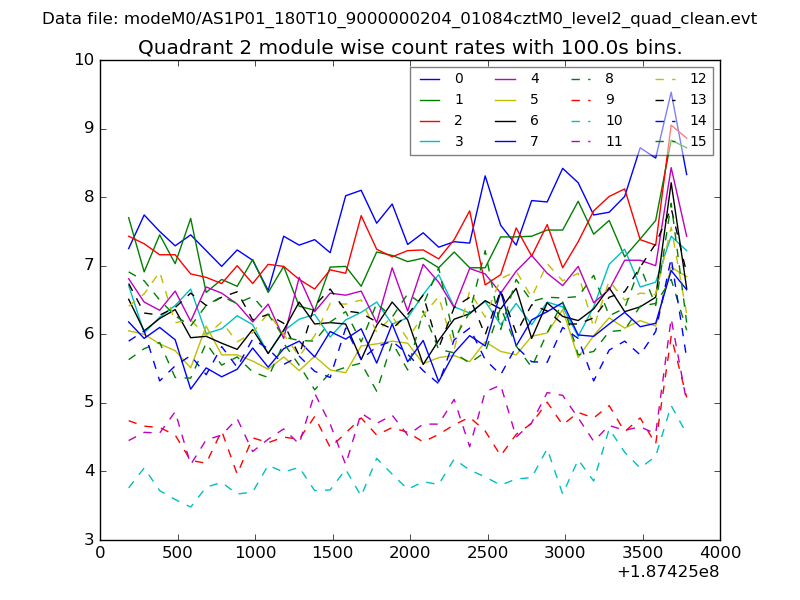
| Module-wise count rates for Quadrant B Data is divided into 100 sec bins |
 |
 |
| Module-wise count rates for Quadrant C Data is divided into 100 sec bins |
 |
 |
| Module-wise count rates for Quadrant D Data is divided into 100 sec bins |
 |
 |
| Parameter | Plot |
|---|---|
| CZT HV Monitor | 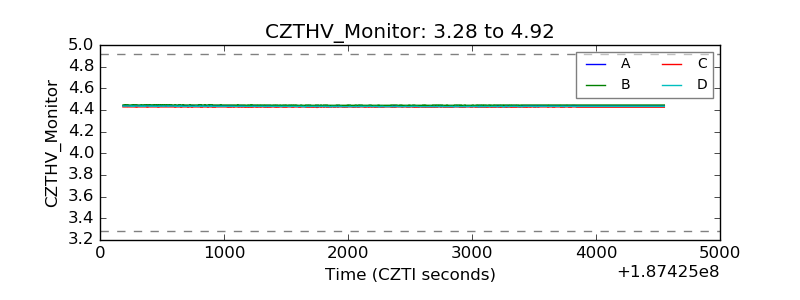 |
| D_VDD | 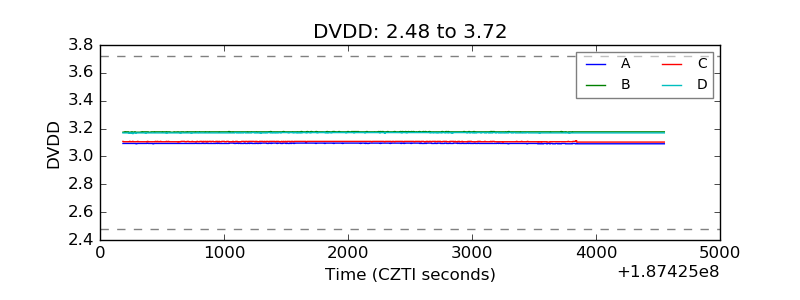 |
| Temperature 1 | 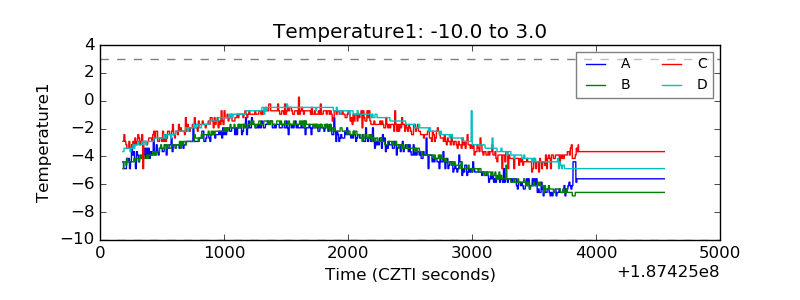 |
| Veto HV Monitor | 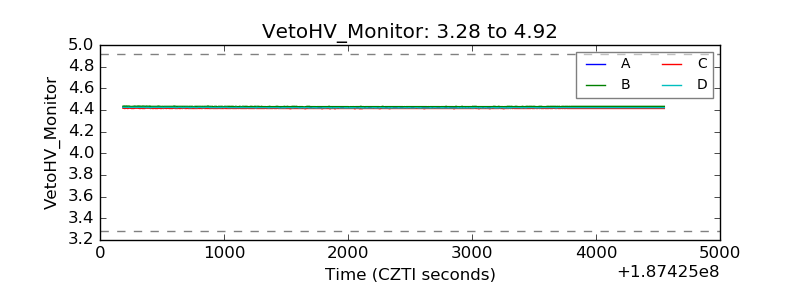 |
| Veto LLD | 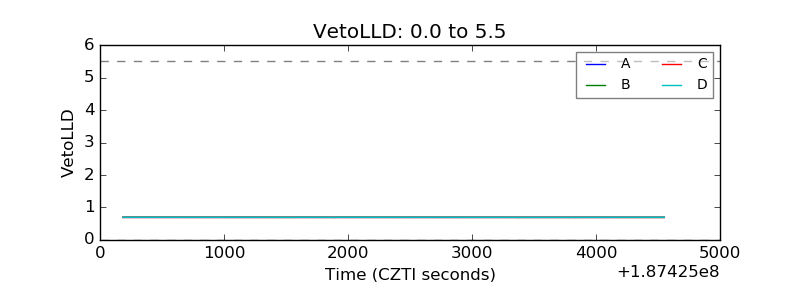 |
| Alpha Counter | 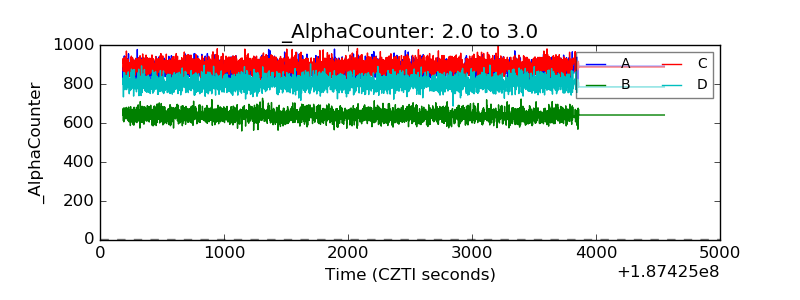 |
| _CPM_Rate | 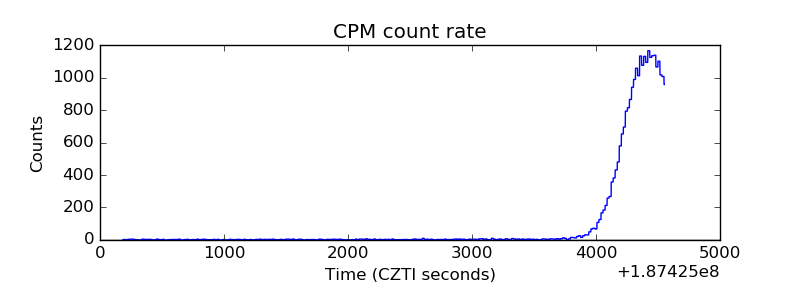 |
| CZT Counter | 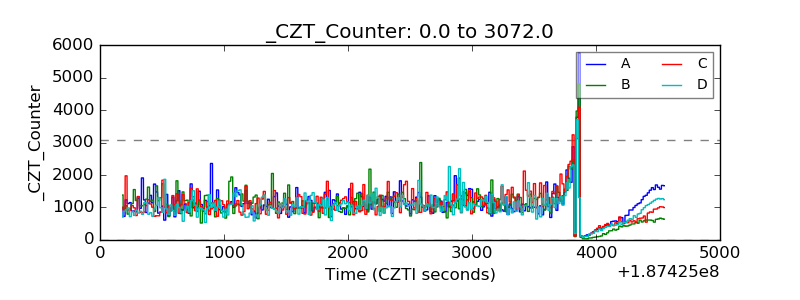 |
| +2.5 Volts monitor | 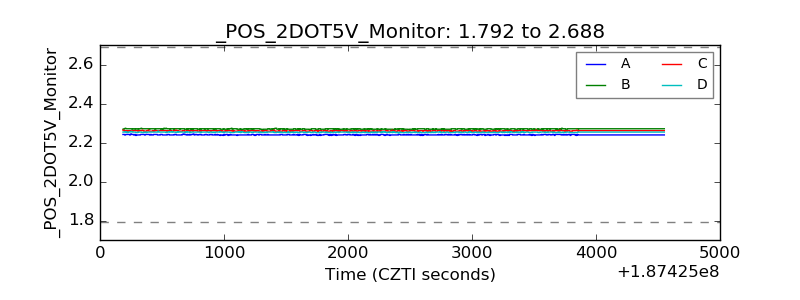 |
| +5 Volts monitor | 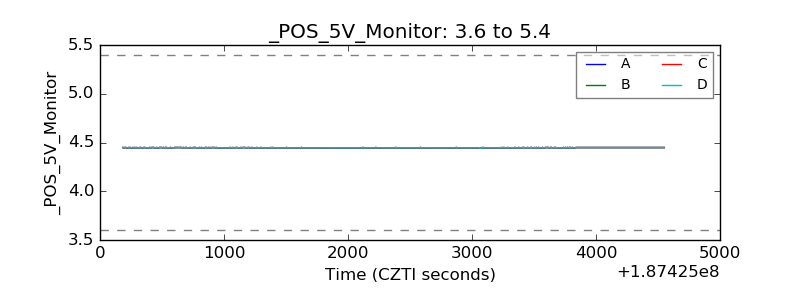 |
| _ROLL_ROT | 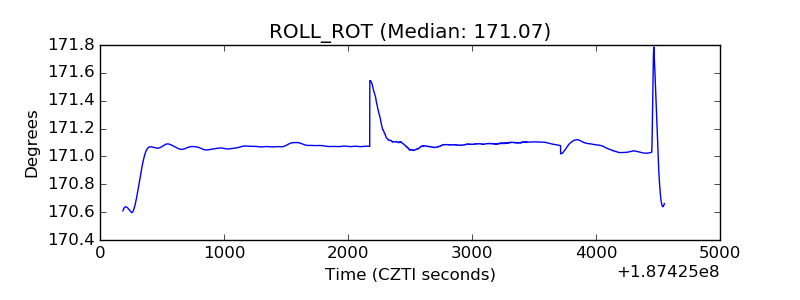 |
| _Roll_DEC | 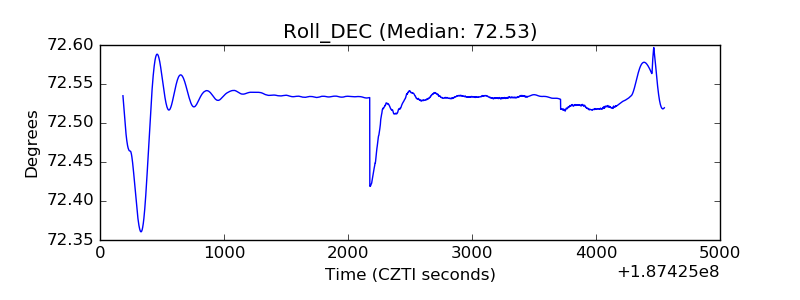 |
| _Roll_RA | 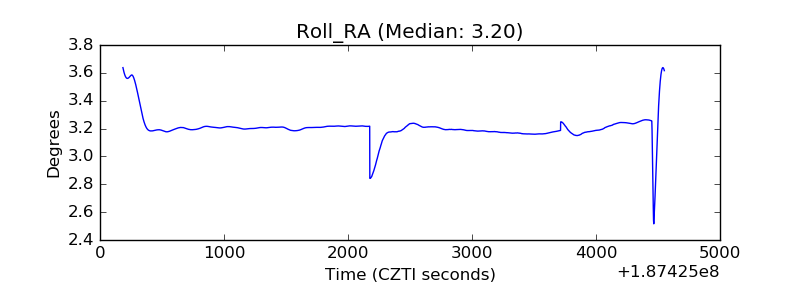 |
| Veto Counter | 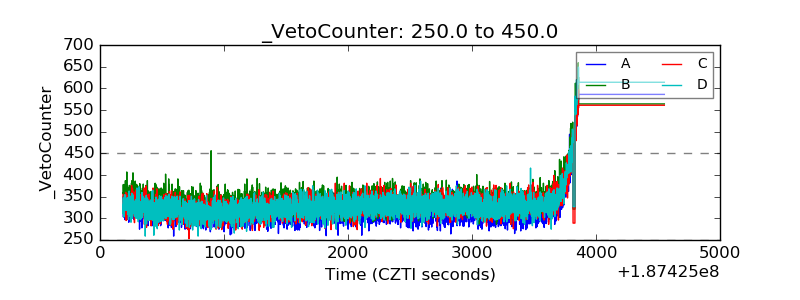 |