| Param | Original file | Final file |
|---|---|---|
| Filename | modeM0/AS1P01_180T10_9000000208_01084cztM0_level2.evt | modeM0/AS1P01_180T10_9000000208_01084cztM0_level2_quad_clean.evt |
| Size (bytes) | 58,440,960 | 6,419,520 |
| Size | 55.7 MB | 6.1 MB |
| Events in quadrant A | 460,205 | 39,857 |
| Events in quadrant B | 479,249 | 41,163 |
| Events in quadrant C | 414,744 | 39,195 |
| Events in quadrant D | 386,303 | 38,488 |
| Mode SS | |||
|---|---|---|---|
| Quadrant | BADHDUFLAG | Total packets | Discarded packets |
| A | 0 | 8 | 0 |
| B | 0 | 8 | 0 |
| C | 0 | 8 | 0 |
| D | 0 | 8 | 0 |
| Mode M0 | |||
|---|---|---|---|
| Quadrant | BADHDUFLAG | Total packets | Discarded packets |
| A | 0 | 1641 | 1 |
| B | 0 | 1693 | 0 |
| C | 0 | 1499 | 0 |
| D | 0 | 1422 | 0 |
| Quadrant | Total seconds | Saturated seconds | Saturation percentage |
|---|---|---|---|
| A | 384 | 0 | 0.000000% |
| B | 384 | 0 | 0.000000% |
| C | 384 | 0 | 0.000000% |
| D | 384 | 0 | 0.000000% |
Noise dominated data is calculated using 1-second bins in cleaned event files. If a bin has >2000 counts, and if more than 50% of those come from <1% of pixels, then it is considered to be noise-dominated and hence unusable.
| Quadrant | # 1 sec bins | Bins with >0 counts | Bins with >2000 counts | High rate bins dominated by noise | Noise dominated (total time) | Noise dominated (detector-on time) | Marked lightcurve |
|---|---|---|---|---|---|---|---|
| A | 384 | 384 | 5 | 5 | 1.30% | 1.30% | 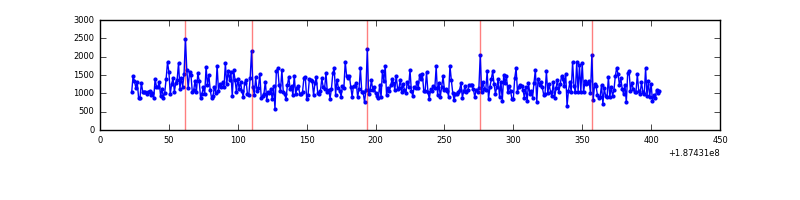 |
| B | 384 | 384 | 4 | 4 | 1.04% | 1.04% | 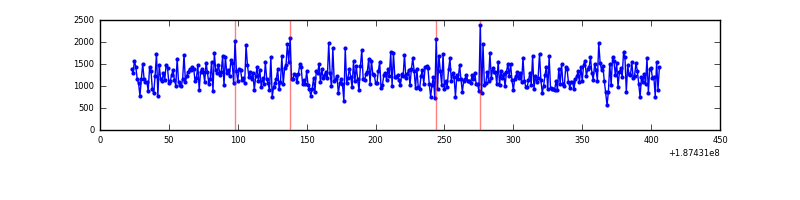 |
| C | 384 | 384 | 1 | 1 | 0.26% | 0.26% | 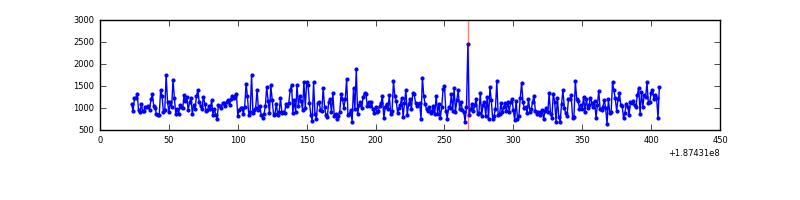 |
| D | 384 | 384 | 0 | 0 | 0.00% | 0.00% | 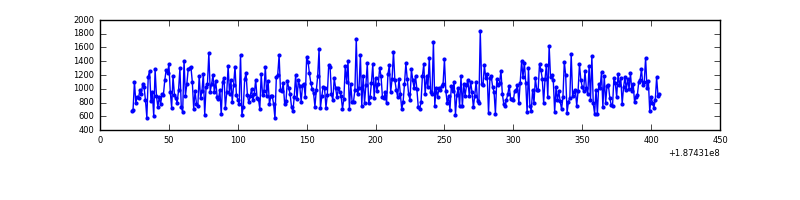 |
Top three noisy pixels from each quadrant. If the there are fewer than three noisy pixels in the level2.evt file, extra rows are filled as -1
| Pixel properties | Quadrant properties | ||||||
|---|---|---|---|---|---|---|---|
| Quadrant | DetID | PixID | Counts | Sigma | Mean | Median | Sigma |
| A | 12 | 243 | 743 | 20.36 | 119 | 120 | 30.6 |
| A | 3 | 111 | 401 | 9.18 | 119 | 120 | 30.6 |
| A | 15 | 233 | 359 | 7.81 | 119 | 120 | 30.6 |
| B | 15 | 22 | 11880 | 381.65 | 122 | 122 | 30.8 |
| B | 0 | 190 | 2129 | 65.14 | 122 | 122 | 30.8 |
| B | 5 | 191 | 1369 | 40.48 | 122 | 122 | 30.8 |
| C | 15 | 241 | 18184 | 616.32 | 101 | 104 | 29.3 |
| C | 3 | 111 | 1125 | 34.8 | 101 | 104 | 29.3 |
| C | 3 | 79 | 730 | 21.34 | 101 | 104 | 29.3 |
| D | 9 | 49 | 455 | 10.09 | 102 | 103 | 34.9 |
| D | 13 | 169 | 436 | 9.55 | 102 | 103 | 34.9 |
| D | 10 | 166 | 325 | 6.37 | 102 | 103 | 34.9 |
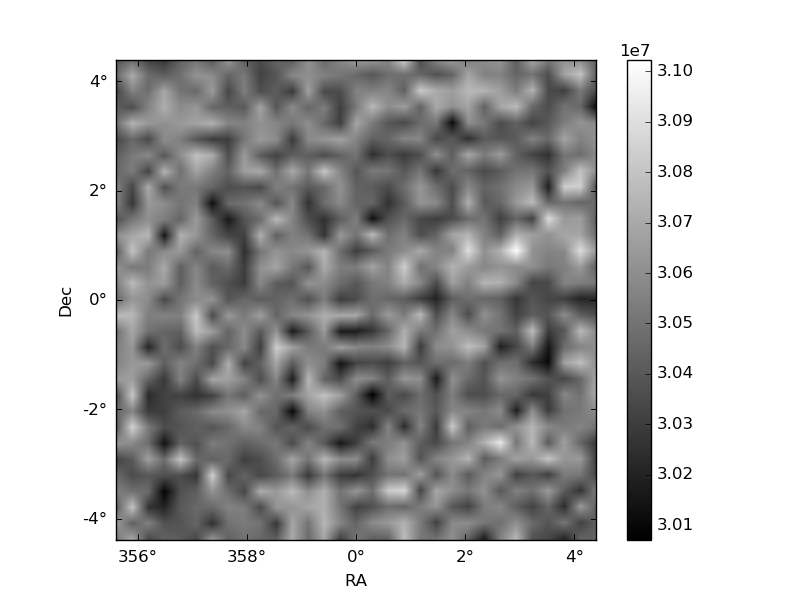
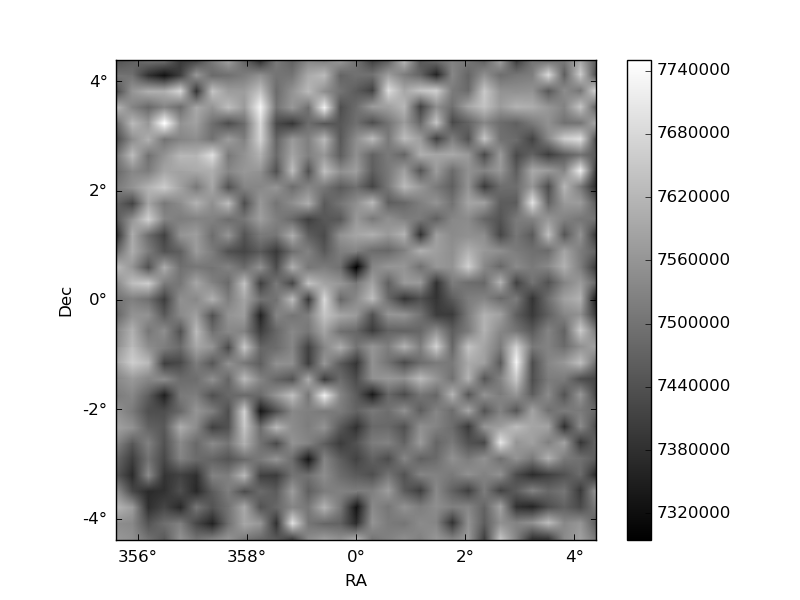
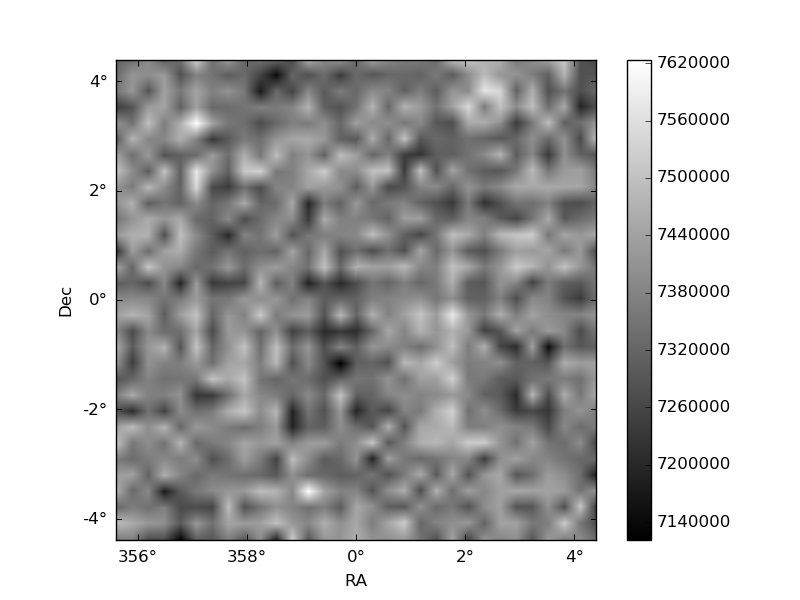
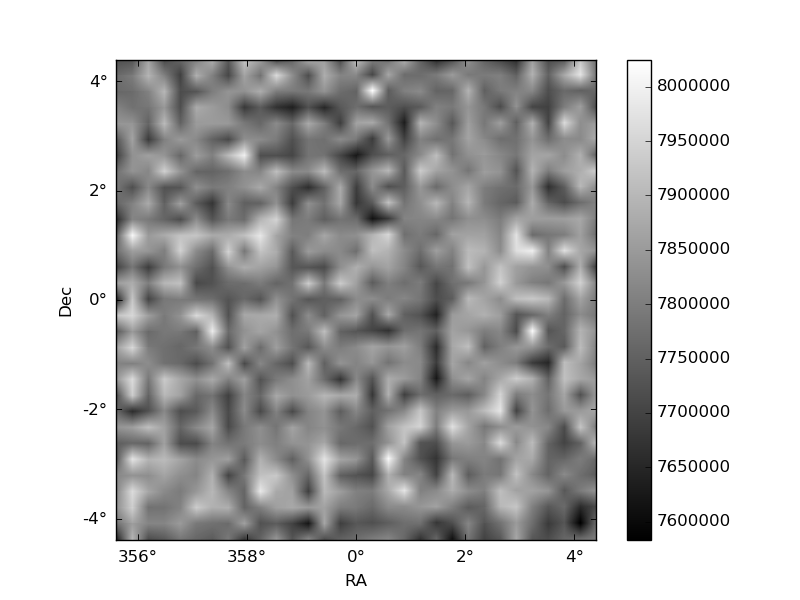
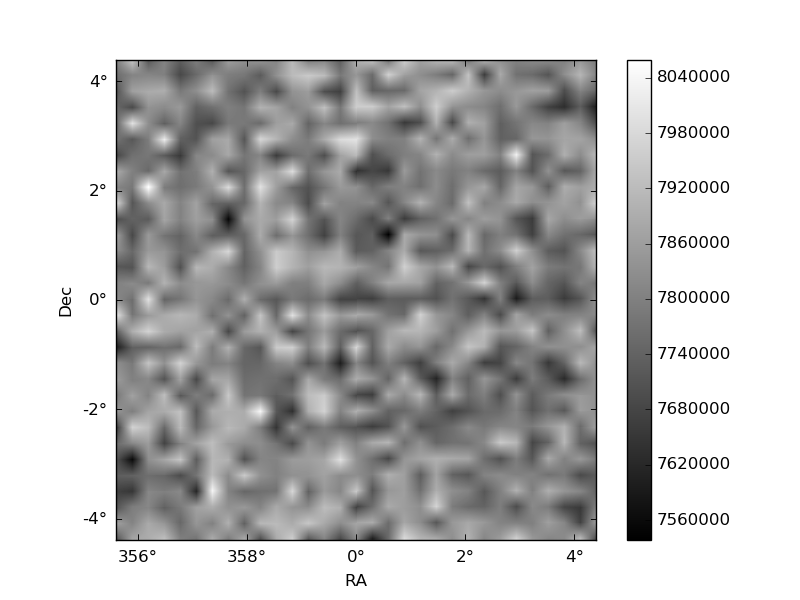
Histogram calculated using DETX and DETY for each event in the final _common_clean file
| Quadrant A | 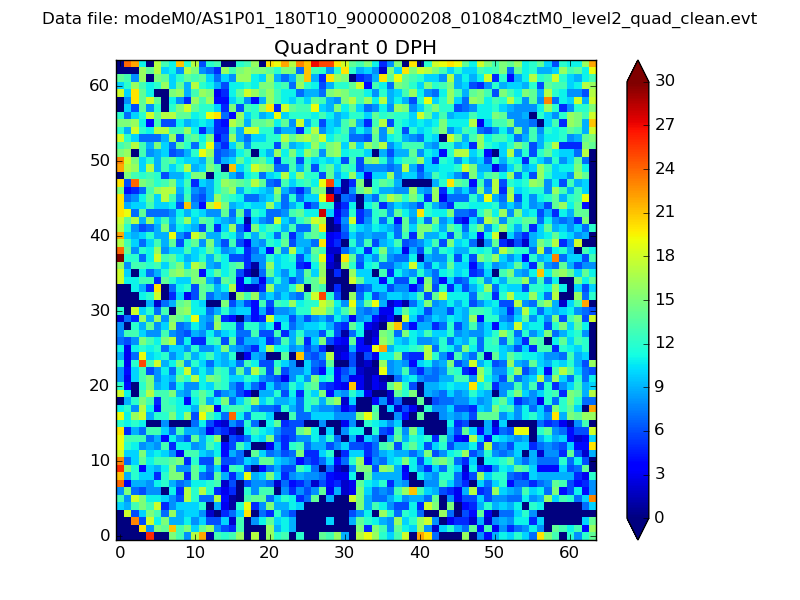 |
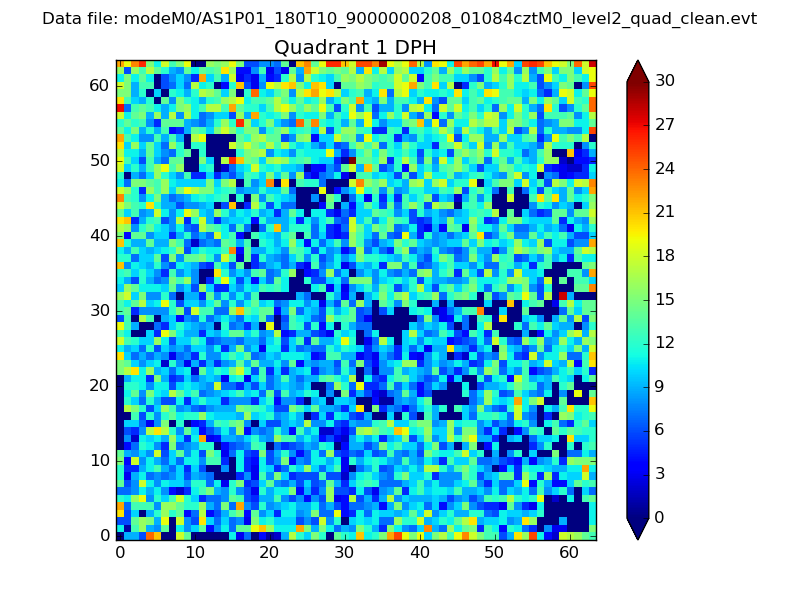 |
Quadrant B |
|---|---|---|---|
| Quadrant D | 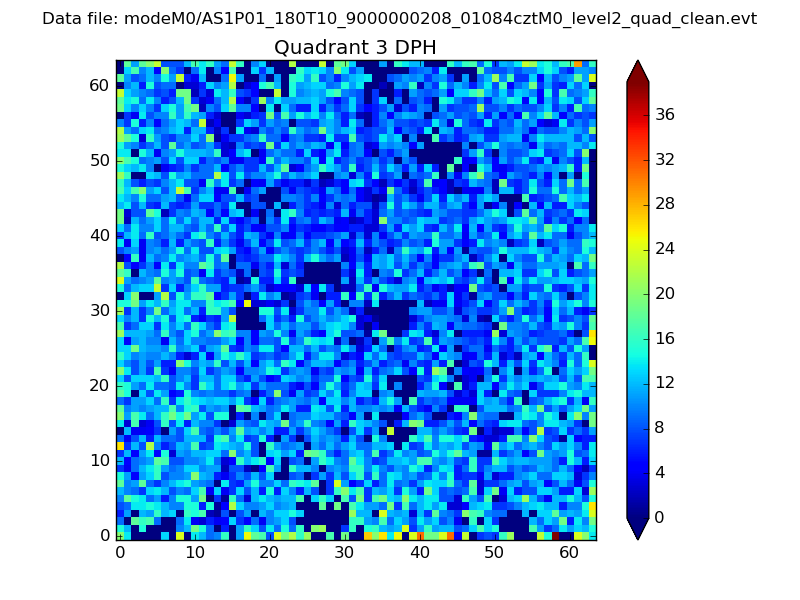 |
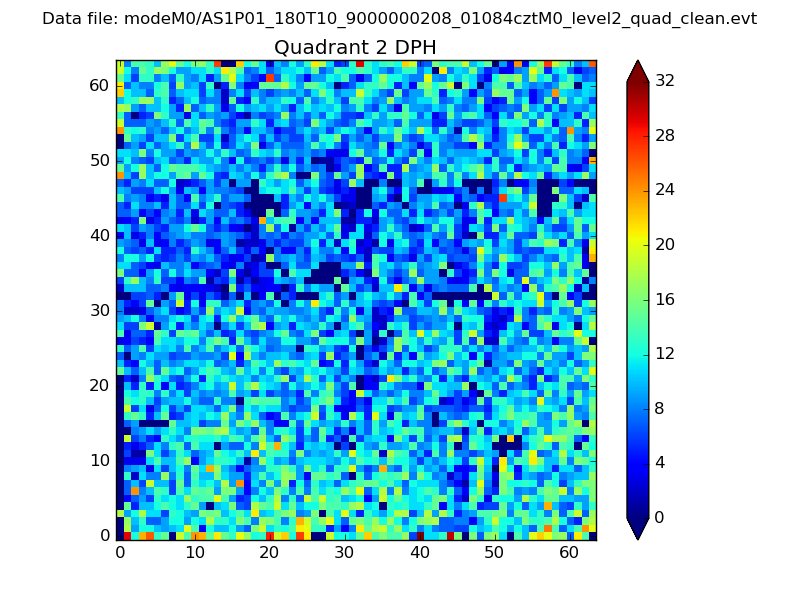 |
Quadrant C |
| Plot type | Count rate plots | Images |
|---|---|---|
| Comparison with Poisson distribution Blue bars denote a histogram of data divided into 1 sec bins. Red curve is a Poisson curve with rate = median count rate of data. |
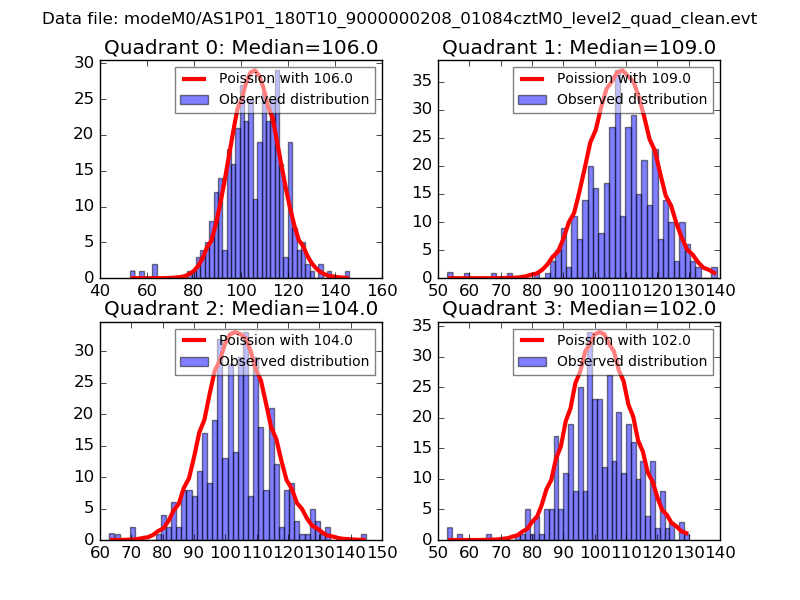 |
 |
| Quadrant-wise count rates Data is divided into 100 sec bins |
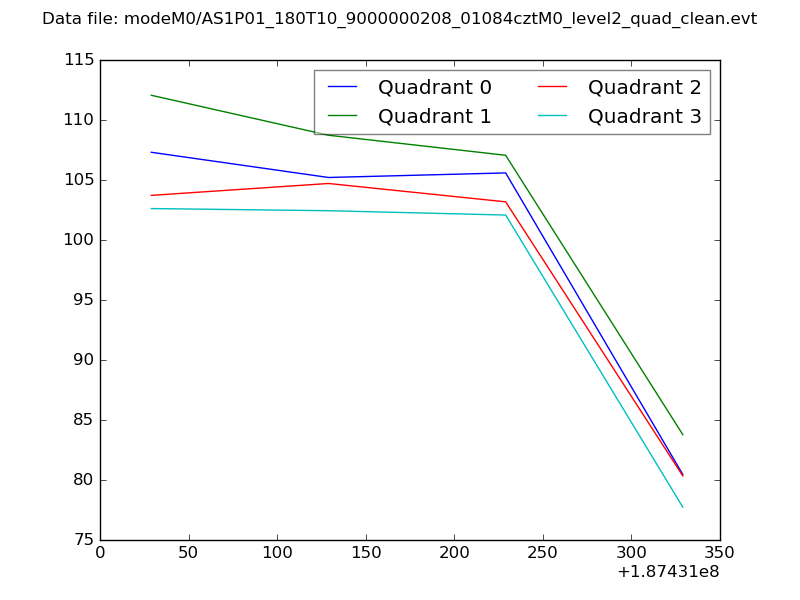 |
|
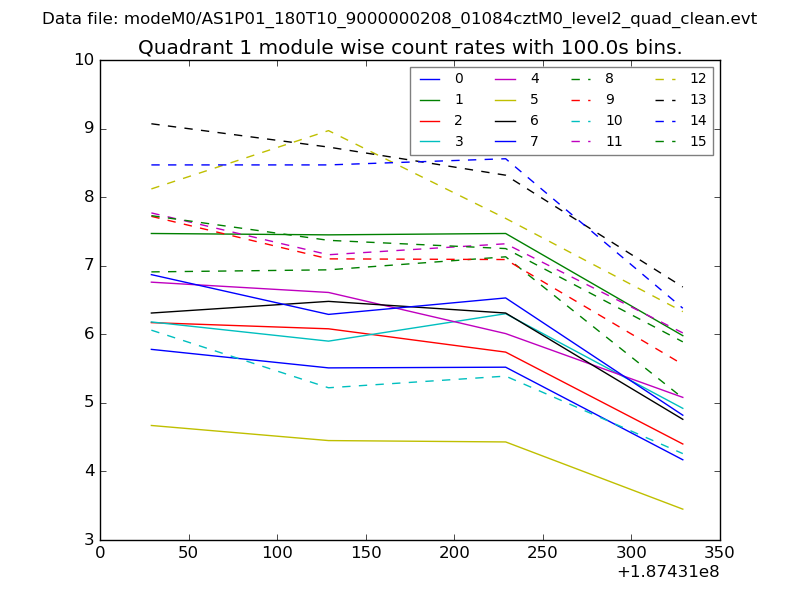
| Module-wise count rates for Quadrant A Data is divided into 100 sec bins |
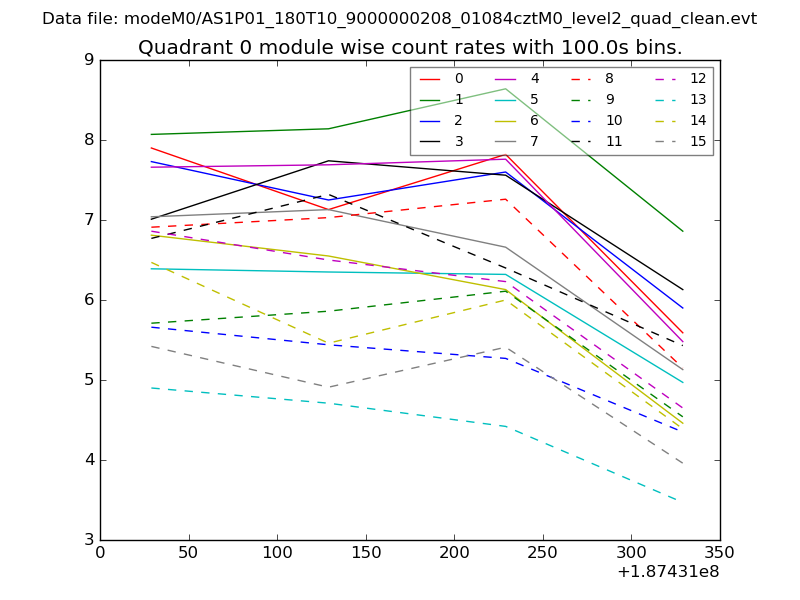 |
 |
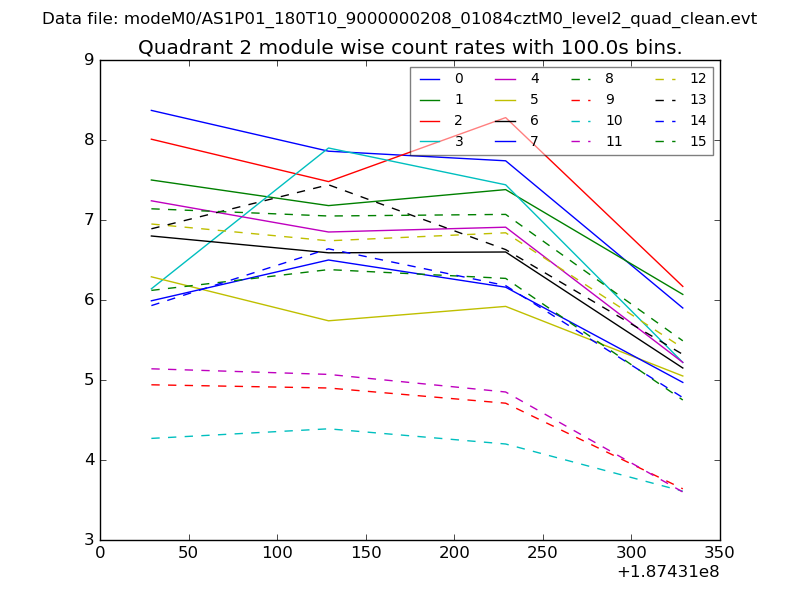
| Module-wise count rates for Quadrant B Data is divided into 100 sec bins |
 |
 |
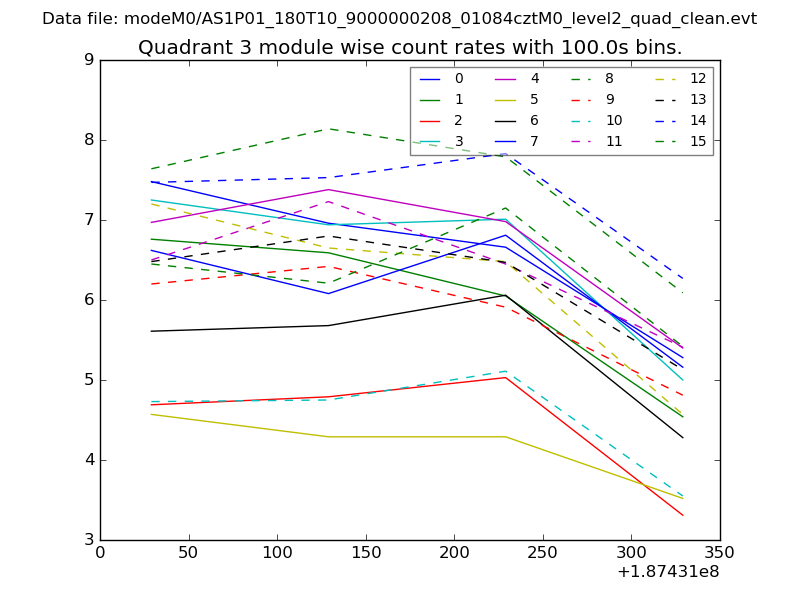
| Module-wise count rates for Quadrant C Data is divided into 100 sec bins |
 |
 |
| Module-wise count rates for Quadrant D Data is divided into 100 sec bins |
 |
 |
| Parameter | Plot |
|---|---|
| CZT HV Monitor | 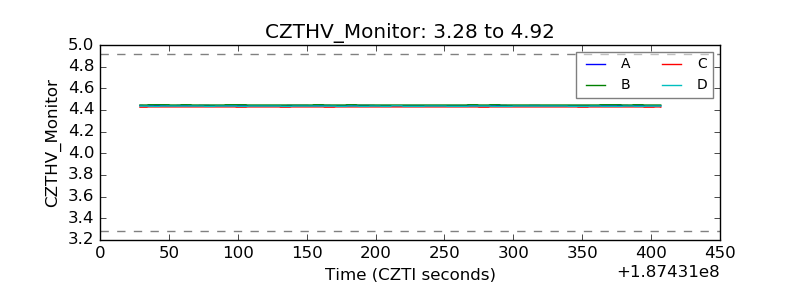 |
| D_VDD | 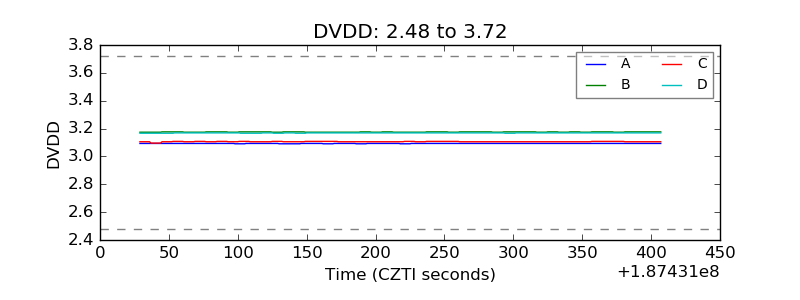 |
| Temperature 1 | 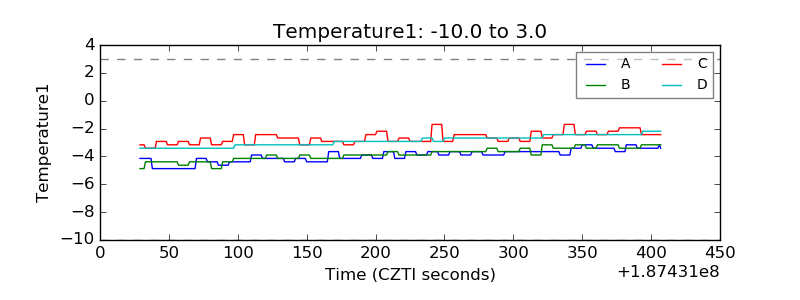 |
| Veto HV Monitor | 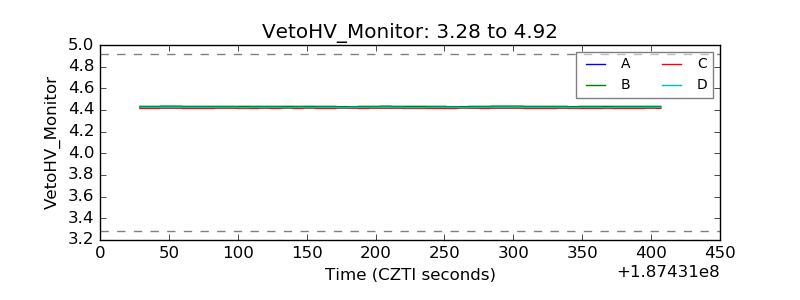 |
| Veto LLD | 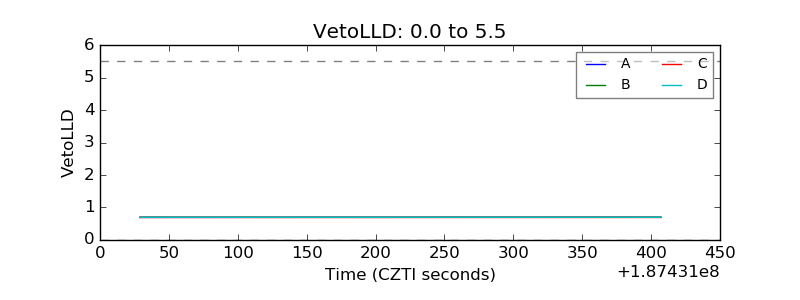 |
| Alpha Counter | 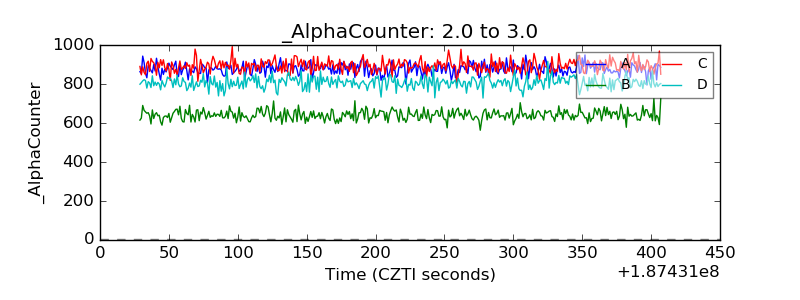 |
| _CPM_Rate | 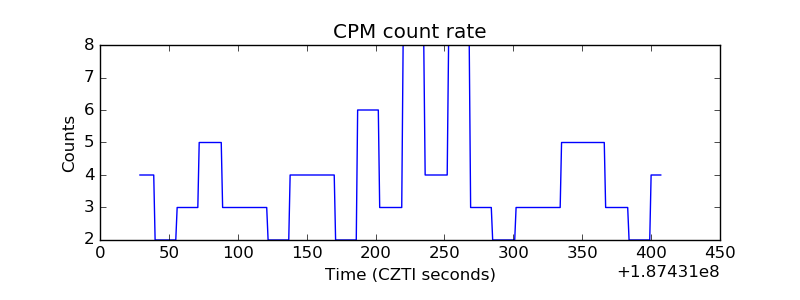 |
| CZT Counter | 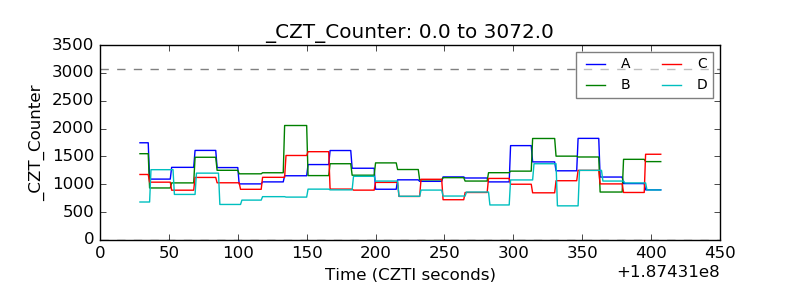 |
| +2.5 Volts monitor |  |
| +5 Volts monitor | 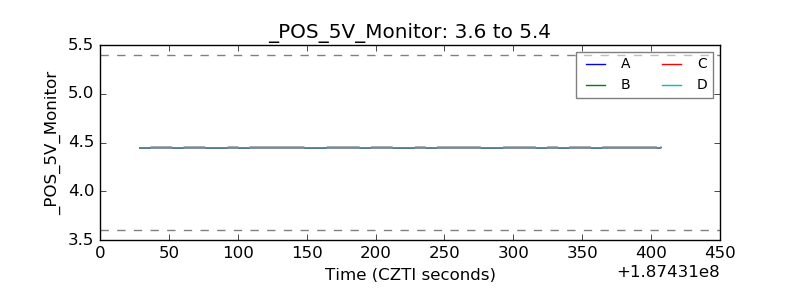 |
| _ROLL_ROT | 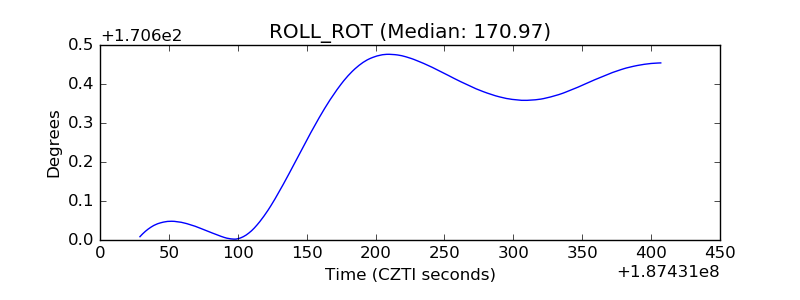 |
| _Roll_DEC | 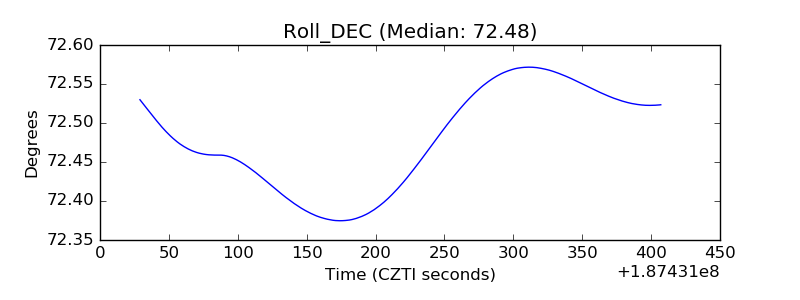 |
| _Roll_RA | 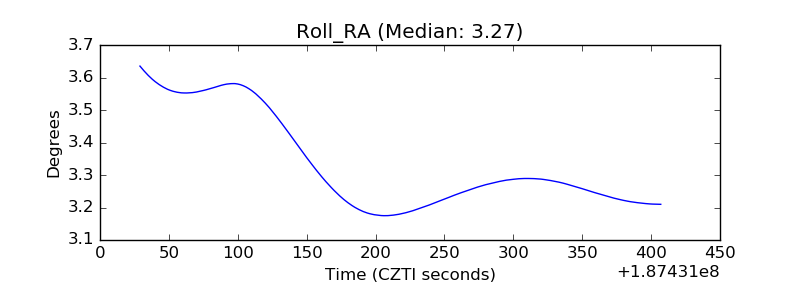 |
| Veto Counter | 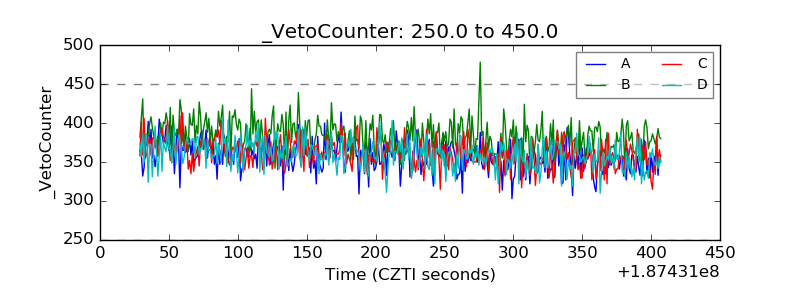 |