| Param | Original file | Final file |
|---|---|---|
| Filename | modeM0/AS1P01_997T02_9000000212cztM0_level2.fits | modeM0/AS1P01_997T02_9000000212cztM0_level2_quad_clean.evt |
| Size (bytes) | 991,889,280 | 1,595,093,760 |
| Size | 945.9 MB | 1.5 GB |
| Events in quadrant A | 5,714,060 | 10,465,494 |
| Events in quadrant B | 5,632,896 | 10,520,259 |
| Events in quadrant C | 5,530,854 | 9,858,037 |
| Events in quadrant D | 4,775,360 | 9,088,679 |
| Mode M9 | |||
|---|---|---|---|
| Quadrant | BADHDUFLAG | Total packets | Discarded packets |
| A | 0 | 159 | 0 |
| B | 0 | 159 | 0 |
| C | 0 | 159 | 0 |
| D | 0 | 159 | 0 |
| Mode M0 | |||
|---|---|---|---|
| Quadrant | BADHDUFLAG | Total packets | Discarded packets |
| A | 0 | 519390 | 0 |
| B | 0 | 534262 | 0 |
| C | 0 | 522606 | 0 |
| D | 0 | 508802 | 0 |
| Mode SS | |||
|---|---|---|---|
| Quadrant | BADHDUFLAG | Total packets | Discarded packets |
| A | 0 | 2494 | 0 |
| B | 0 | 2494 | 0 |
| C | 0 | 2494 | 0 |
| D | 0 | 2494 | 0 |
| Quadrant | Total seconds | Saturated seconds | Saturation percentage |
|---|---|---|---|
| A | 122348 | 957 | 0.782195% |
| B | 122350 | 445 | 0.363711% |
| C | 122350 | 482 | 0.393952% |
| D | 122348 | 2437 | 1.991859% |
Noise dominated data is calculated using 1-second bins in cleaned event files. If a bin has >2000 counts, and if more than 50% of those come from <1% of pixels, then it is considered to be noise-dominated and hence unusable.
| Quadrant | # 1 sec bins | Bins with >0 counts | Bins with >2000 counts | High rate bins dominated by noise | Noise dominated (total time) | Noise dominated (detector-on time) | Marked lightcurve |
|---|---|---|---|---|---|---|---|
| A | 152296 | 122338 | 0 | 0 | 0.00% | 0.00% |  |
| B | 152296 | 122340 | 0 | 0 | 0.00% | 0.00% |  |
| C | 152296 | 122343 | 0 | 0 | 0.00% | 0.00% |  |
| D | 152296 | 121952 | 0 | 0 | 0.00% | 0.00% |  |
Top three noisy pixels from each quadrant. If the there are fewer than three noisy pixels in the level2.evt file, extra rows are filled as -1
| Pixel properties | Quadrant properties | ||||||
|---|---|---|---|---|---|---|---|
| Quadrant | DetID | PixID | Counts | Sigma | Mean | Median | Sigma |
| A | 0 | 29 | 5402 | 11.73 | 1478 | 1378 | 343.1 |
| A | 7 | 110 | 5240 | 11.26 | 1478 | 1378 | 343.1 |
| A | 14 | 188 | 4213 | 8.26 | 1478 | 1378 | 343.1 |
| B | 2 | 9 | 4576 | 11.9 | 1488 | 1414 | 265.6 |
| B | 14 | 254 | 3843 | 9.14 | 1488 | 1414 | 265.6 |
| B | 2 | 8 | 3614 | 8.28 | 1488 | 1414 | 265.6 |
| C | 12 | 241 | 3785 | 6.86 | 1461 | 1350 | 355.1 |
| C | 2 | 191 | 3660 | 6.5 | 1461 | 1350 | 355.1 |
| C | 9 | 242 | 3567 | 6.24 | 1461 | 1350 | 355.1 |
| D | 6 | 44 | 3516 | 7.05 | 1363 | 1246 | 321.8 |
| D | 11 | 82 | 3483 | 6.95 | 1363 | 1246 | 321.8 |
| D | 3 | 30 | 3358 | 6.56 | 1363 | 1246 | 321.8 |
Histogram calculated using DETX and DETY for each event in the final _common_clean file
| Quadrant A | 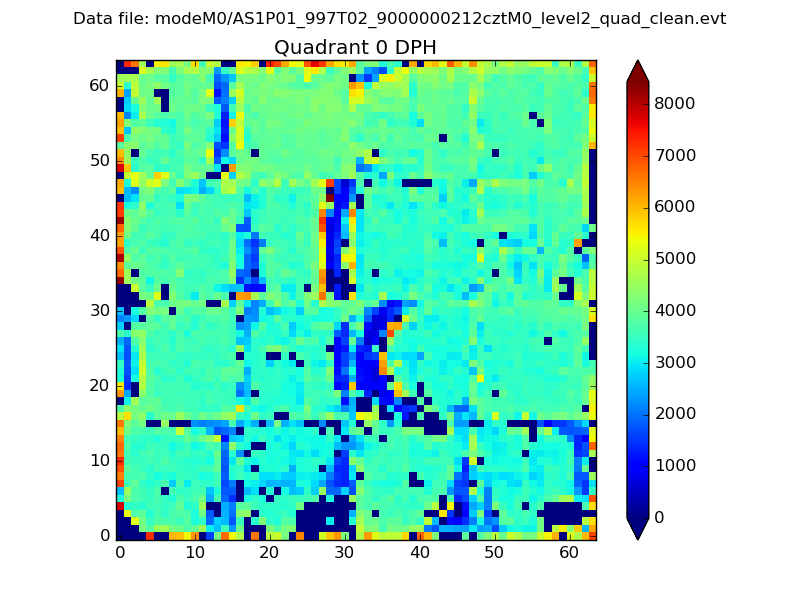 |
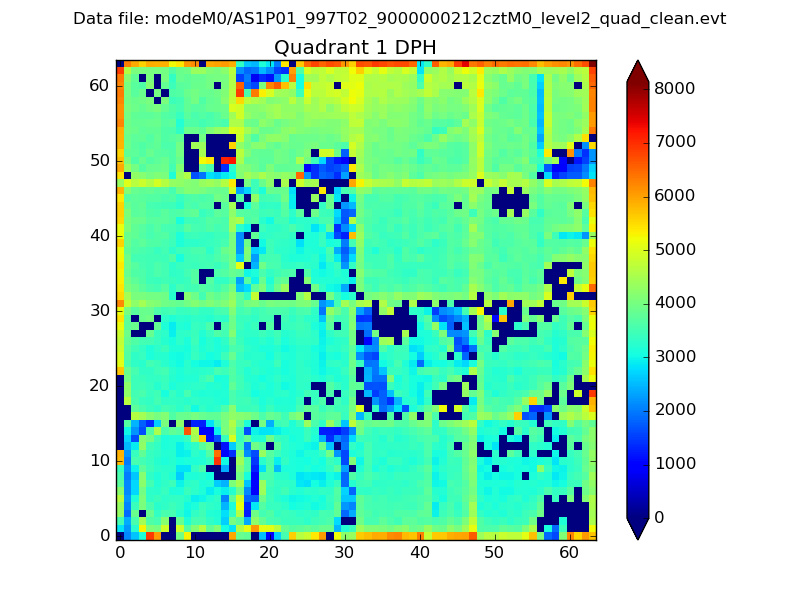 |
Quadrant B |
|---|---|---|---|
| Quadrant D |  |
 |
Quadrant C |
| Plot type | Count rate plots | Images |
|---|---|---|
| Comparison with Poisson distribution Blue bars denote a histogram of data divided into 1 sec bins. Red curve is a Poisson curve with rate = median count rate of data. |
 |
 |
| Quadrant-wise count rates Data is divided into 100 sec bins |
 |
|
| Module-wise count rates for Quadrant A Data is divided into 100 sec bins |
 |
 |
| Module-wise count rates for Quadrant B Data is divided into 100 sec bins |
 |
 |
| Module-wise count rates for Quadrant C Data is divided into 100 sec bins |
 |
 |
| Module-wise count rates for Quadrant D Data is divided into 100 sec bins |
 |
 |
| Parameter | Plot |
|---|---|
| CZT HV Monitor |  |
| D_VDD |  |
| Temperature 1 |  |
| Veto HV Monitor |  |
| Veto LLD |  |
| Alpha Counter |  |
| _CPM_Rate |  |
| CZT Counter |  |
| +2.5 Volts monitor |  |
| +5 Volts monitor |  |
| _ROLL_ROT |  |
| _Roll_DEC |  |
| _Roll_RA |  |
| Veto Counter |  |