| Param | Original file | Final file |
|---|---|---|
| Filename | modeM0/AS1P01_997T02_9000000212_01086cztM0_level2.evt | modeM0/AS1P01_997T02_9000000212_01086cztM0_level2_quad_clean.evt |
| Size (bytes) | 862,021,440 | 79,263,360 |
| Size | 822.1 MB | 75.6 MB |
| Events in quadrant A | 6,016,061 | 527,260 |
| Events in quadrant B | 6,285,076 | 523,675 |
| Events in quadrant C | 6,100,387 | 503,028 |
| Events in quadrant D | 7,368,323 | 490,614 |
| Mode M9 | |||
|---|---|---|---|
| Quadrant | BADHDUFLAG | Total packets | Discarded packets |
| A | 0 | 11 | 0 |
| B | 0 | 11 | 0 |
| C | 0 | 11 | 0 |
| D | 0 | 11 | 0 |
| Mode M0 | |||
|---|---|---|---|
| Quadrant | BADHDUFLAG | Total packets | Discarded packets |
| A | 0 | 21489 | 2 |
| B | 0 | 22274 | 1 |
| C | 0 | 21711 | 1 |
| D | 0 | 25476 | 1 |
| Mode SS | |||
|---|---|---|---|
| Quadrant | BADHDUFLAG | Total packets | Discarded packets |
| A | 0 | 104 | 0 |
| B | 0 | 104 | 0 |
| C | 0 | 104 | 0 |
| D | 0 | 104 | 0 |
| Quadrant | Total seconds | Saturated seconds | Saturation percentage |
|---|---|---|---|
| A | 5073 | 24 | 0.473093% |
| B | 5073 | 24 | 0.473093% |
| C | 5073 | 11 | 0.216834% |
| D | 5073 | 78 | 1.537552% |
Noise dominated data is calculated using 1-second bins in cleaned event files. If a bin has >2000 counts, and if more than 50% of those come from <1% of pixels, then it is considered to be noise-dominated and hence unusable.
| Quadrant | # 1 sec bins | Bins with >0 counts | Bins with >2000 counts | High rate bins dominated by noise | Noise dominated (total time) | Noise dominated (detector-on time) | Marked lightcurve |
|---|---|---|---|---|---|---|---|
| A | 6238 | 5074 | 176 | 176 | 2.82% | 3.47% | 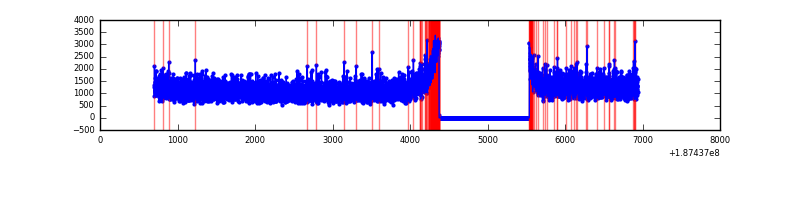 |
| B | 6238 | 5074 | 227 | 227 | 3.64% | 4.47% | 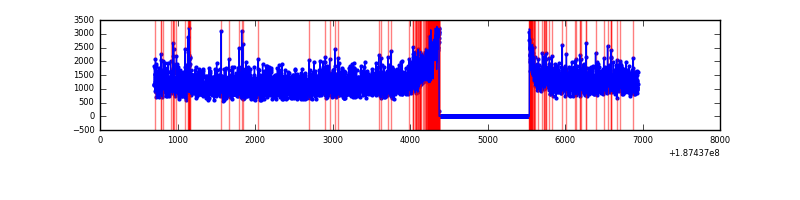 |
| C | 6238 | 5074 | 172 | 172 | 2.76% | 3.39% | 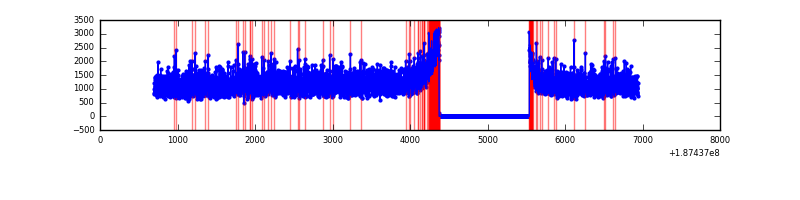 |
| D | 6238 | 5074 | 667 | 667 | 10.69% | 13.15% | 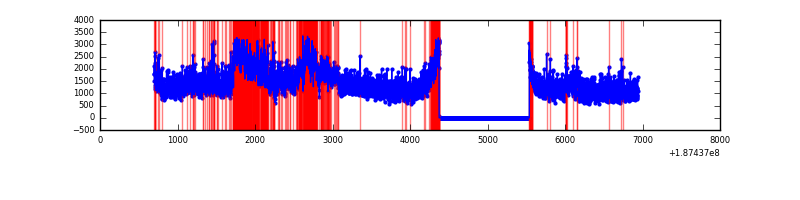 |
Top three noisy pixels from each quadrant. If the there are fewer than three noisy pixels in the level2.evt file, extra rows are filled as -1
| Pixel properties | Quadrant properties | ||||||
|---|---|---|---|---|---|---|---|
| Quadrant | DetID | PixID | Counts | Sigma | Mean | Median | Sigma |
| A | 4 | 32 | 16174 | 39.26 | 1564 | 1567 | 372.1 |
| A | 11 | 79 | 6178 | 12.39 | 1564 | 1567 | 372.1 |
| A | 3 | 111 | 4517 | 7.93 | 1564 | 1567 | 372.1 |
| B | 5 | 191 | 50746 | 129.54 | 1605 | 1610 | 379.3 |
| B | 15 | 22 | 44905 | 114.14 | 1605 | 1610 | 379.3 |
| B | 15 | 85 | 35364 | 88.98 | 1605 | 1610 | 379.3 |
| C | 15 | 241 | 242187 | 583.99 | 1481 | 1531 | 412.1 |
| C | 3 | 79 | 27137 | 62.14 | 1481 | 1531 | 412.1 |
| C | 9 | 52 | 22817 | 51.65 | 1481 | 1531 | 412.1 |
| D | 12 | 22 | 1469700 | 3276.1 | 1454 | 1505 | 448.2 |
| D | 13 | 73 | 428153 | 952.01 | 1454 | 1505 | 448.2 |
| D | 2 | 107 | 14086 | 28.07 | 1454 | 1505 | 448.2 |
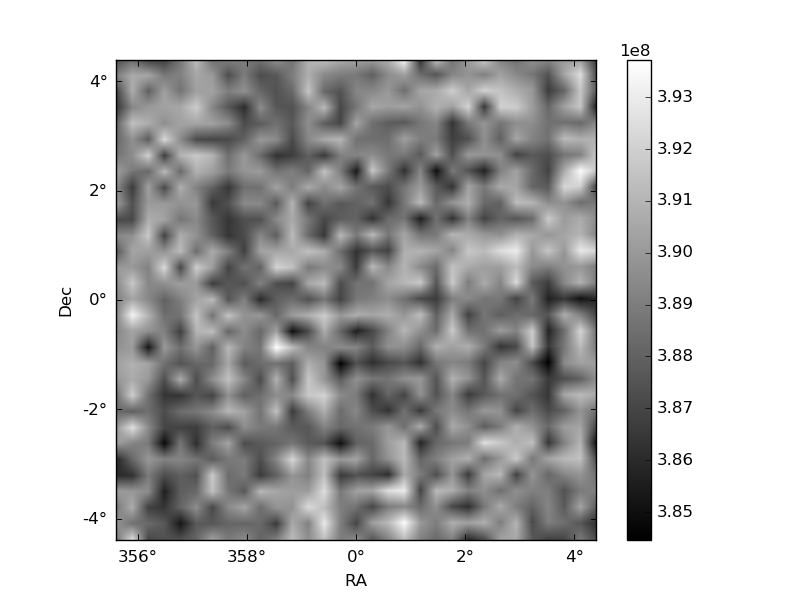
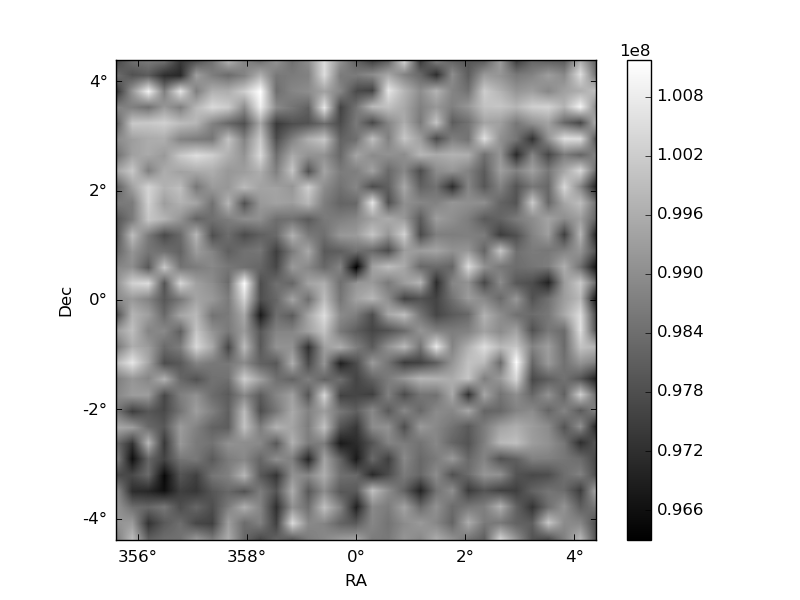
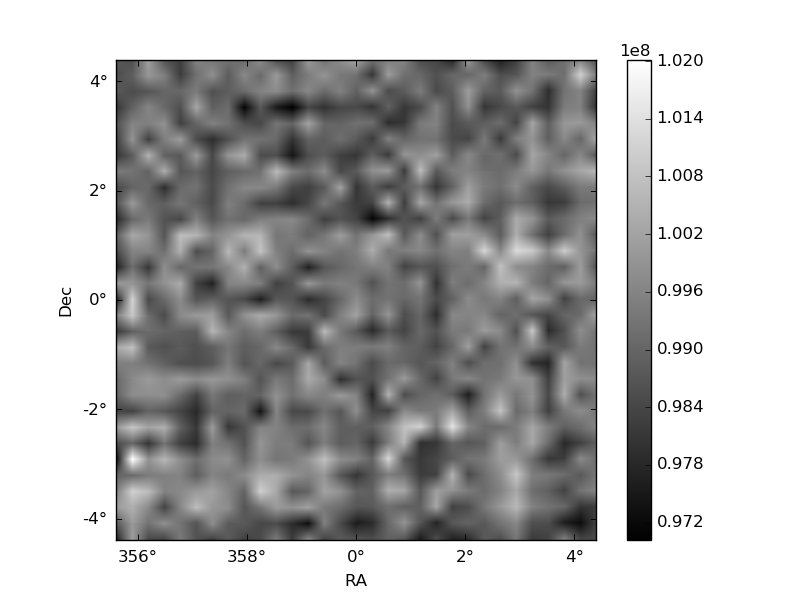
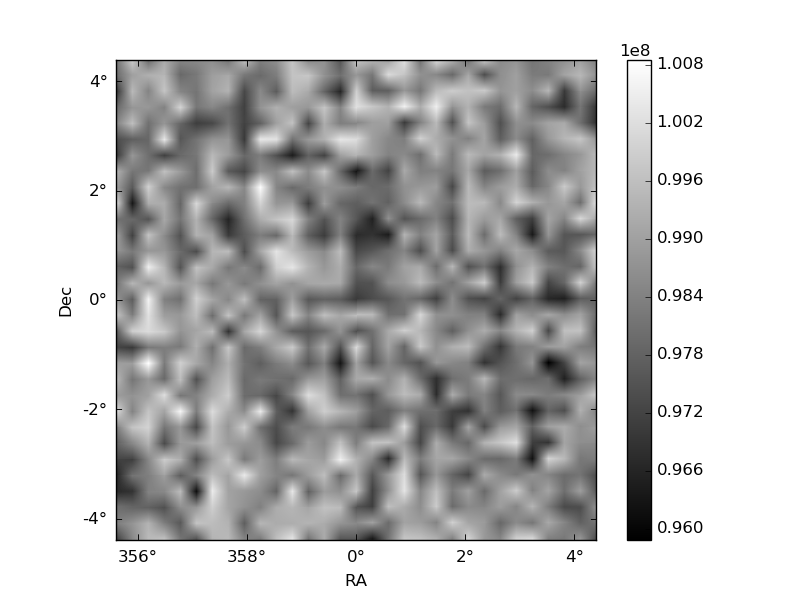
Histogram calculated using DETX and DETY for each event in the final _common_clean file
| Quadrant A | 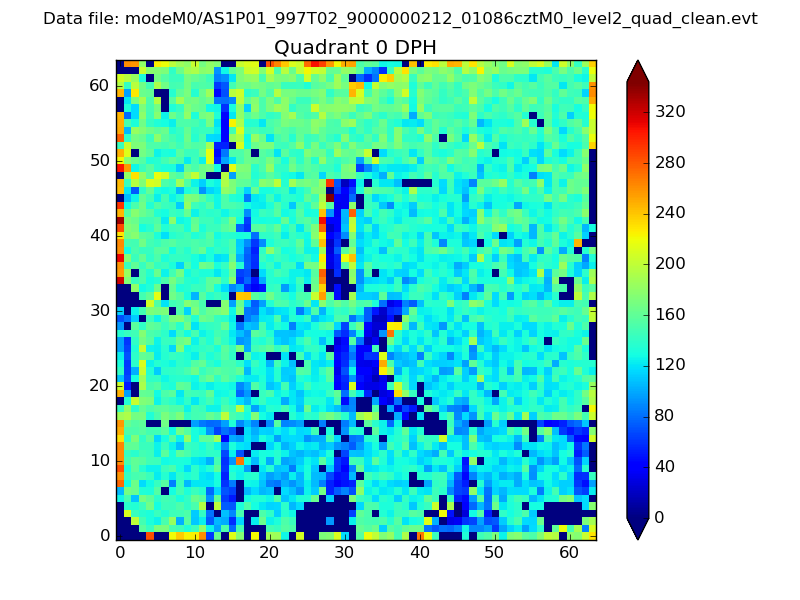 |
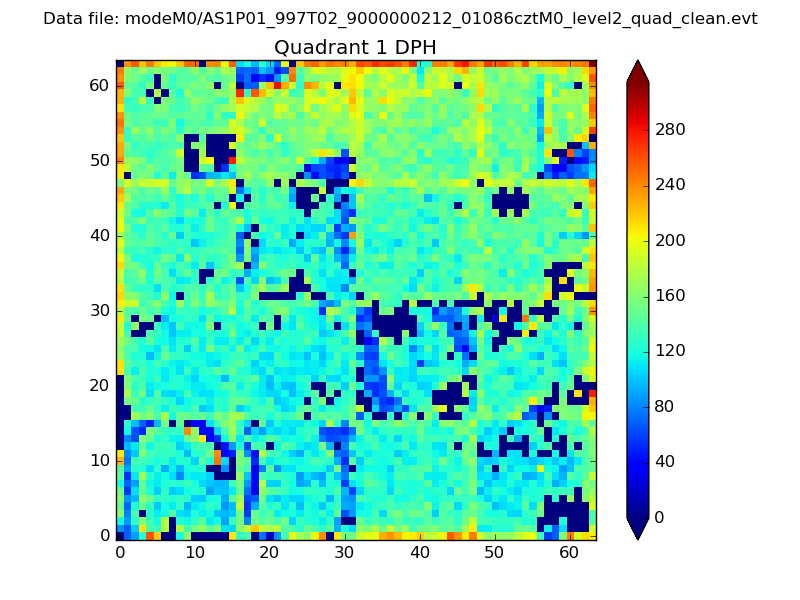 |
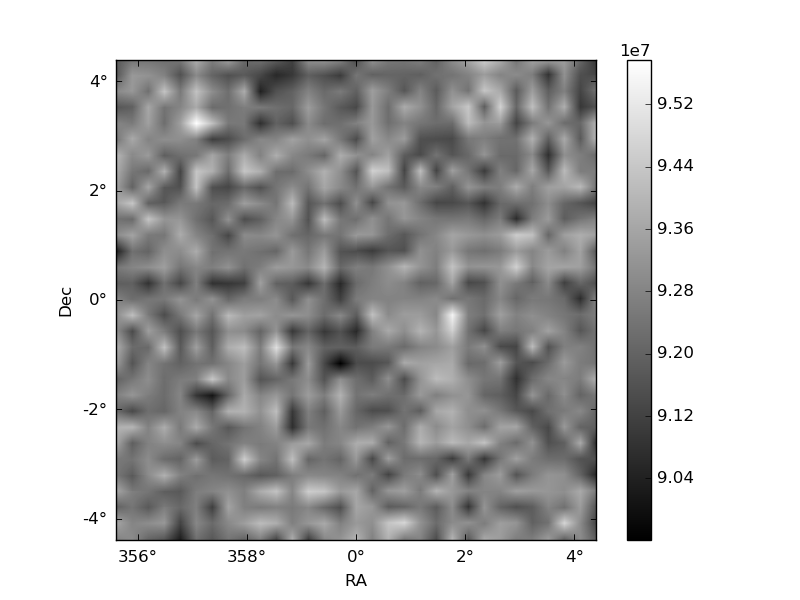
Quadrant B |
|---|---|---|---|
| Quadrant D | 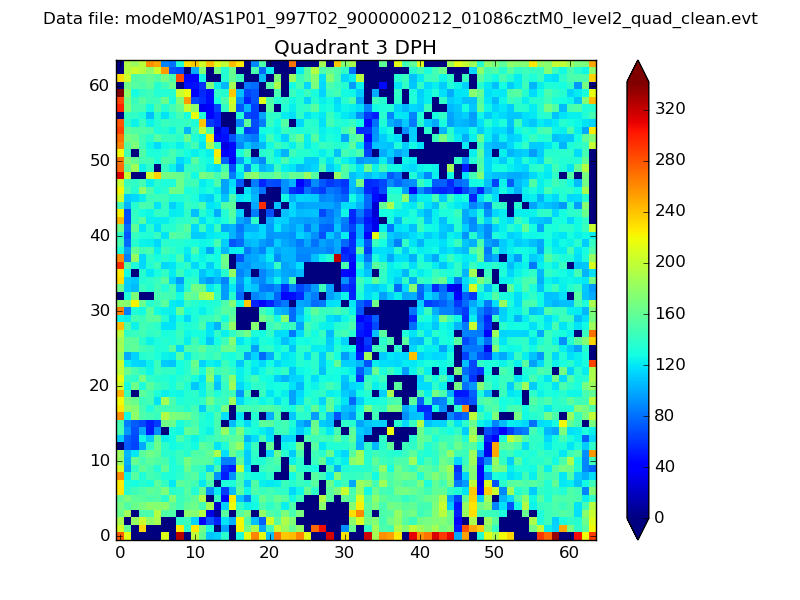 |
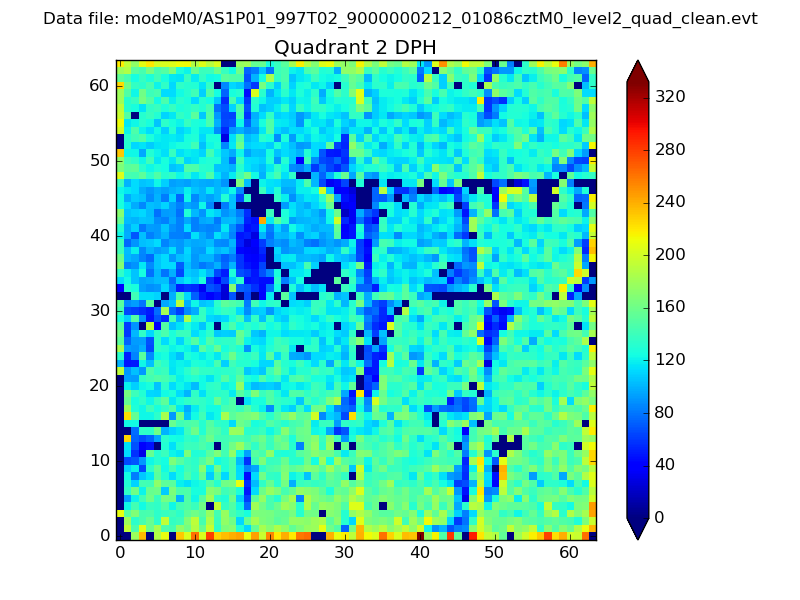 |
Quadrant C |
| Plot type | Count rate plots | Images |
|---|---|---|
| Comparison with Poisson distribution Blue bars denote a histogram of data divided into 1 sec bins. Red curve is a Poisson curve with rate = median count rate of data. |
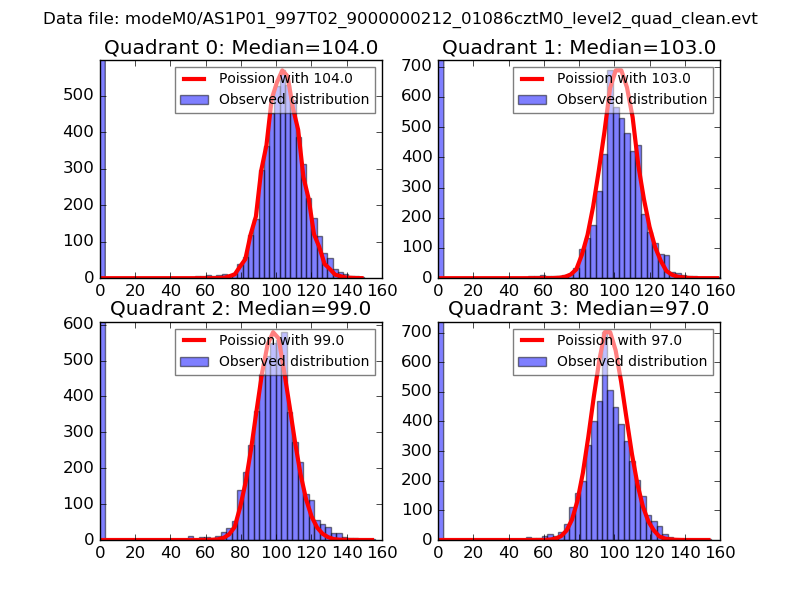 |
 |
| Quadrant-wise count rates Data is divided into 100 sec bins |
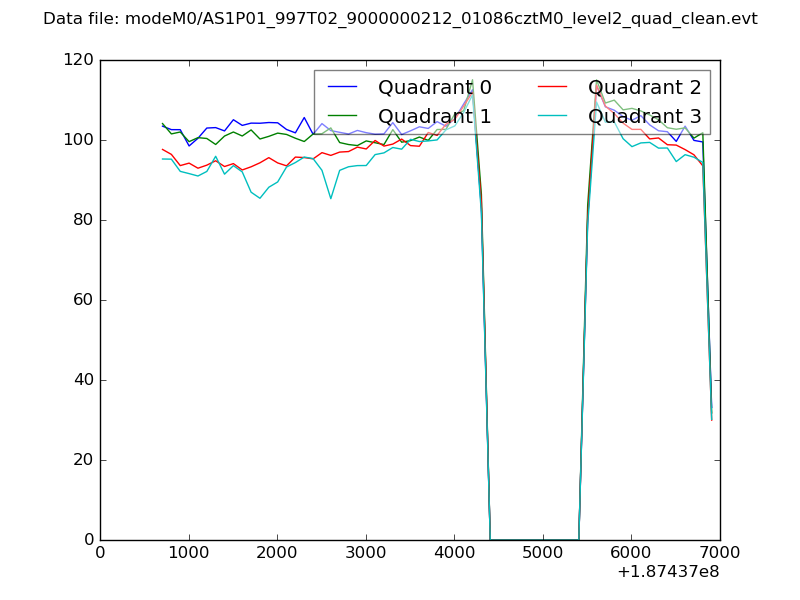 |
|
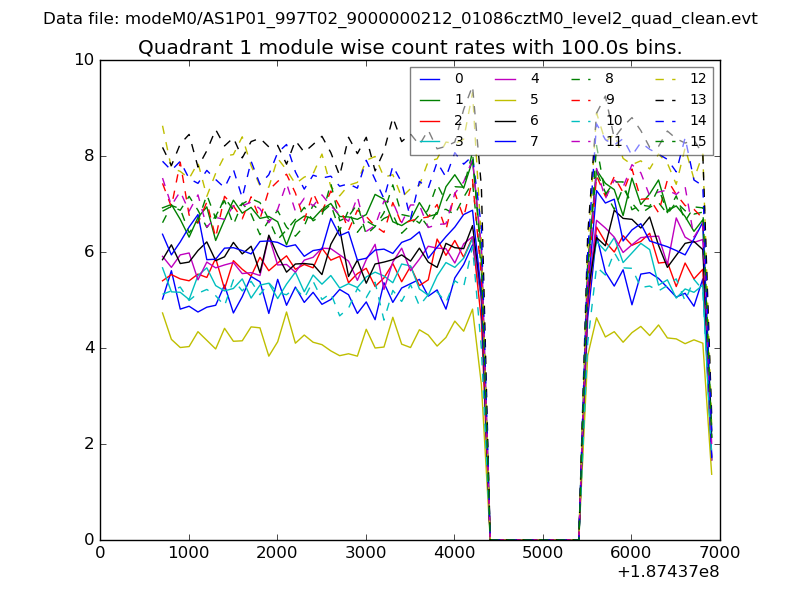
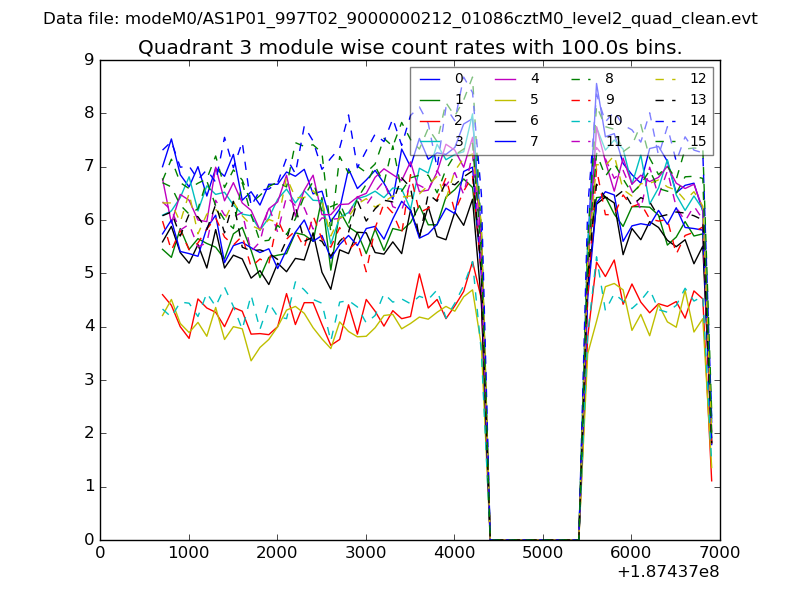
| Module-wise count rates for Quadrant A Data is divided into 100 sec bins |
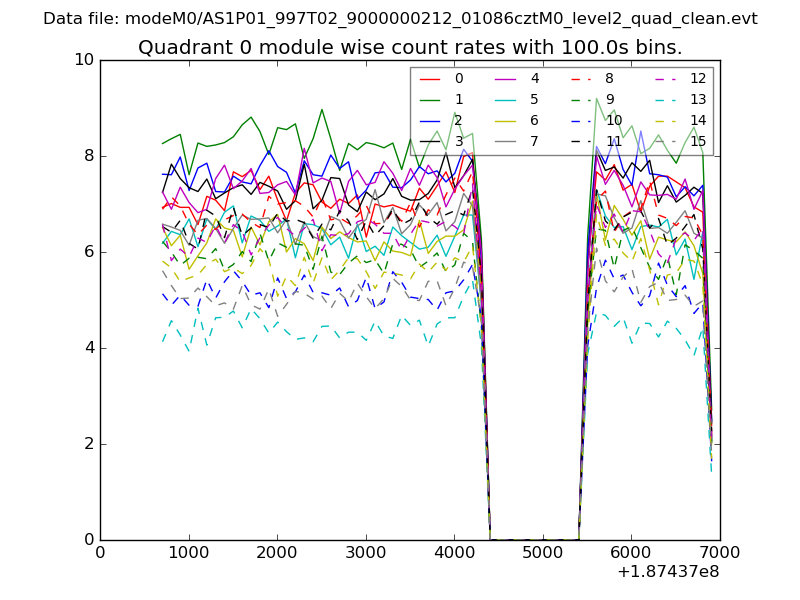 |
 |
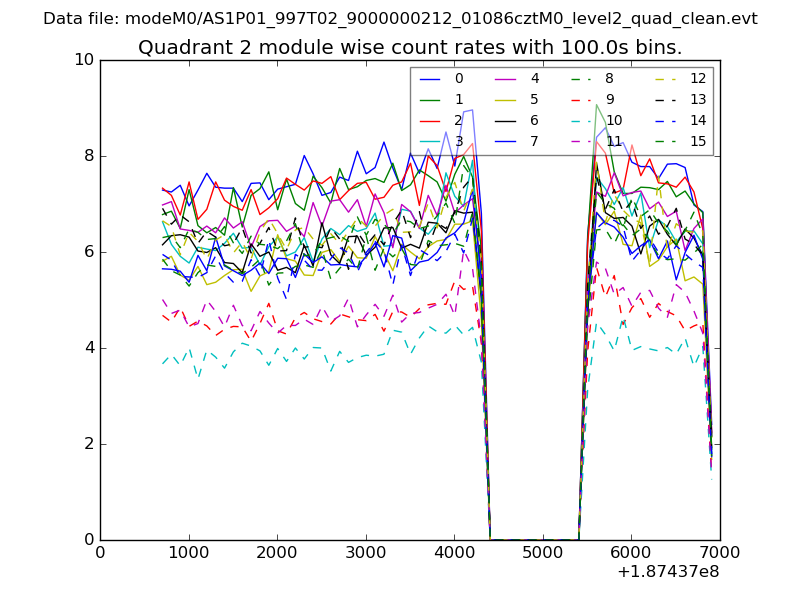
| Module-wise count rates for Quadrant B Data is divided into 100 sec bins |
 |
 |
| Module-wise count rates for Quadrant C Data is divided into 100 sec bins |
 |
 |
| Module-wise count rates for Quadrant D Data is divided into 100 sec bins |
 |
 |
| Parameter | Plot |
|---|---|
| CZT HV Monitor | 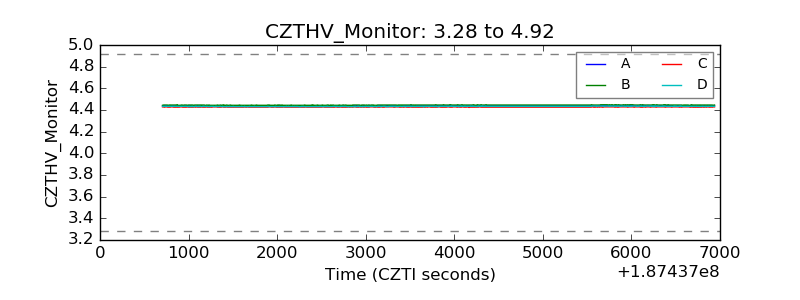 |
| D_VDD | 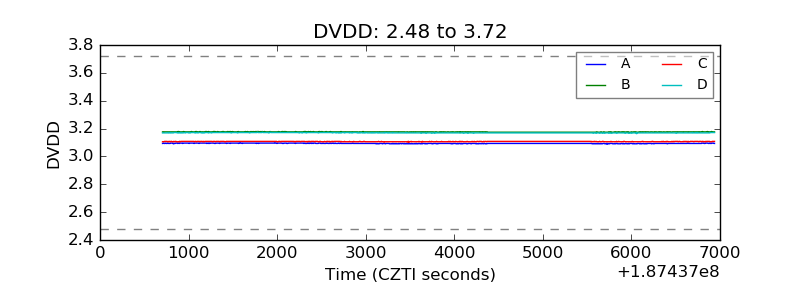 |
| Temperature 1 | 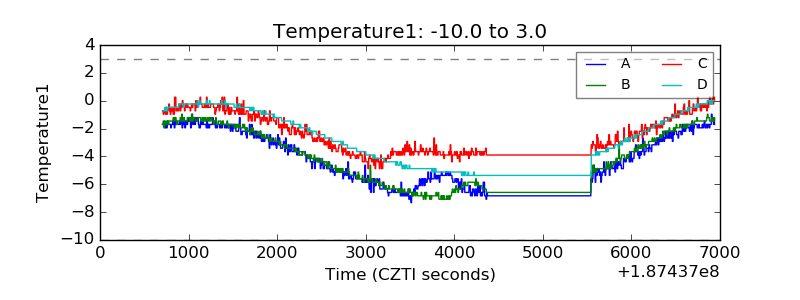 |
| Veto HV Monitor | 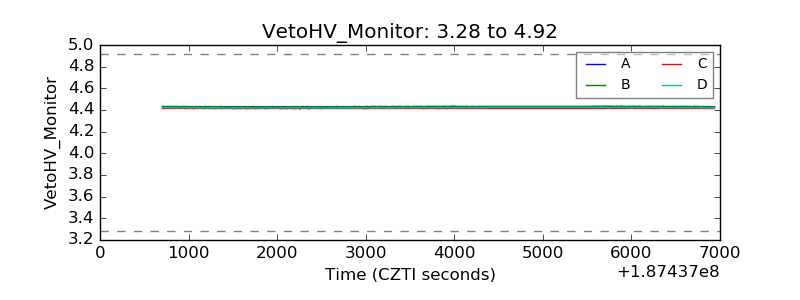 |
| Veto LLD | 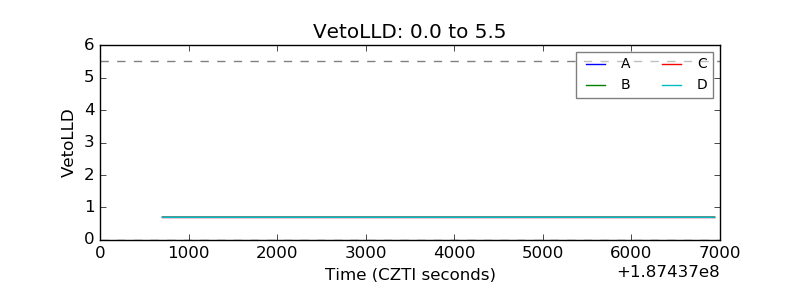 |
| Alpha Counter |  |
| _CPM_Rate |  |
| CZT Counter | 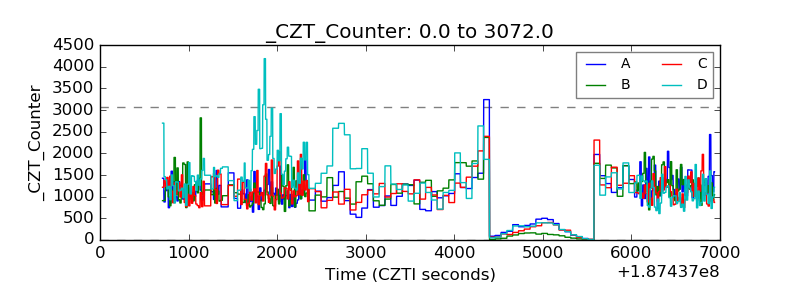 |
| +2.5 Volts monitor |  |
| +5 Volts monitor |  |
| _ROLL_ROT | 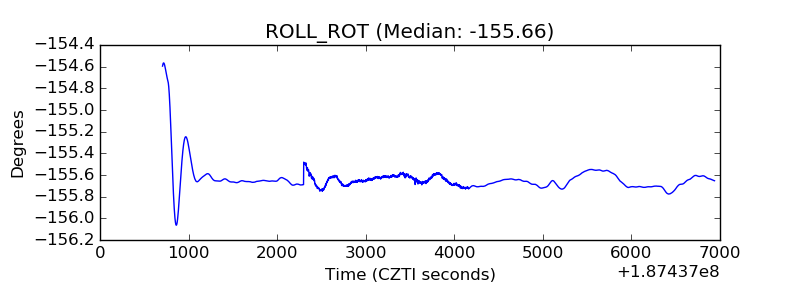 |
| _Roll_DEC | 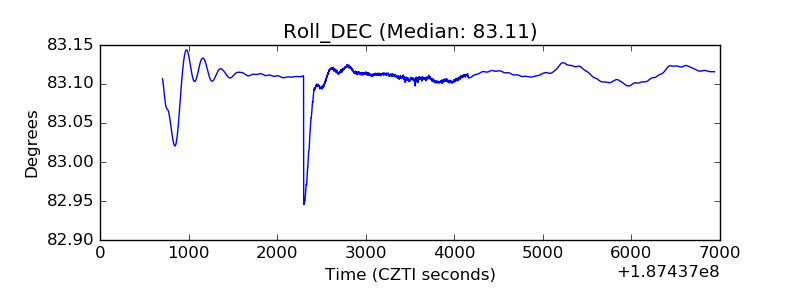 |
| _Roll_RA | 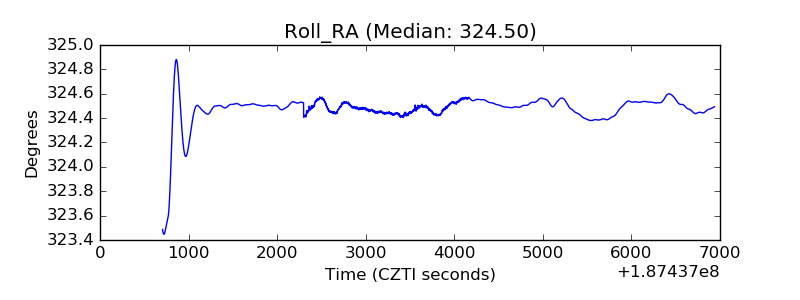 |
| Veto Counter | 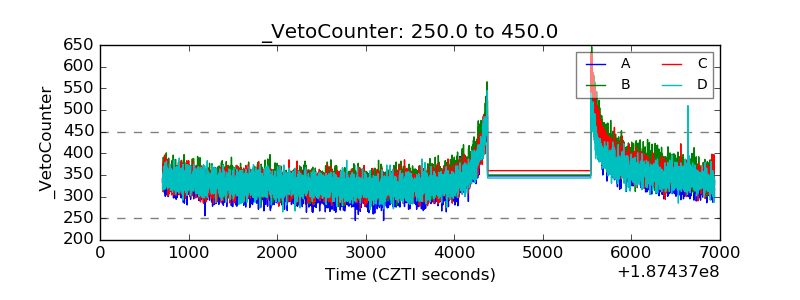 |