| Param | Original file | Final file |
|---|---|---|
| Filename | modeM0/AS1P01_997T02_9000000212_01087cztM0_level2.evt | modeM0/AS1P01_997T02_9000000212_01087cztM0_level2_quad_clean.evt |
| Size (bytes) | 1,035,495,360 | 100,992,960 |
| Size | 987.5 MB | 96.3 MB |
| Events in quadrant A | 7,653,914 | 672,175 |
| Events in quadrant B | 7,900,797 | 660,944 |
| Events in quadrant C | 7,689,480 | 640,515 |
| Events in quadrant D | 7,689,519 | 636,444 |
| Mode M9 | |||
|---|---|---|---|
| Quadrant | BADHDUFLAG | Total packets | Discarded packets |
| A | 0 | 10 | 0 |
| B | 0 | 10 | 0 |
| C | 0 | 10 | 0 |
| D | 0 | 10 | 0 |
| Mode M0 | |||
|---|---|---|---|
| Quadrant | BADHDUFLAG | Total packets | Discarded packets |
| A | 0 | 27247 | 2 |
| B | 0 | 28052 | 1 |
| C | 0 | 27386 | 1 |
| D | 0 | 27439 | 1 |
| Mode SS | |||
|---|---|---|---|
| Quadrant | BADHDUFLAG | Total packets | Discarded packets |
| A | 0 | 128 | 0 |
| B | 0 | 128 | 0 |
| C | 0 | 128 | 0 |
| D | 0 | 128 | 0 |
| Quadrant | Total seconds | Saturated seconds | Saturation percentage |
|---|---|---|---|
| A | 6437 | 56 | 0.869970% |
| B | 6437 | 35 | 0.543732% |
| C | 6437 | 33 | 0.512661% |
| D | 6437 | 90 | 1.398167% |
Noise dominated data is calculated using 1-second bins in cleaned event files. If a bin has >2000 counts, and if more than 50% of those come from <1% of pixels, then it is considered to be noise-dominated and hence unusable.
| Quadrant | # 1 sec bins | Bins with >0 counts | Bins with >2000 counts | High rate bins dominated by noise | Noise dominated (total time) | Noise dominated (detector-on time) | Marked lightcurve |
|---|---|---|---|---|---|---|---|
| A | 7392 | 6437 | 253 | 253 | 3.42% | 3.93% | 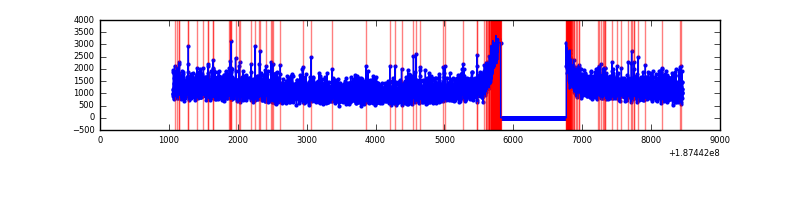 |
| B | 7392 | 6437 | 274 | 274 | 3.71% | 4.26% | 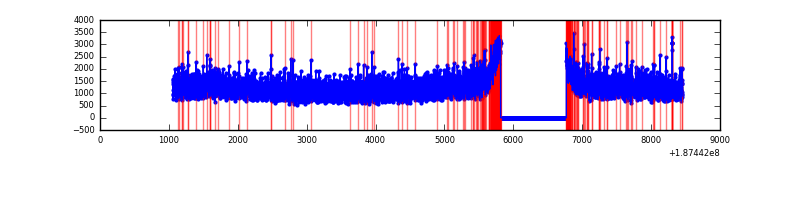 |
| C | 7392 | 6437 | 210 | 210 | 2.84% | 3.26% | 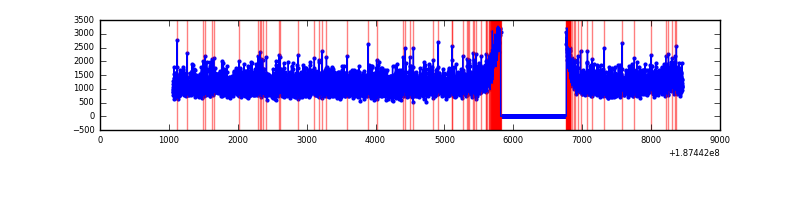 |
| D | 7392 | 6437 | 314 | 314 | 4.25% | 4.88% | 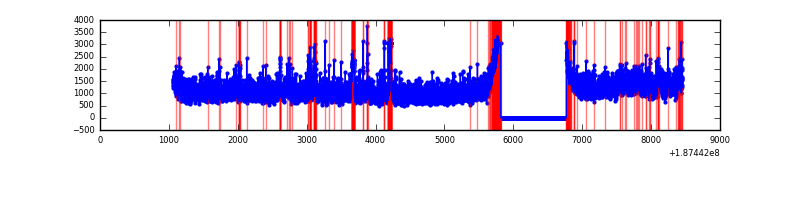 |
Top three noisy pixels from each quadrant. If the there are fewer than three noisy pixels in the level2.evt file, extra rows are filled as -1
| Pixel properties | Quadrant properties | ||||||
|---|---|---|---|---|---|---|---|
| Quadrant | DetID | PixID | Counts | Sigma | Mean | Median | Sigma |
| A | 4 | 32 | 46158 | 92.57 | 1983 | 1996 | 477.0 |
| A | 11 | 79 | 8889 | 14.45 | 1983 | 1996 | 477.0 |
| A | 3 | 111 | 5978 | 8.35 | 1983 | 1996 | 477.0 |
| B | 15 | 22 | 53116 | 106.73 | 2028 | 2035 | 478.6 |
| B | 15 | 85 | 43192 | 86.0 | 2028 | 2035 | 478.6 |
| B | 5 | 191 | 21705 | 41.1 | 2028 | 2035 | 478.6 |
| C | 15 | 241 | 304266 | 584.95 | 1859 | 1923 | 516.9 |
| C | 9 | 202 | 41655 | 76.87 | 1859 | 1923 | 516.9 |
| C | 3 | 79 | 37616 | 69.06 | 1859 | 1923 | 516.9 |
| D | 12 | 22 | 375541 | 657.54 | 1843 | 1915 | 568.2 |
| D | 2 | 216 | 270563 | 472.79 | 1843 | 1915 | 568.2 |
| D | 13 | 73 | 56304 | 95.72 | 1843 | 1915 | 568.2 |
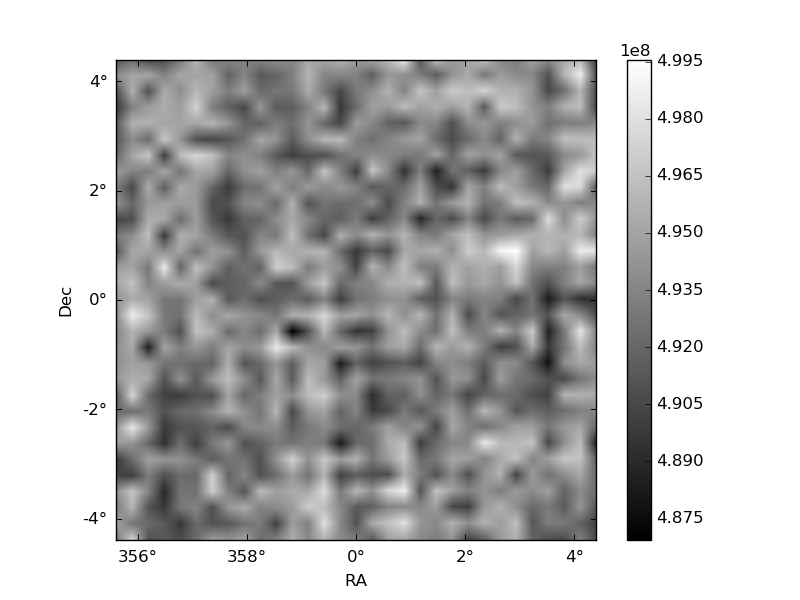
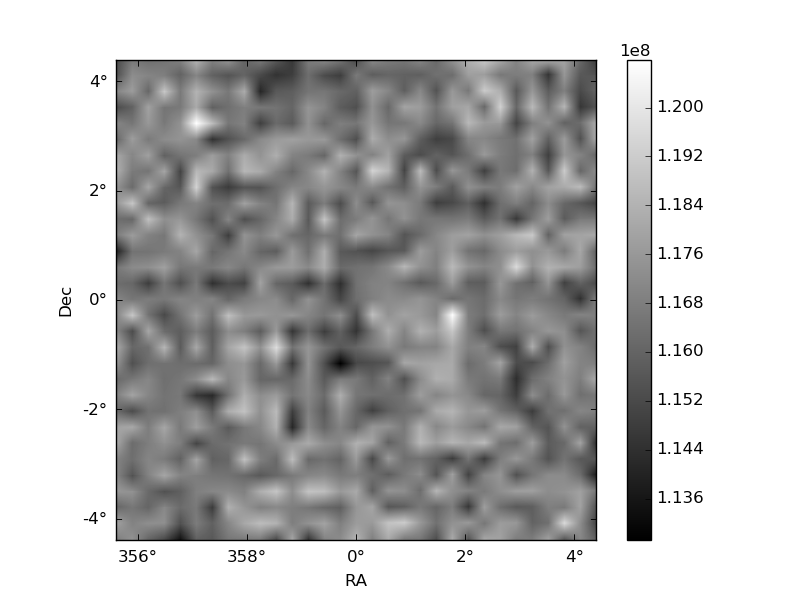
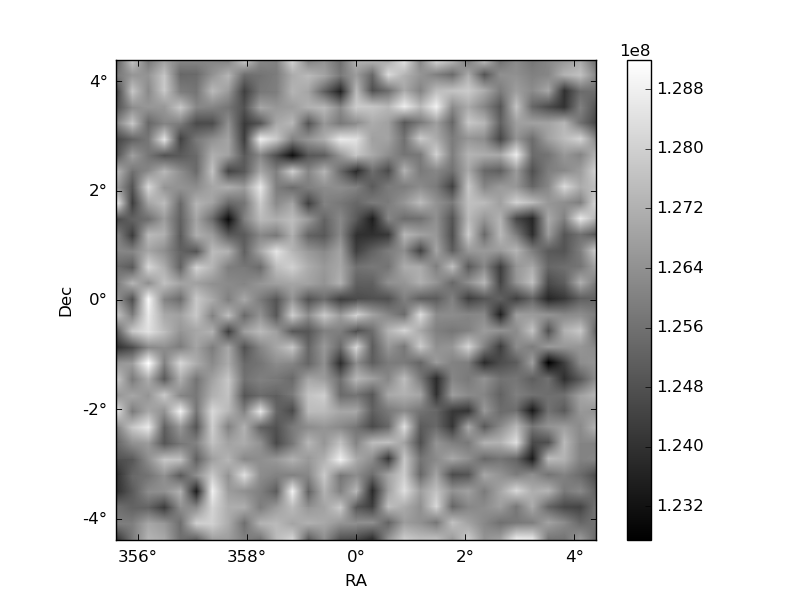
Histogram calculated using DETX and DETY for each event in the final _common_clean file
| Quadrant A | 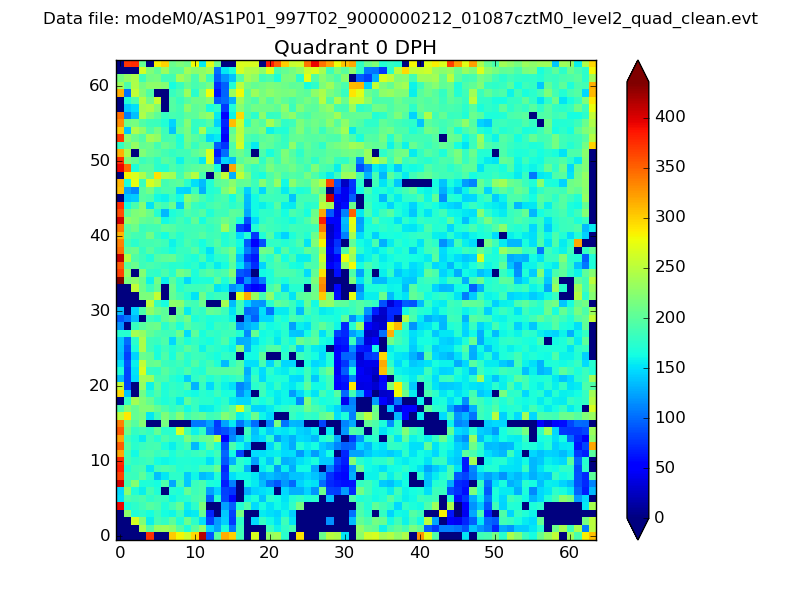 |
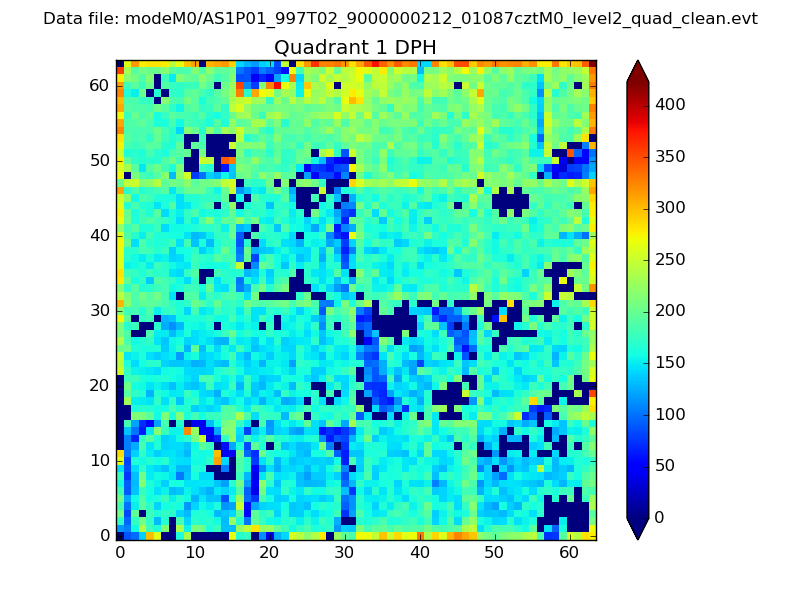 |
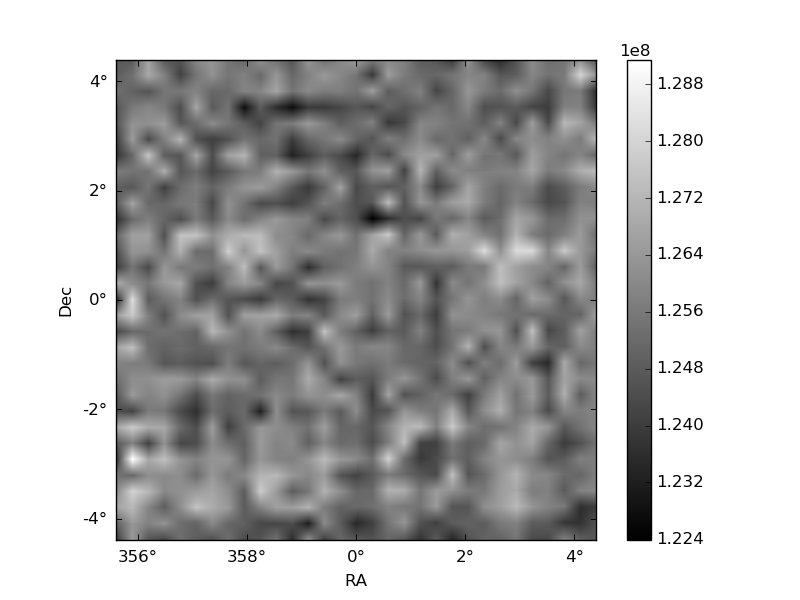
Quadrant B |
|---|---|---|---|
| Quadrant D | 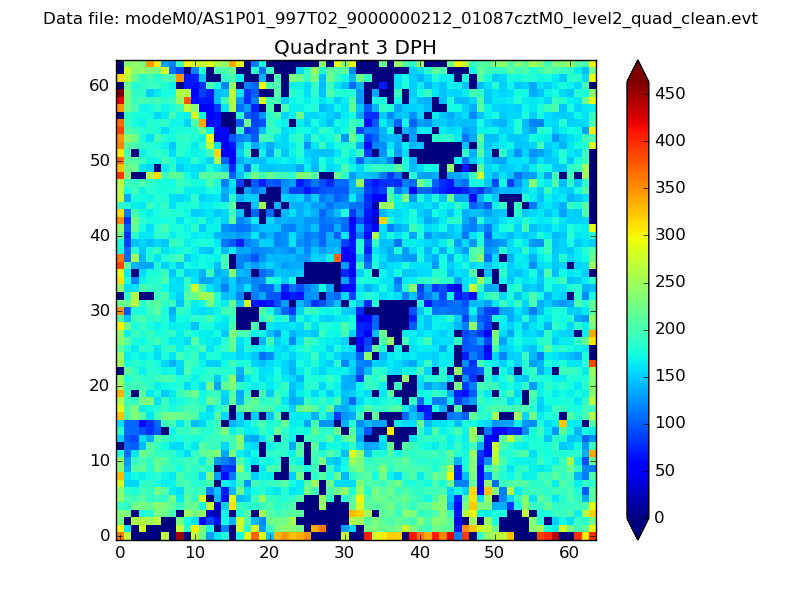 |
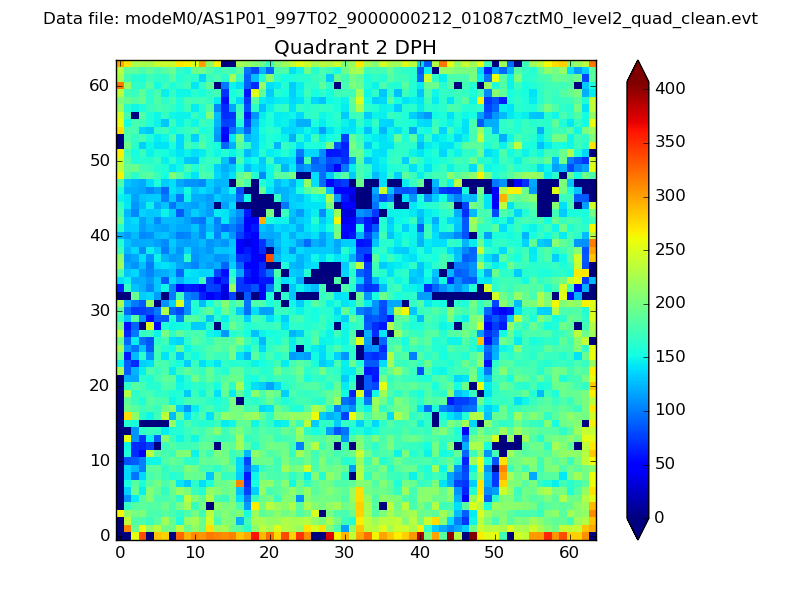 |
Quadrant C |
| Plot type | Count rate plots | Images |
|---|---|---|
| Comparison with Poisson distribution Blue bars denote a histogram of data divided into 1 sec bins. Red curve is a Poisson curve with rate = median count rate of data. |
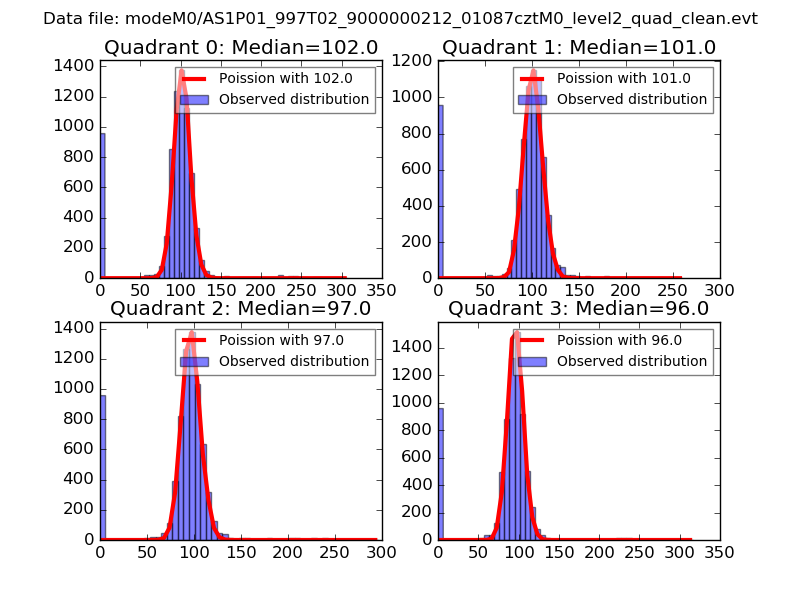 |
 |
| Quadrant-wise count rates Data is divided into 100 sec bins |
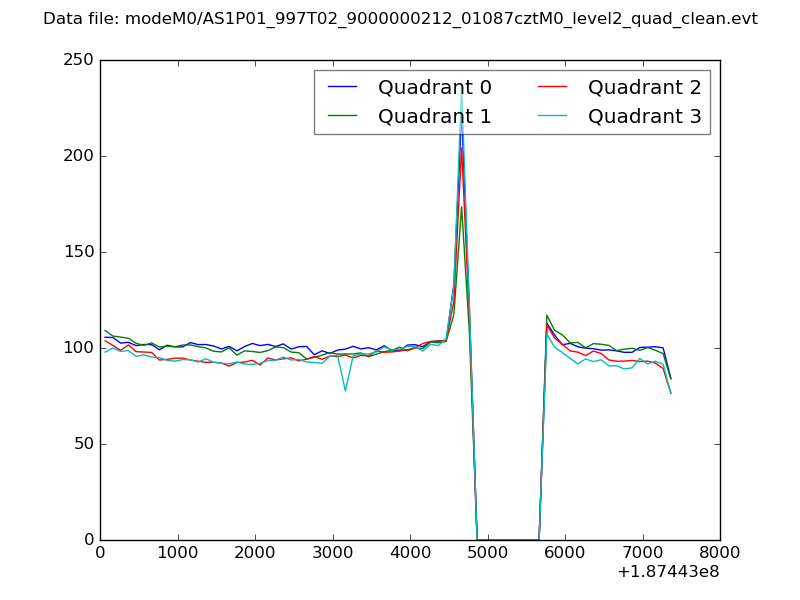 |
|
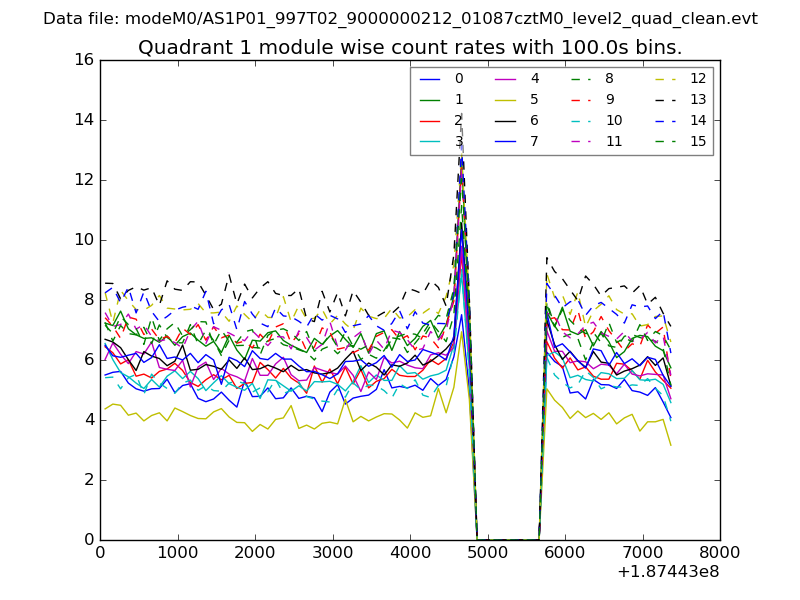
| Module-wise count rates for Quadrant A Data is divided into 100 sec bins |
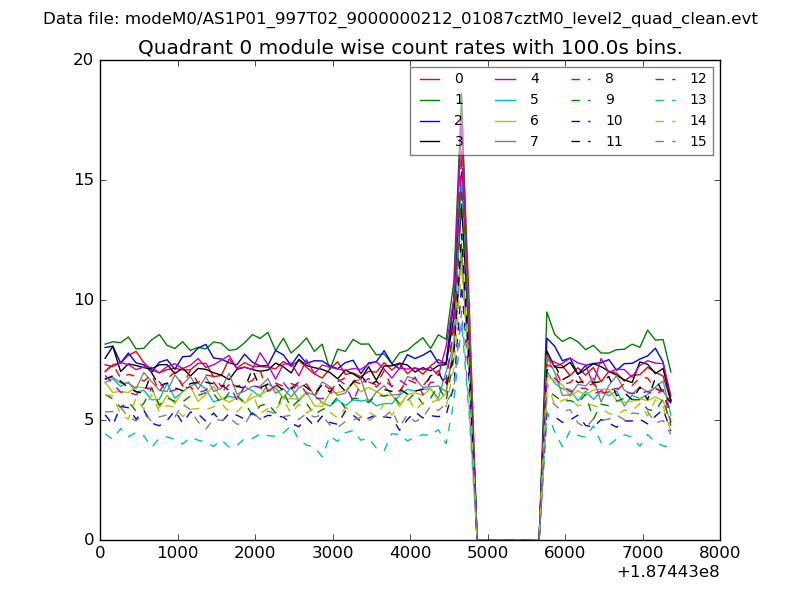 |
 |
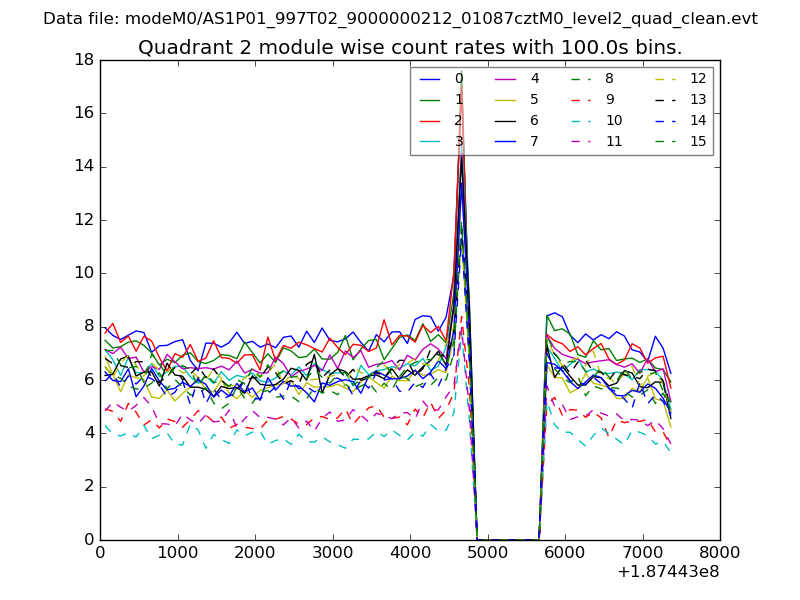
| Module-wise count rates for Quadrant B Data is divided into 100 sec bins |
 |
 |
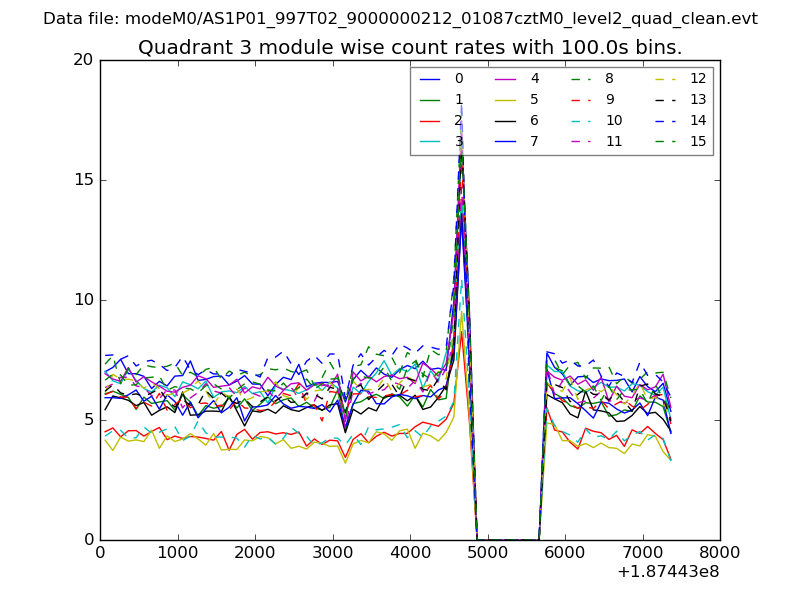
| Module-wise count rates for Quadrant C Data is divided into 100 sec bins |
 |
 |
| Module-wise count rates for Quadrant D Data is divided into 100 sec bins |
 |
 |
| Parameter | Plot |
|---|---|
| CZT HV Monitor | 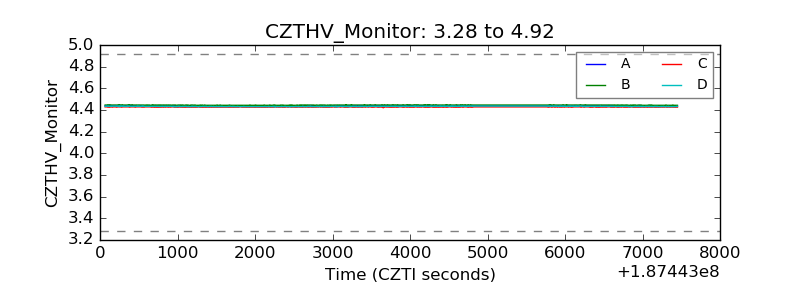 |
| D_VDD | 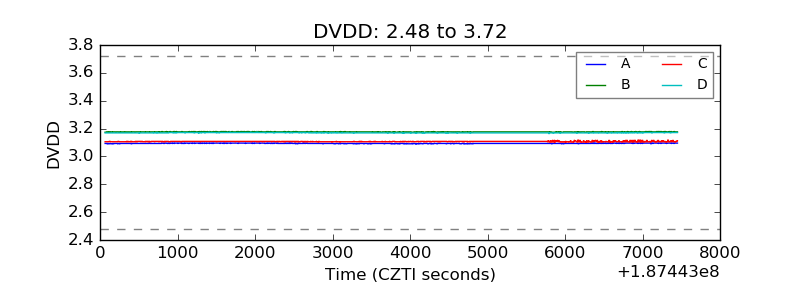 |
| Temperature 1 | 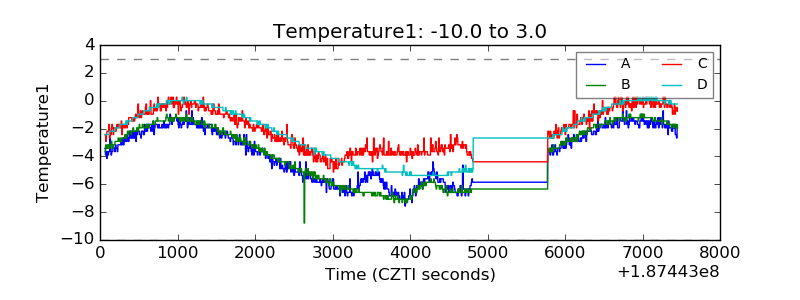 |
| Veto HV Monitor | 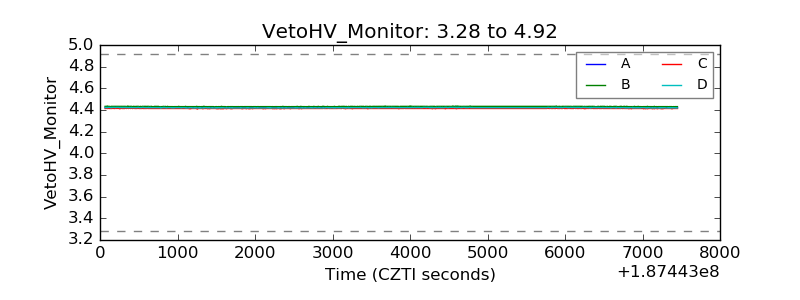 |
| Veto LLD | 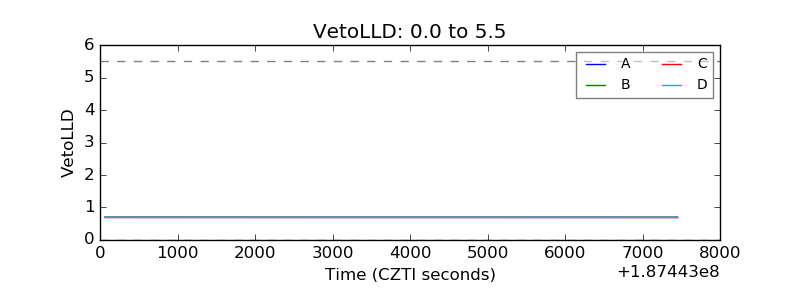 |
| Alpha Counter | 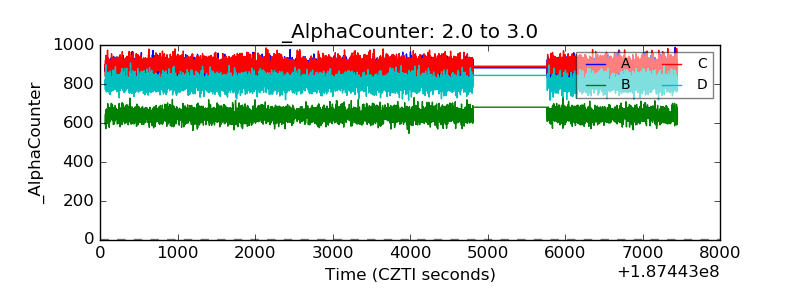 |
| _CPM_Rate | 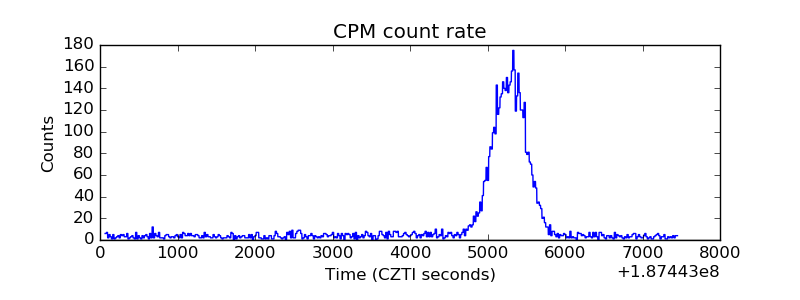 |
| CZT Counter | 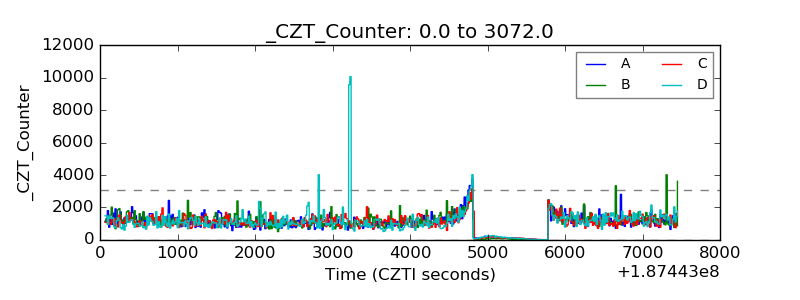 |
| +2.5 Volts monitor |  |
| +5 Volts monitor |  |
| _ROLL_ROT | 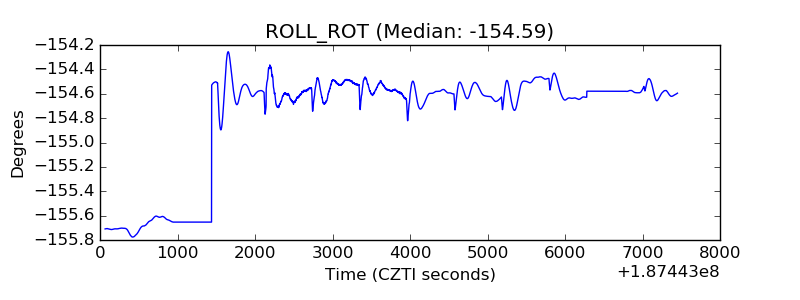 |
| _Roll_DEC | 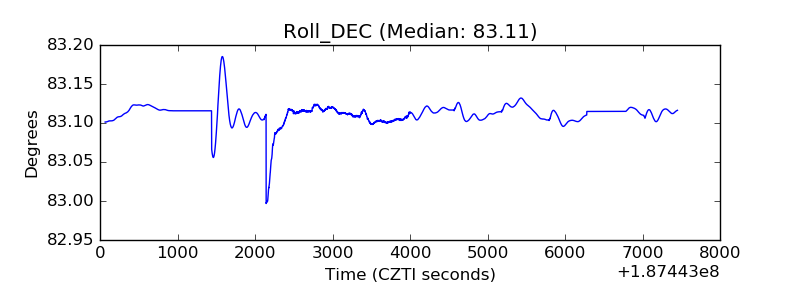 |
| _Roll_RA | 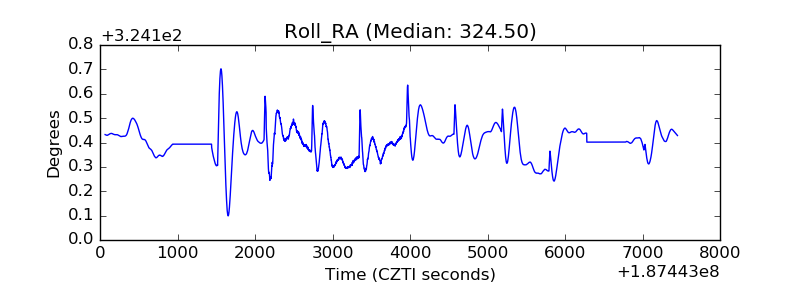 |
| Veto Counter | 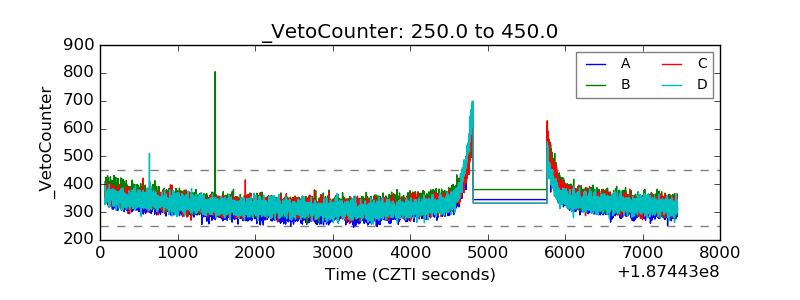 |