| Param | Original file | Final file |
|---|---|---|
| Filename | modeM0/AS1P01_997T02_9000000212_01088cztM0_level2.evt | modeM0/AS1P01_997T02_9000000212_01088cztM0_level2_quad_clean.evt |
| Size (bytes) | 1,051,424,640 | 93,913,920 |
| Size | 1002.7 MB | 89.6 MB |
| Events in quadrant A | 7,276,072 | 626,221 |
| Events in quadrant B | 7,702,813 | 616,120 |
| Events in quadrant C | 7,534,840 | 597,261 |
| Events in quadrant D | 8,915,884 | 569,323 |
| Mode M9 | |||
|---|---|---|---|
| Quadrant | BADHDUFLAG | Total packets | Discarded packets |
| A | 0 | 6 | 0 |
| B | 0 | 6 | 0 |
| C | 0 | 6 | 0 |
| D | 0 | 6 | 0 |
| Mode M0 | |||
|---|---|---|---|
| Quadrant | BADHDUFLAG | Total packets | Discarded packets |
| A | 0 | 26064 | 3 |
| B | 0 | 27330 | 2 |
| C | 0 | 26813 | 2 |
| D | 0 | 30927 | 2 |
| Mode SS | |||
|---|---|---|---|
| Quadrant | BADHDUFLAG | Total packets | Discarded packets |
| A | 0 | 128 | 0 |
| B | 0 | 128 | 0 |
| C | 0 | 128 | 0 |
| D | 0 | 128 | 0 |
| Quadrant | Total seconds | Saturated seconds | Saturation percentage |
|---|---|---|---|
| A | 6227 | 13 | 0.208768% |
| B | 6227 | 34 | 0.546009% |
| C | 6227 | 20 | 0.321182% |
| D | 6227 | 353 | 5.668861% |
Noise dominated data is calculated using 1-second bins in cleaned event files. If a bin has >2000 counts, and if more than 50% of those come from <1% of pixels, then it is considered to be noise-dominated and hence unusable.
| Quadrant | # 1 sec bins | Bins with >0 counts | Bins with >2000 counts | High rate bins dominated by noise | Noise dominated (total time) | Noise dominated (detector-on time) | Marked lightcurve |
|---|---|---|---|---|---|---|---|
| A | 6887 | 6229 | 234 | 234 | 3.40% | 3.76% | 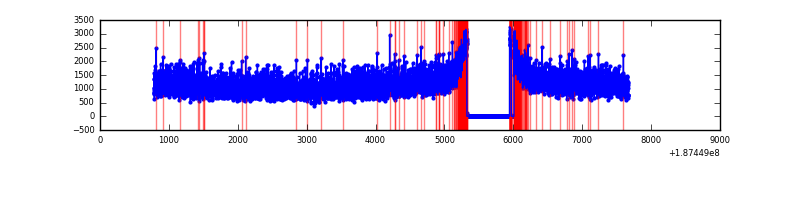 |
| B | 6887 | 6229 | 305 | 305 | 4.43% | 4.90% | 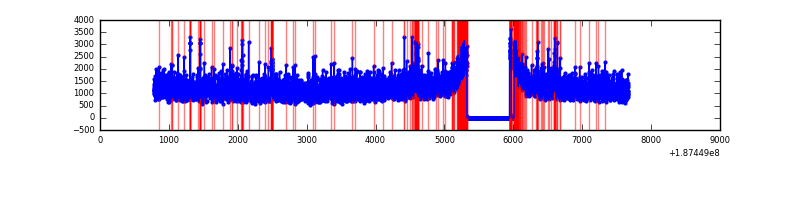 |
| C | 6887 | 6229 | 209 | 209 | 3.03% | 3.36% | 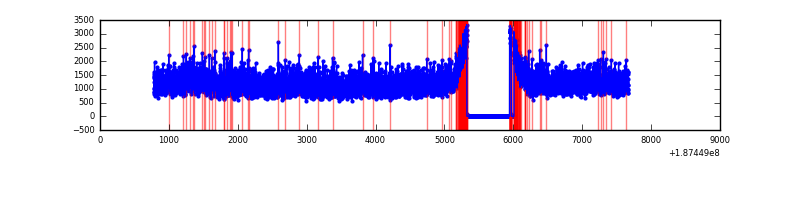 |
| D | 6886 | 6227 | 709 | 709 | 10.30% | 11.39% | 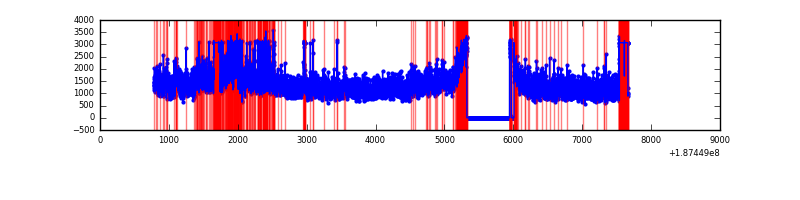 |
Top three noisy pixels from each quadrant. If the there are fewer than three noisy pixels in the level2.evt file, extra rows are filled as -1
| Pixel properties | Quadrant properties | ||||||
|---|---|---|---|---|---|---|---|
| Quadrant | DetID | PixID | Counts | Sigma | Mean | Median | Sigma |
| A | 4 | 32 | 9044 | 15.76 | 1892 | 1906 | 452.8 |
| A | 11 | 79 | 7709 | 12.81 | 1892 | 1906 | 452.8 |
| A | 13 | 9 | 6194 | 9.47 | 1892 | 1906 | 452.8 |
| B | 5 | 191 | 87732 | 186.49 | 1954 | 1964 | 459.9 |
| B | 14 | 53 | 65047 | 137.17 | 1954 | 1964 | 459.9 |
| B | 5 | 249 | 51327 | 107.33 | 1954 | 1964 | 459.9 |
| C | 15 | 241 | 299080 | 587.51 | 1811 | 1878 | 505.9 |
| C | 9 | 202 | 69259 | 133.2 | 1811 | 1878 | 505.9 |
| C | 3 | 79 | 46282 | 87.78 | 1811 | 1878 | 505.9 |
| D | 12 | 22 | 1374764 | 2379.11 | 1797 | 1808 | 577.1 |
| D | 10 | 102 | 49331 | 82.35 | 1797 | 1808 | 577.1 |
| D | 7 | 207 | 47633 | 79.41 | 1797 | 1808 | 577.1 |
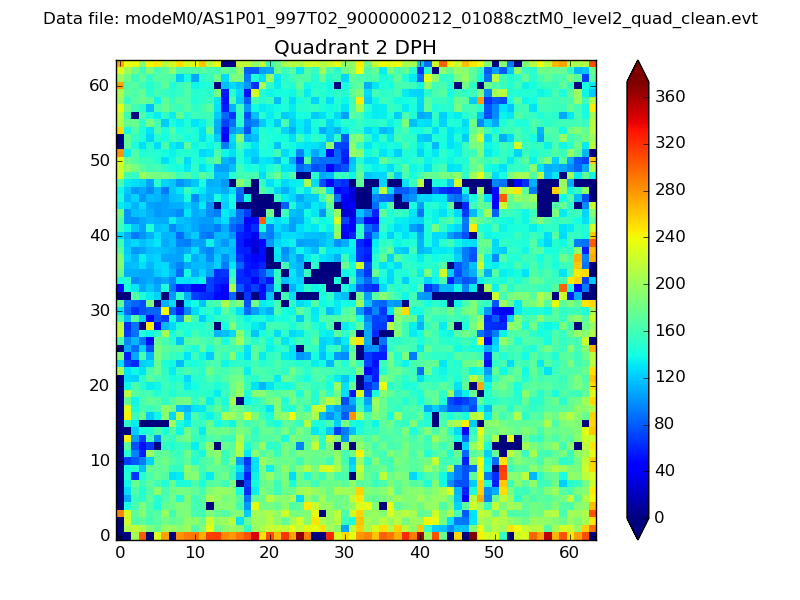
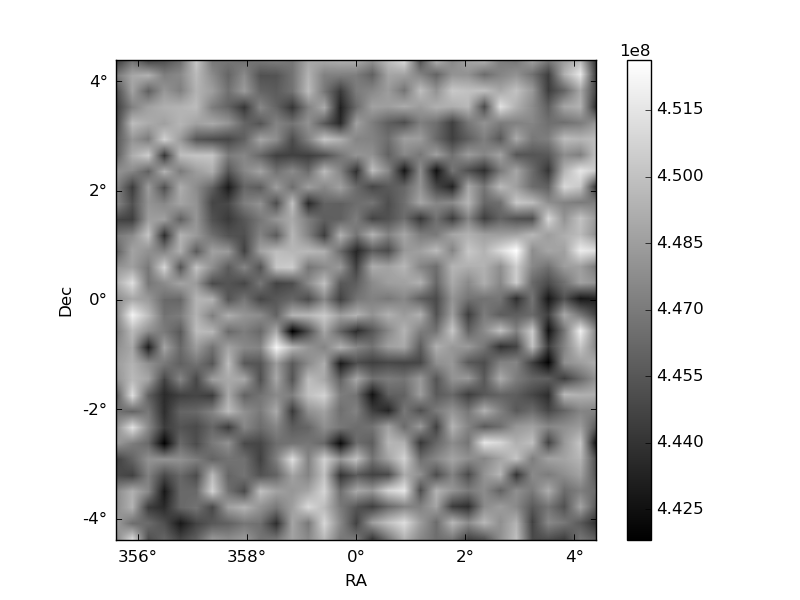
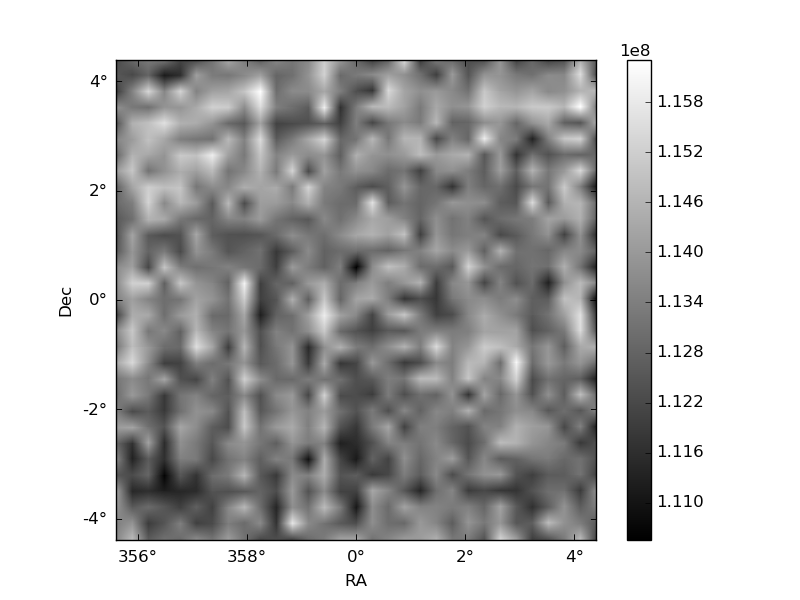
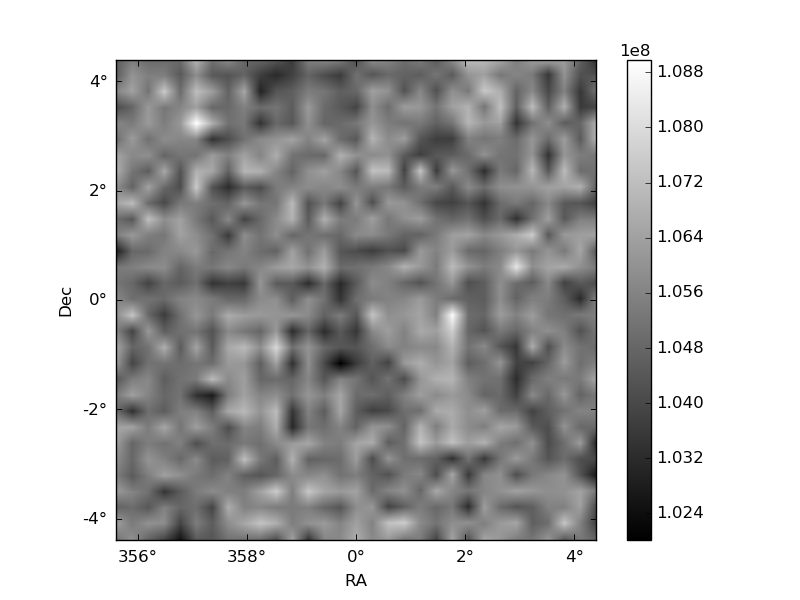
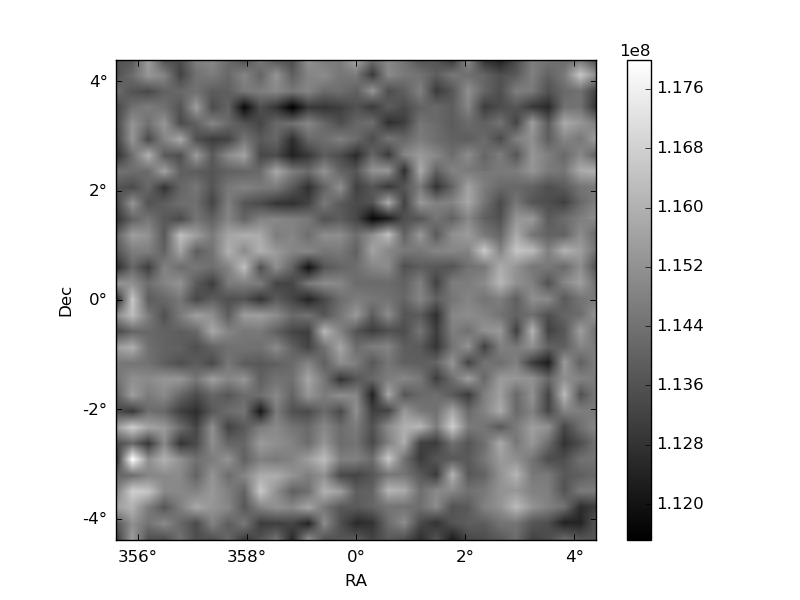
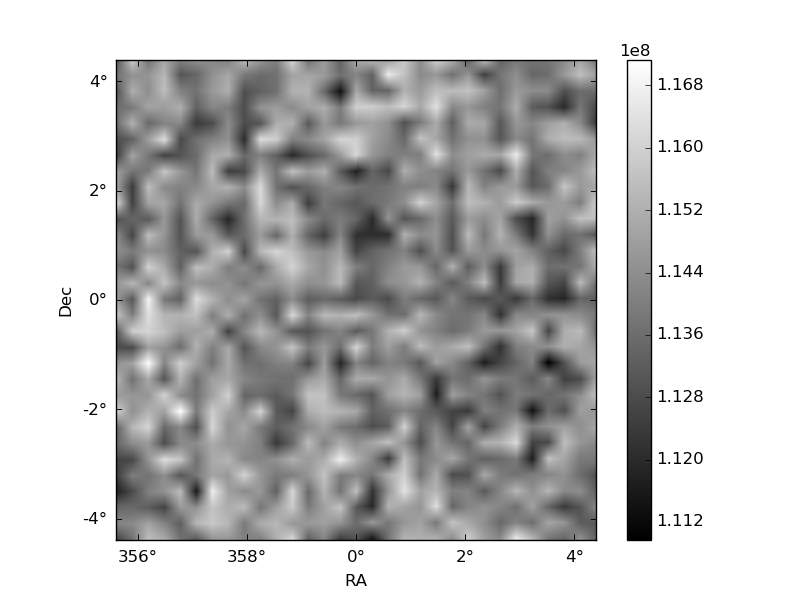
Histogram calculated using DETX and DETY for each event in the final _common_clean file
| Quadrant A | 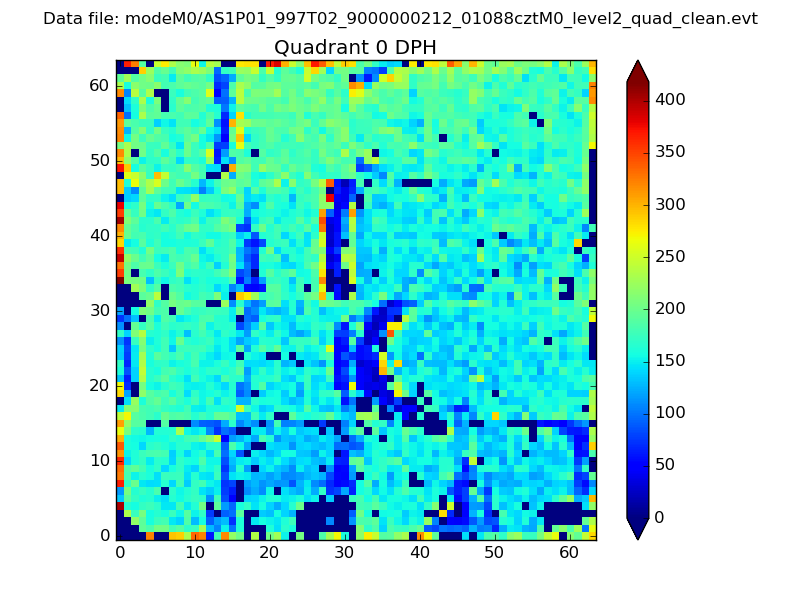 |
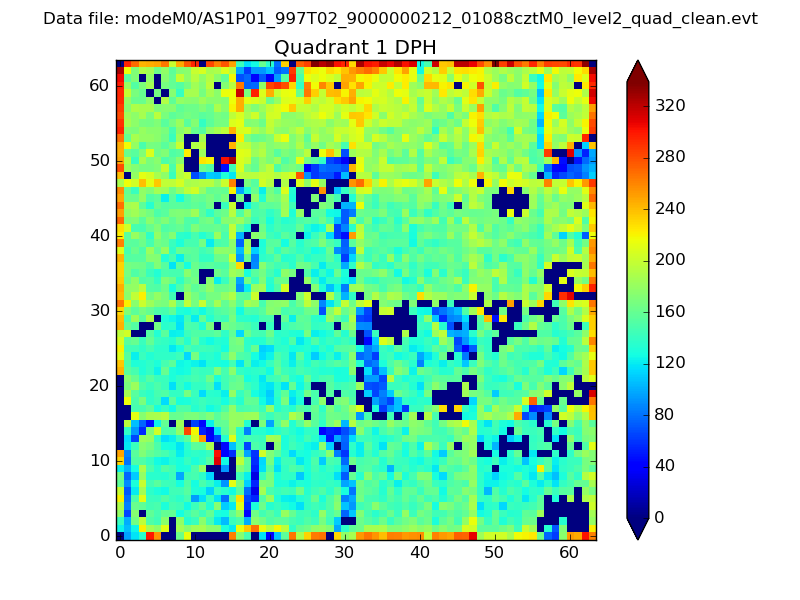 |
Quadrant B |
|---|---|---|---|
| Quadrant D | 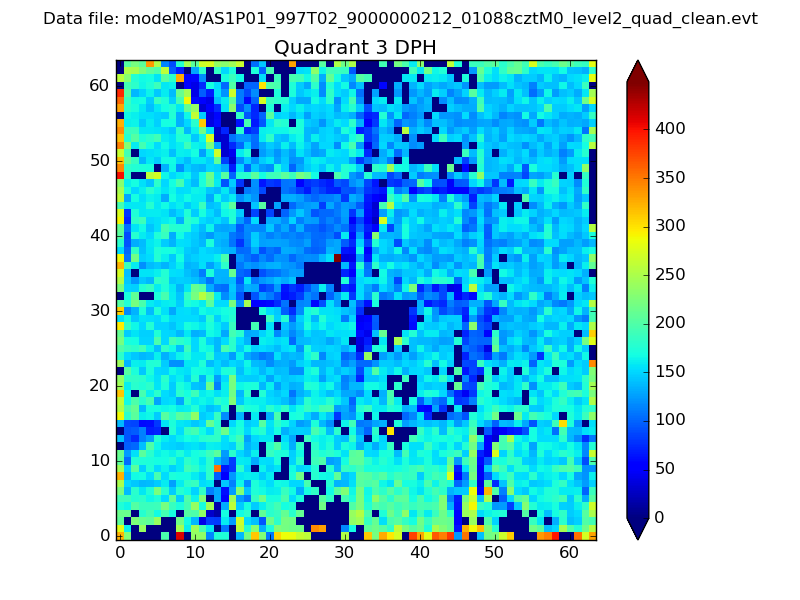 |
 |
Quadrant C |
| Plot type | Count rate plots | Images |
|---|---|---|
| Comparison with Poisson distribution Blue bars denote a histogram of data divided into 1 sec bins. Red curve is a Poisson curve with rate = median count rate of data. |
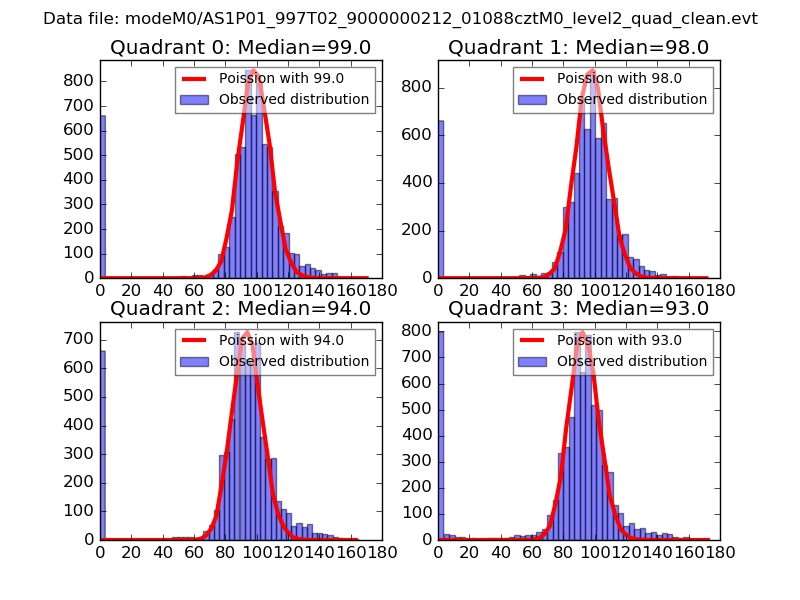 |
 |
| Quadrant-wise count rates Data is divided into 100 sec bins |
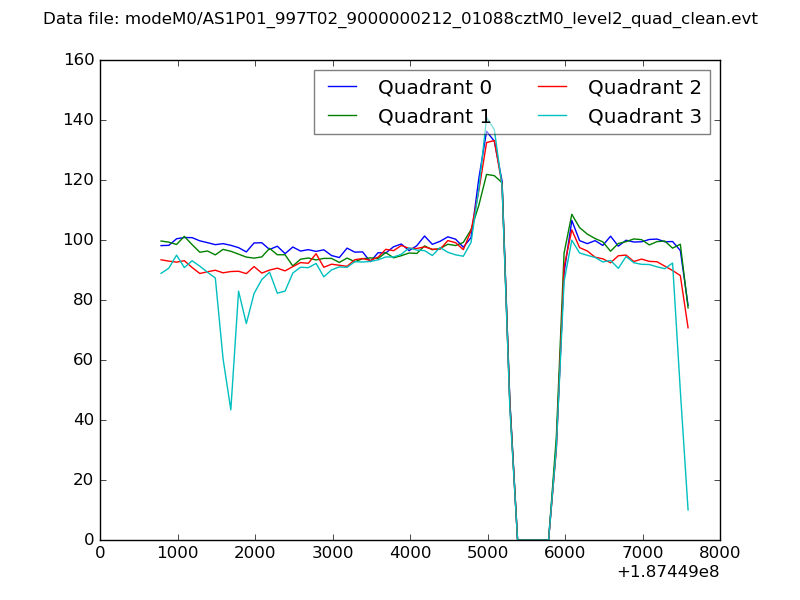 |
|
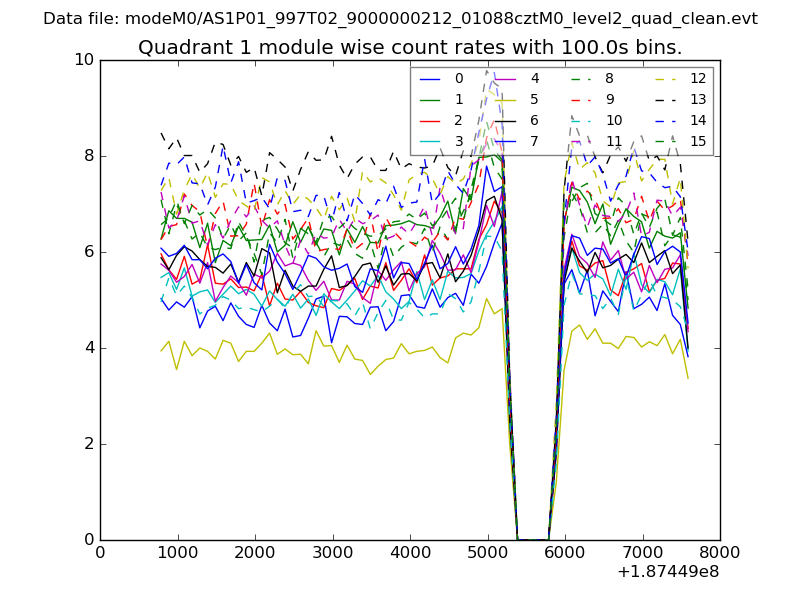
| Module-wise count rates for Quadrant A Data is divided into 100 sec bins |
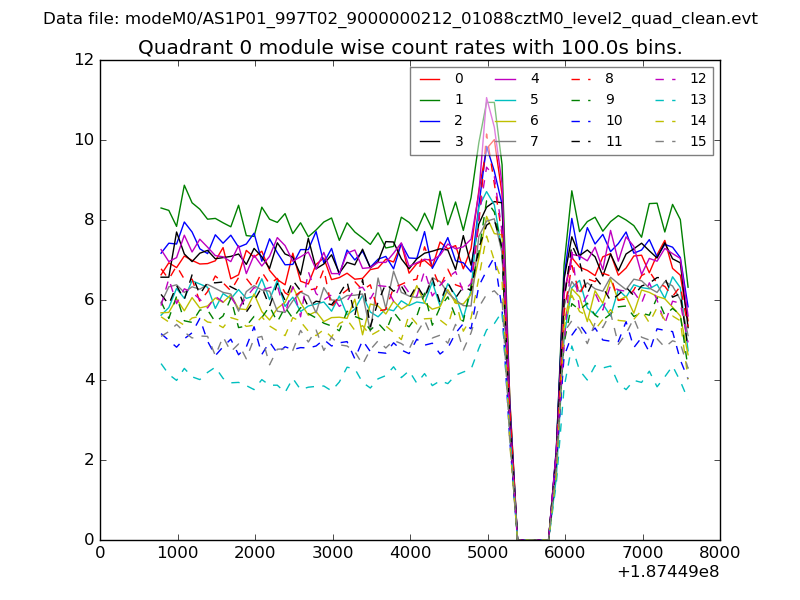 |
 |
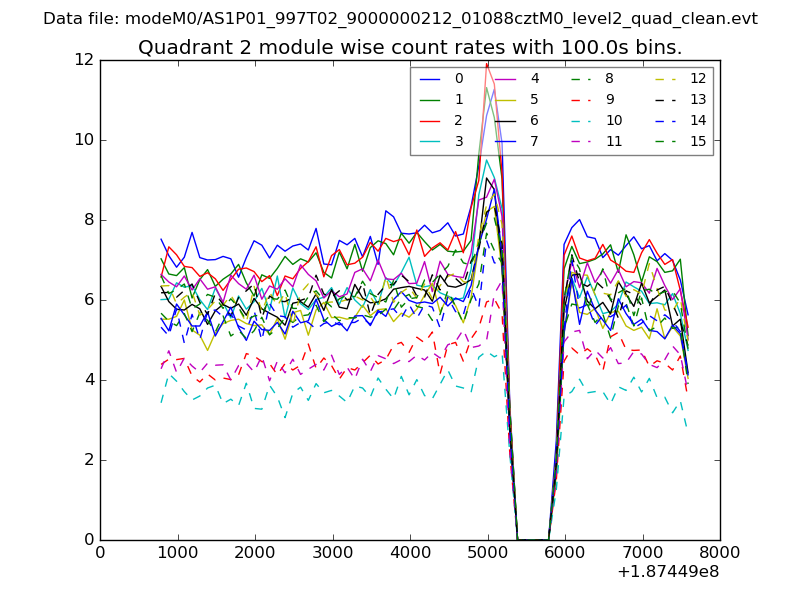
| Module-wise count rates for Quadrant B Data is divided into 100 sec bins |
 |
 |
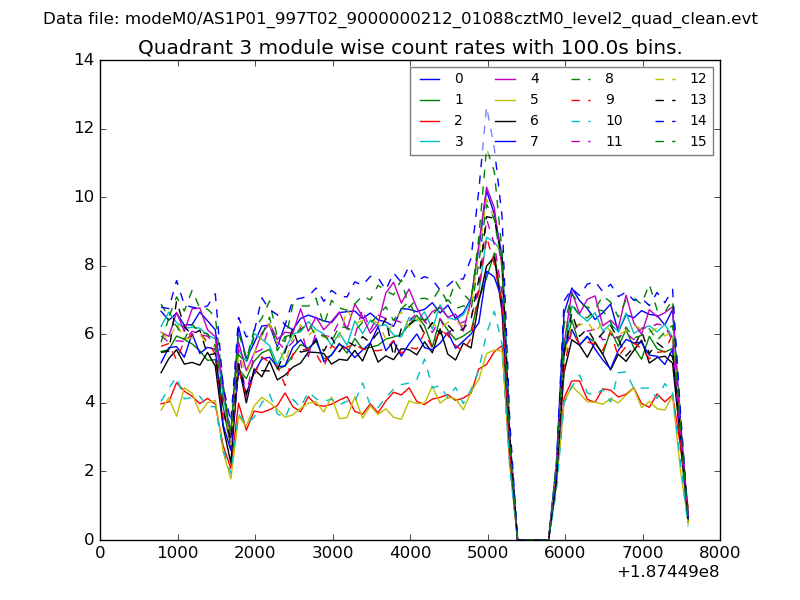
| Module-wise count rates for Quadrant C Data is divided into 100 sec bins |
 |
 |
| Module-wise count rates for Quadrant D Data is divided into 100 sec bins |
 |
 |
| Parameter | Plot |
|---|---|
| CZT HV Monitor | 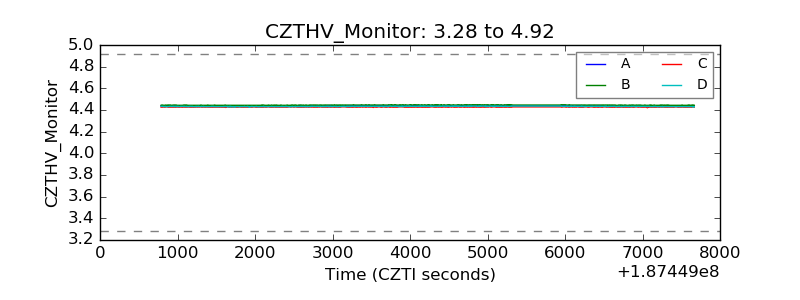 |
| D_VDD | 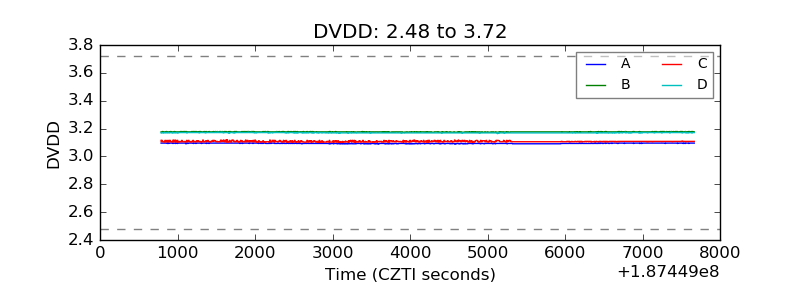 |
| Temperature 1 | 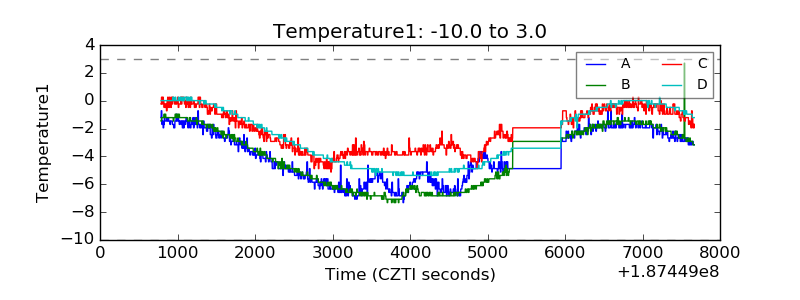 |
| Veto HV Monitor | 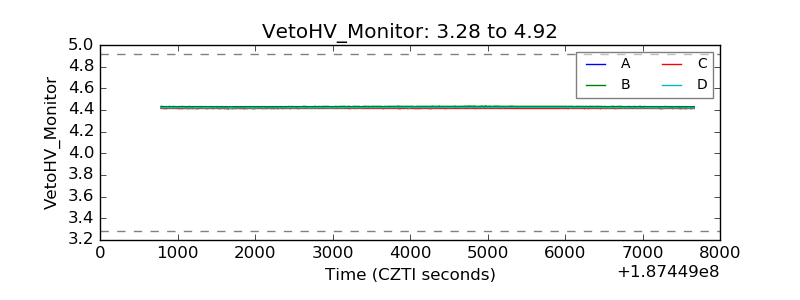 |
| Veto LLD | 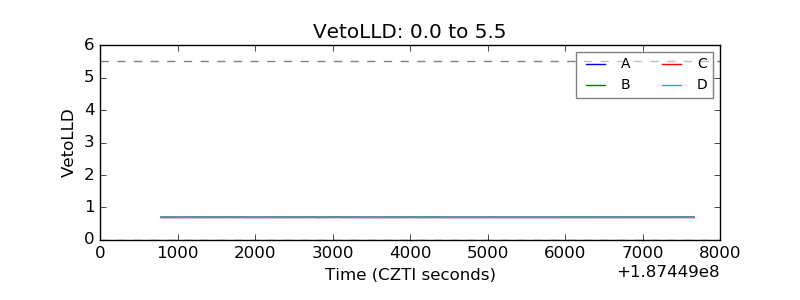 |
| Alpha Counter | 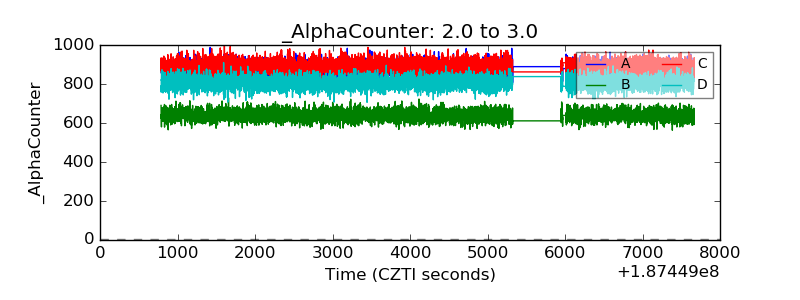 |
| _CPM_Rate | 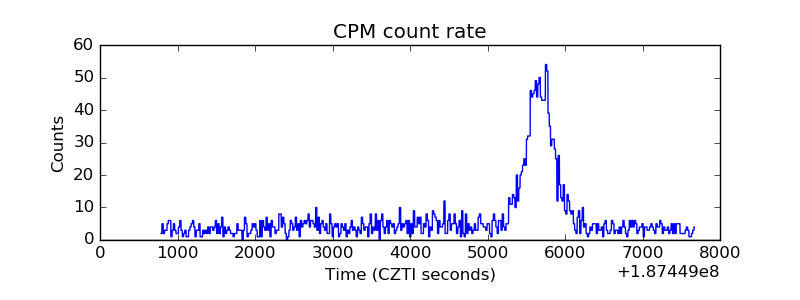 |
| CZT Counter | 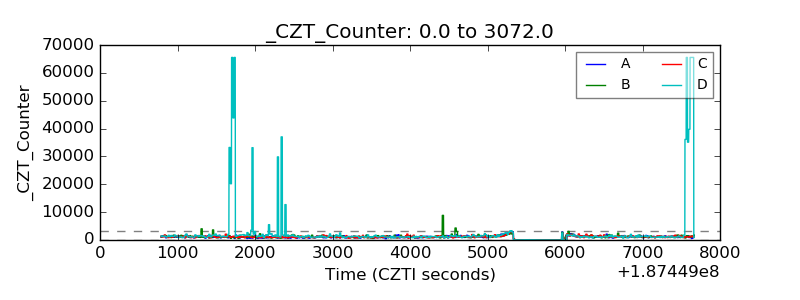 |
| +2.5 Volts monitor |  |
| +5 Volts monitor |  |
| _ROLL_ROT | 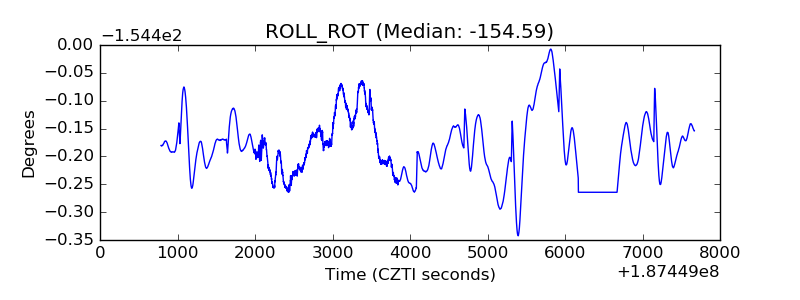 |
| _Roll_DEC | 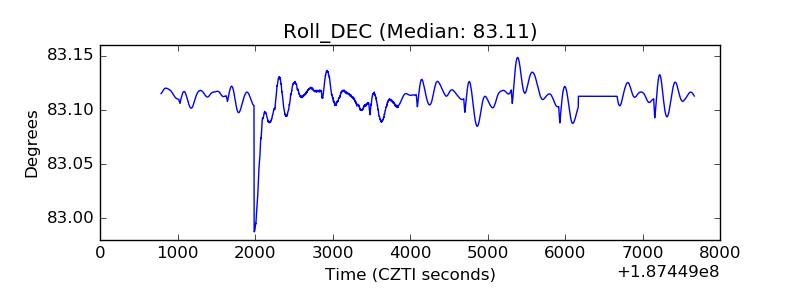 |
| _Roll_RA | 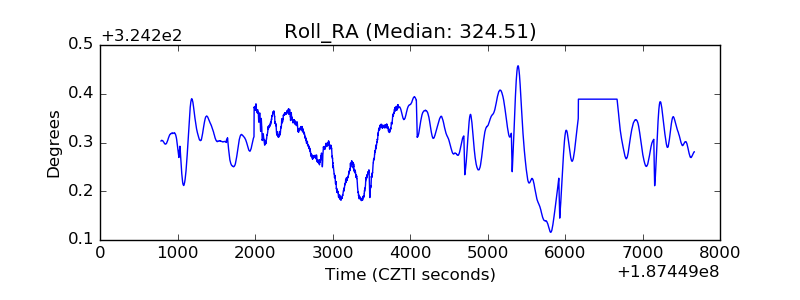 |
| Veto Counter | 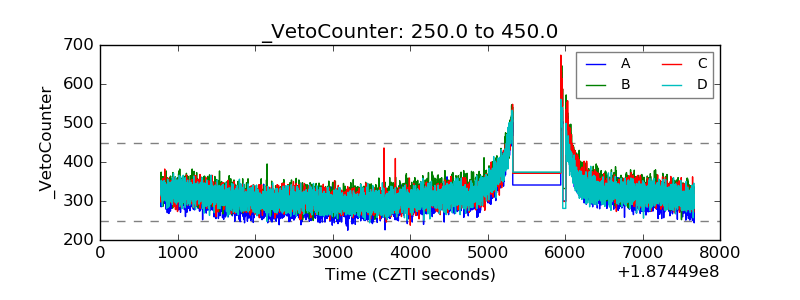 |