| Param | Original file | Final file |
|---|---|---|
| Filename | modeM0/AS1P01_997T02_9000000212_01089cztM0_level2.evt | modeM0/AS1P01_997T02_9000000212_01089cztM0_level2_quad_clean.evt |
| Size (bytes) | 1,180,509,120 | 103,000,320 |
| Size | 1.1 GB | 98.2 MB |
| Events in quadrant A | 10,000,994 | 656,816 |
| Events in quadrant B | 8,722,997 | 681,016 |
| Events in quadrant C | 8,396,255 | 660,041 |
| Events in quadrant D | 8,171,540 | 637,160 |
| Mode M9 | |||
|---|---|---|---|
| Quadrant | BADHDUFLAG | Total packets | Discarded packets |
| A | 0 | 3 | 0 |
| B | 0 | 3 | 0 |
| C | 0 | 3 | 0 |
| D | 0 | 3 | 0 |
| Mode M0 | |||
|---|---|---|---|
| Quadrant | BADHDUFLAG | Total packets | Discarded packets |
| A | 0 | 34753 | 2 |
| B | 0 | 30846 | 1 |
| C | 0 | 29874 | 1 |
| D | 0 | 29246 | 1 |
| Mode SS | |||
|---|---|---|---|
| Quadrant | BADHDUFLAG | Total packets | Discarded packets |
| A | 0 | 140 | 0 |
| B | 0 | 140 | 0 |
| C | 0 | 140 | 0 |
| D | 0 | 140 | 0 |
| Quadrant | Total seconds | Saturated seconds | Saturation percentage |
|---|---|---|---|
| A | 6951 | 556 | 7.998849% |
| B | 6951 | 30 | 0.431593% |
| C | 6951 | 13 | 0.187023% |
| D | 6951 | 236 | 3.395195% |
Noise dominated data is calculated using 1-second bins in cleaned event files. If a bin has >2000 counts, and if more than 50% of those come from <1% of pixels, then it is considered to be noise-dominated and hence unusable.
| Quadrant | # 1 sec bins | Bins with >0 counts | Bins with >2000 counts | High rate bins dominated by noise | Noise dominated (total time) | Noise dominated (detector-on time) | Marked lightcurve |
|---|---|---|---|---|---|---|---|
| A | 7201 | 6951 | 1202 | 1202 | 16.69% | 17.29% | 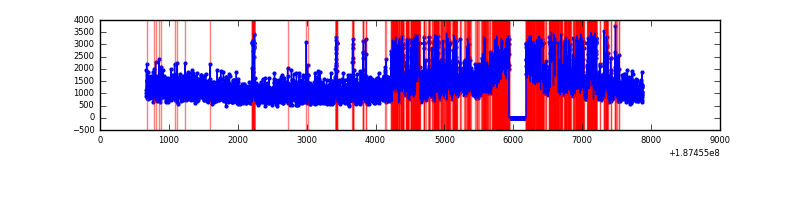 |
| B | 7201 | 6952 | 383 | 383 | 5.32% | 5.51% | 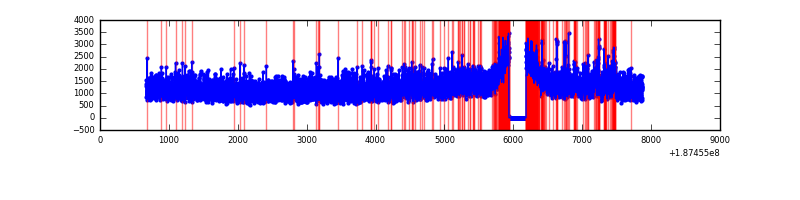 |
| C | 7201 | 6951 | 284 | 284 | 3.94% | 4.09% | 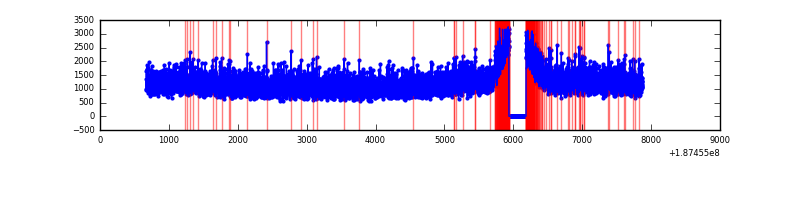 |
| D | 7201 | 6952 | 471 | 471 | 6.54% | 6.78% | 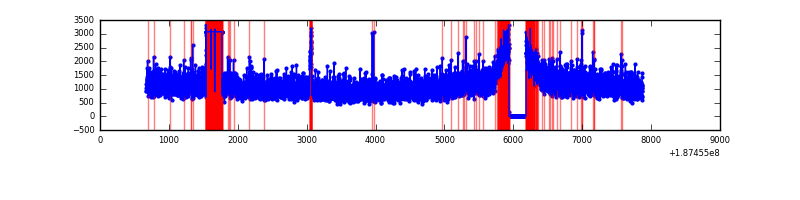 |
Top three noisy pixels from each quadrant. If the there are fewer than three noisy pixels in the level2.evt file, extra rows are filled as -1
| Pixel properties | Quadrant properties | ||||||
|---|---|---|---|---|---|---|---|
| Quadrant | DetID | PixID | Counts | Sigma | Mean | Median | Sigma |
| A | 4 | 32 | 2059062 | 4157.36 | 2064 | 2076 | 494.8 |
| A | 15 | 233 | 16662 | 29.48 | 2064 | 2076 | 494.8 |
| A | 11 | 79 | 9183 | 14.36 | 2064 | 2076 | 494.8 |
| B | 14 | 53 | 97543 | 182.08 | 2220 | 2226 | 523.5 |
| B | 5 | 249 | 43410 | 78.67 | 2220 | 2226 | 523.5 |
| B | 15 | 22 | 37830 | 68.01 | 2220 | 2226 | 523.5 |
| C | 15 | 241 | 331936 | 580.04 | 2043 | 2116 | 568.6 |
| C | 3 | 79 | 46284 | 77.68 | 2043 | 2116 | 568.6 |
| C | 3 | 111 | 35041 | 57.9 | 2043 | 2116 | 568.6 |
| D | 12 | 22 | 117832 | 183.51 | 2041 | 2045 | 631.0 |
| D | 2 | 16 | 76760 | 118.41 | 2041 | 2045 | 631.0 |
| D | 10 | 125 | 26177 | 38.25 | 2041 | 2045 | 631.0 |
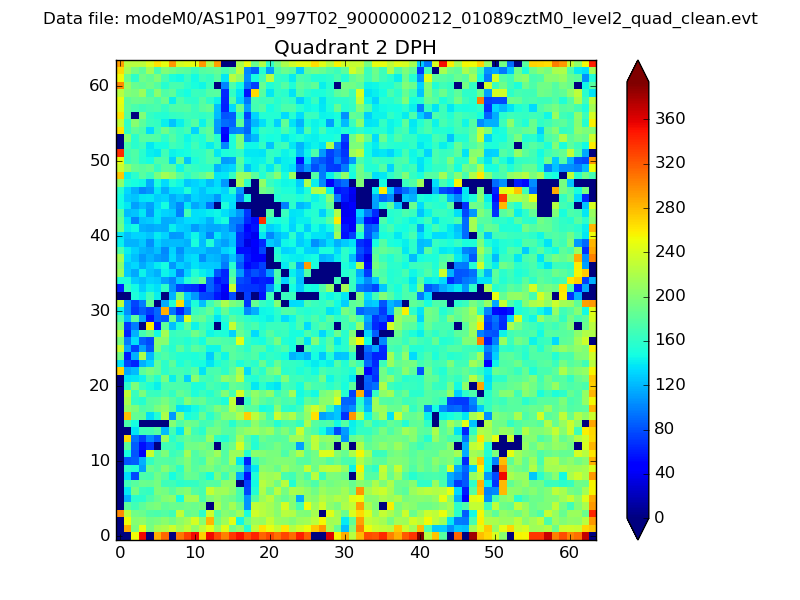
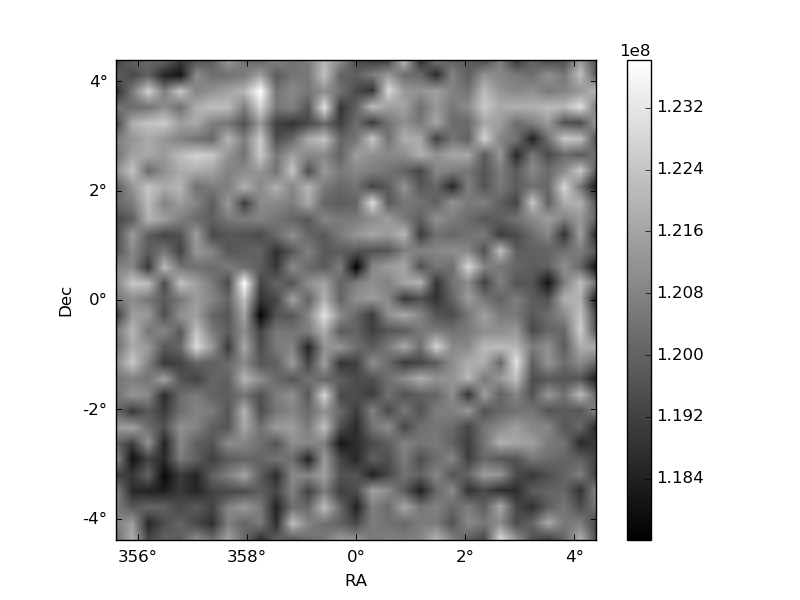
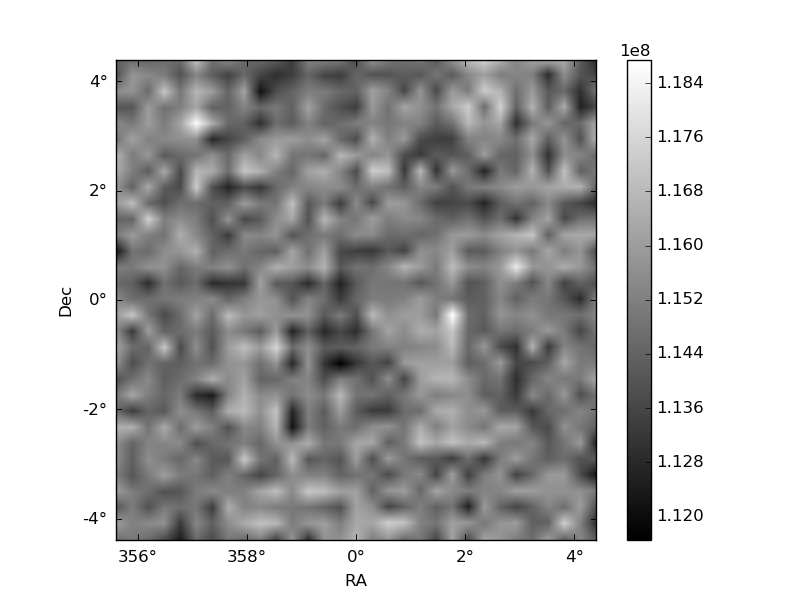
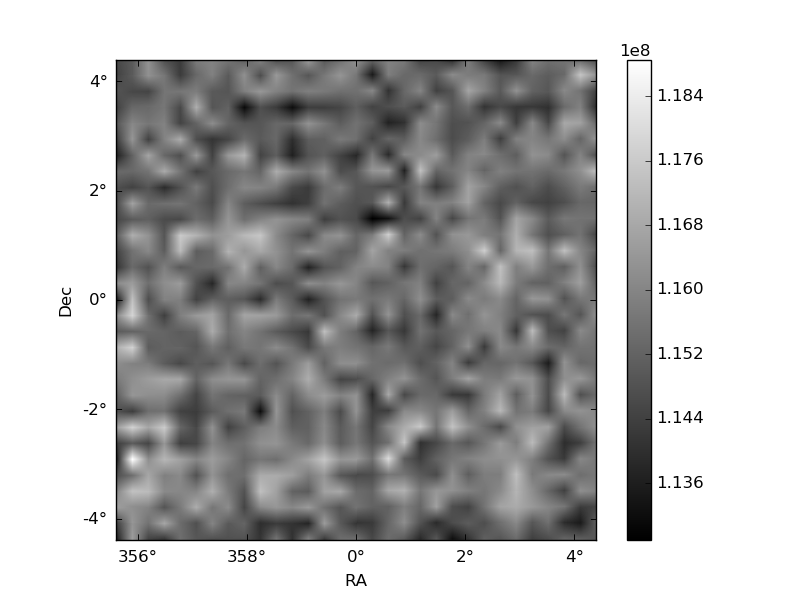
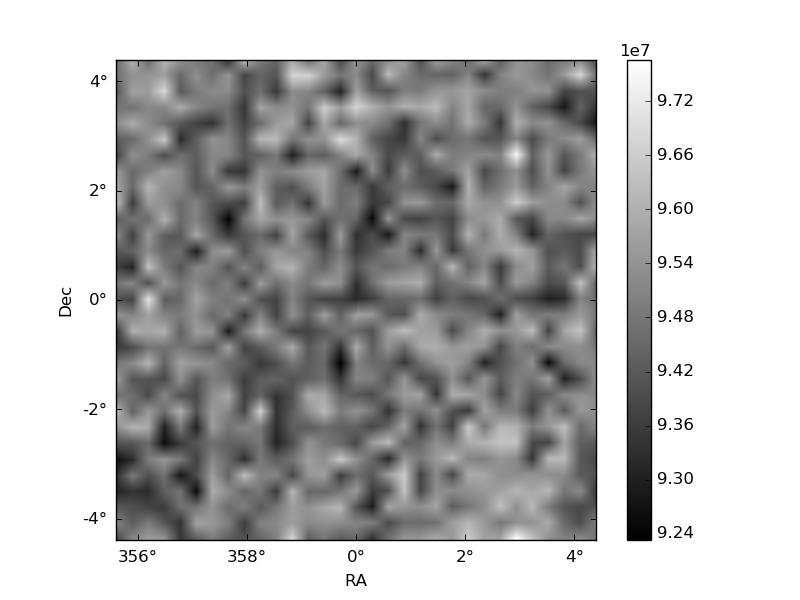
Histogram calculated using DETX and DETY for each event in the final _common_clean file
| Quadrant A | 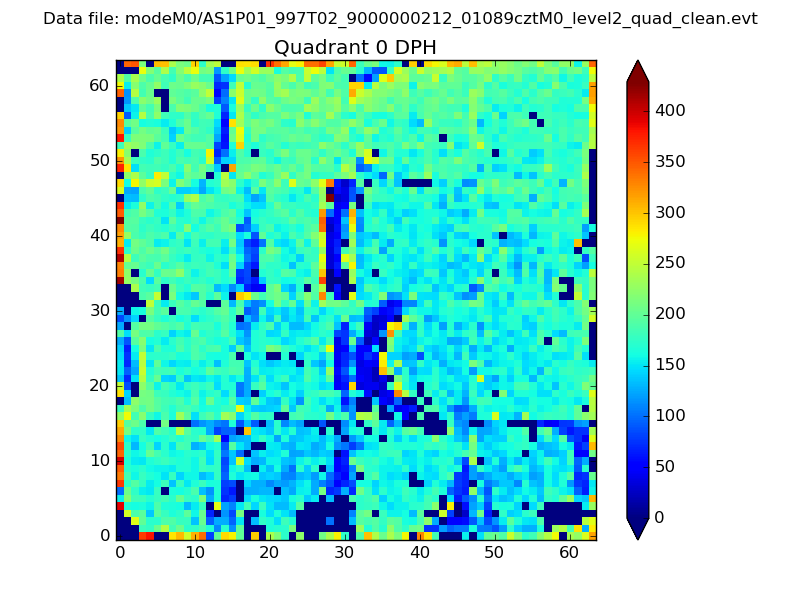 |
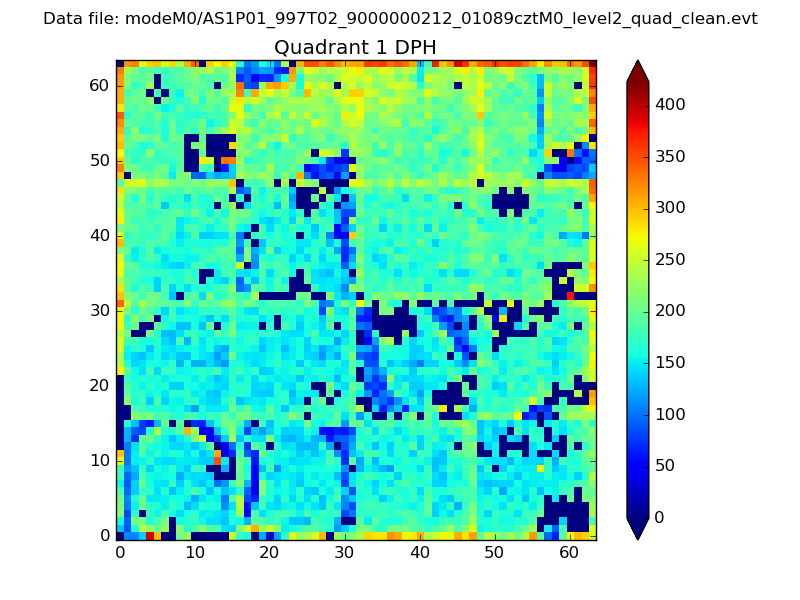 |
Quadrant B |
|---|---|---|---|
| Quadrant D | 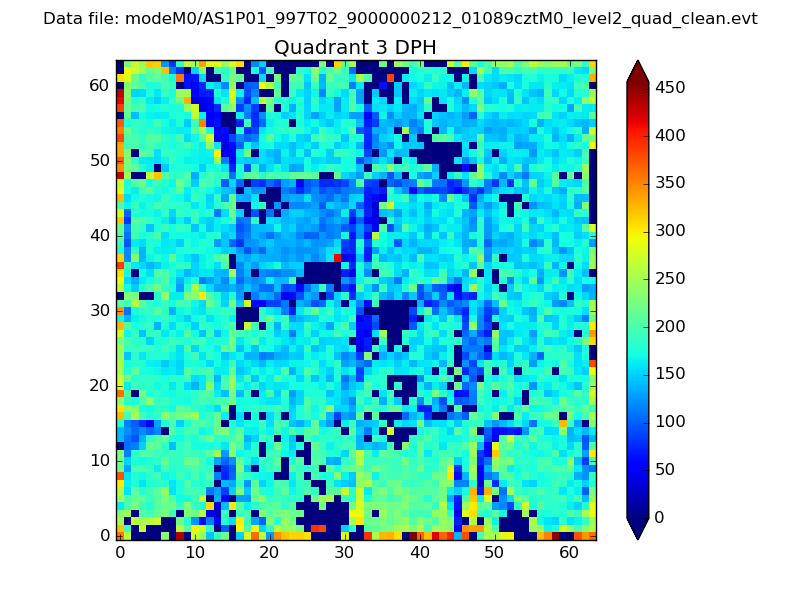 |
 |
Quadrant C |
| Plot type | Count rate plots | Images |
|---|---|---|
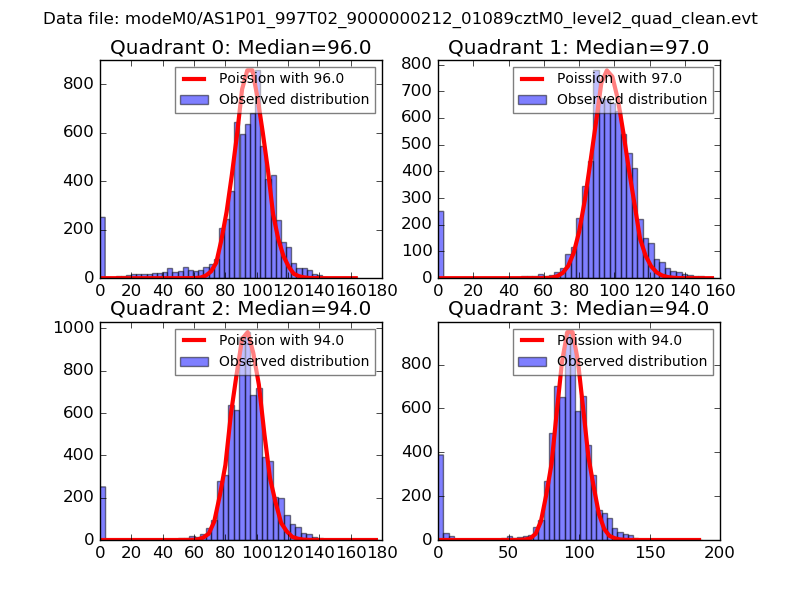
| Comparison with Poisson distribution Blue bars denote a histogram of data divided into 1 sec bins. Red curve is a Poisson curve with rate = median count rate of data. |
 |
 |
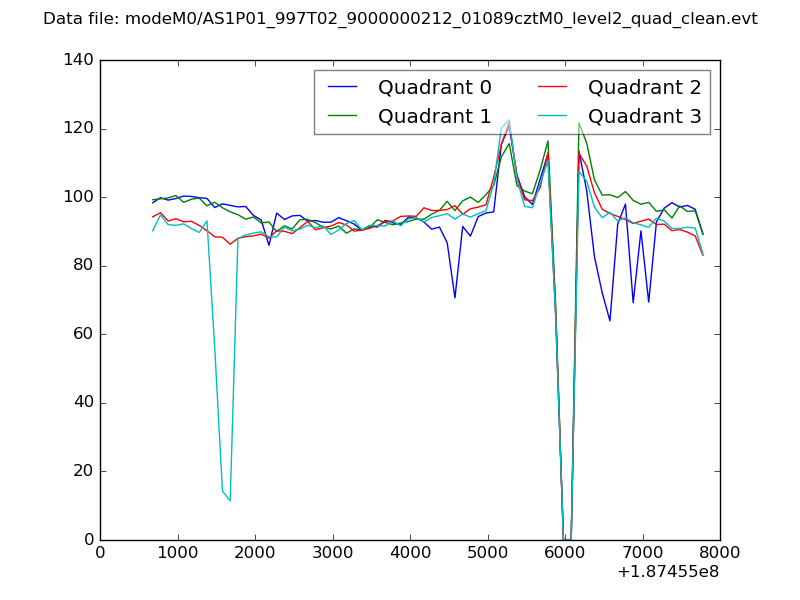
| Quadrant-wise count rates Data is divided into 100 sec bins |
 |
|
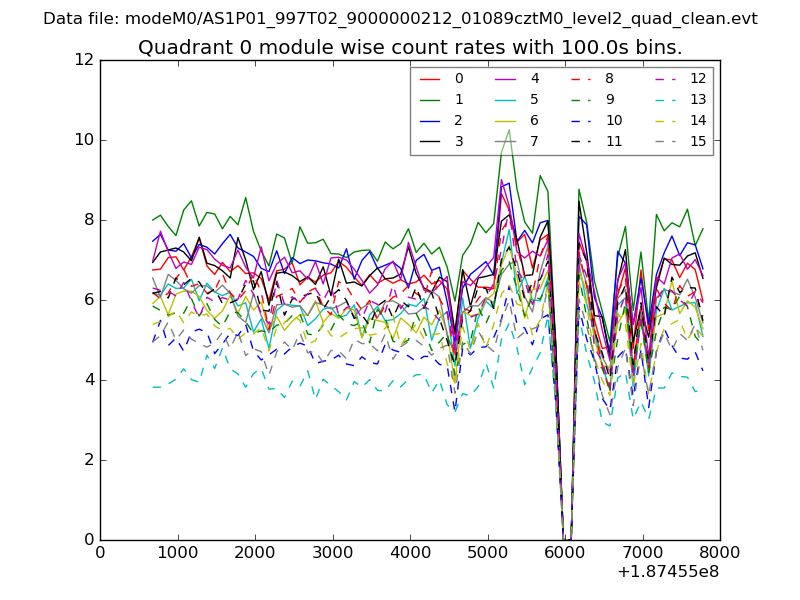
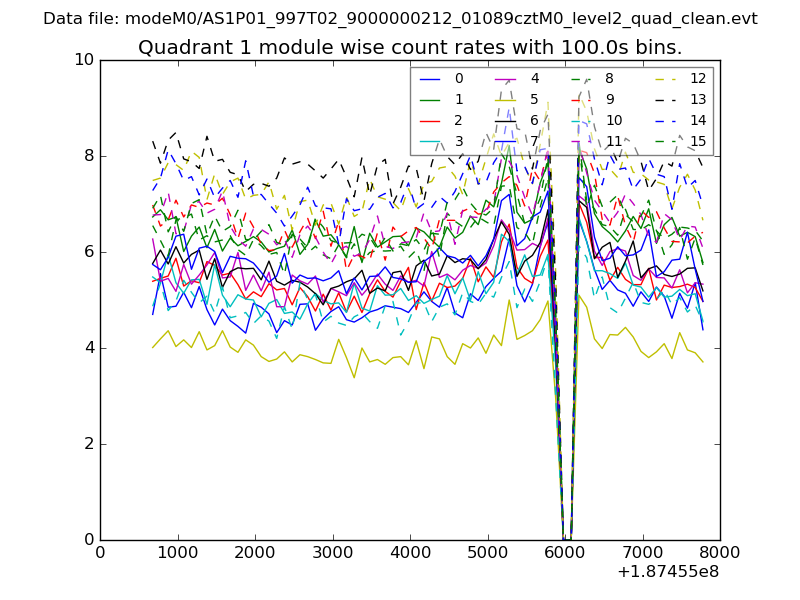
| Module-wise count rates for Quadrant A Data is divided into 100 sec bins |
 |
 |
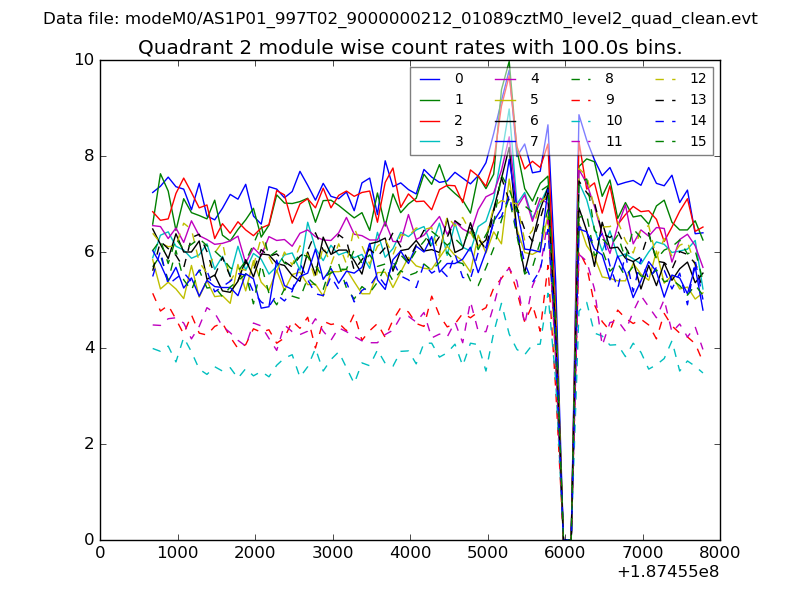
| Module-wise count rates for Quadrant B Data is divided into 100 sec bins |
 |
 |
| Module-wise count rates for Quadrant C Data is divided into 100 sec bins |
 |
 |
| Module-wise count rates for Quadrant D Data is divided into 100 sec bins |
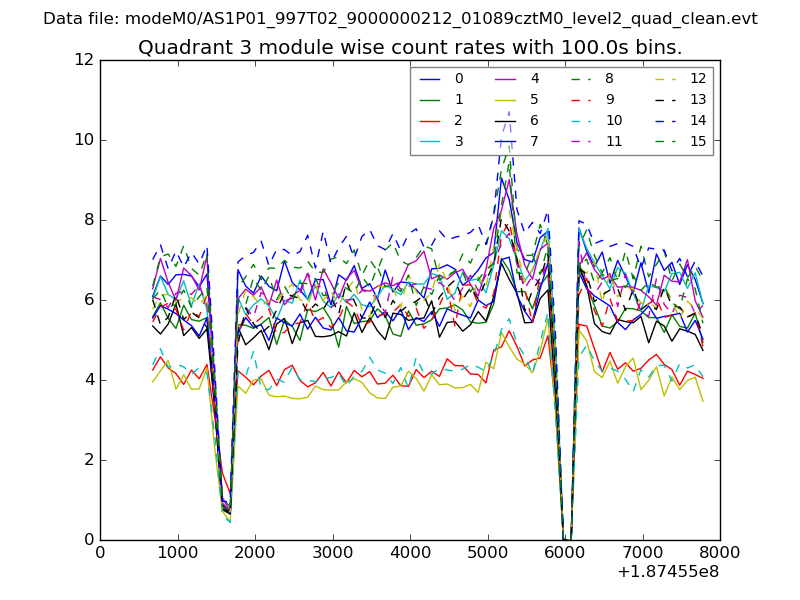 |
 |
| Parameter | Plot |
|---|---|
| CZT HV Monitor | 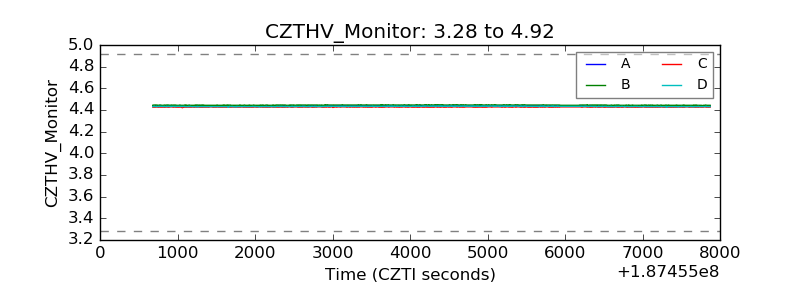 |
| D_VDD | 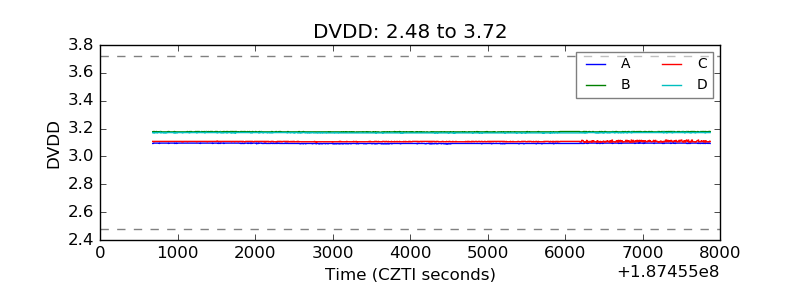 |
| Temperature 1 | 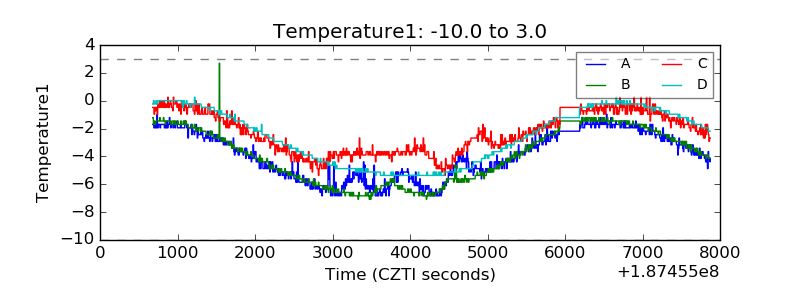 |
| Veto HV Monitor | 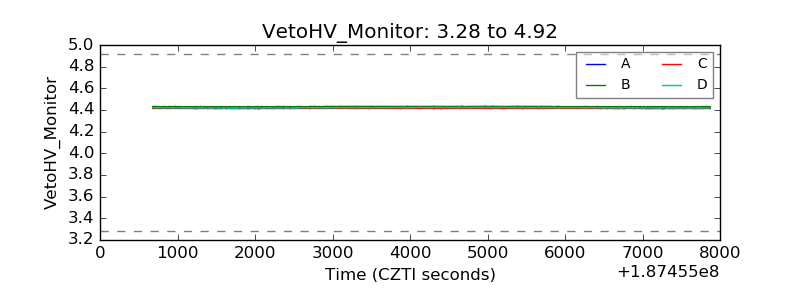 |
| Veto LLD | 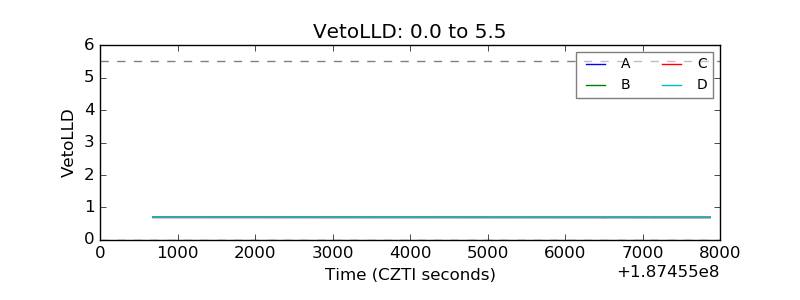 |
| Alpha Counter | 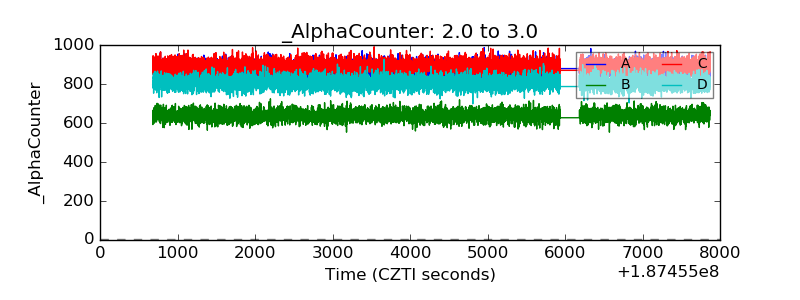 |
| _CPM_Rate | 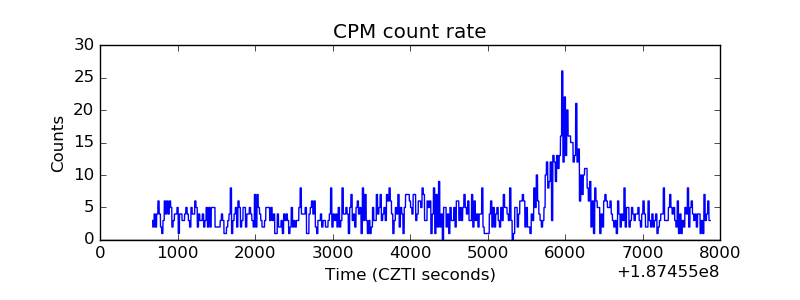 |
| CZT Counter | 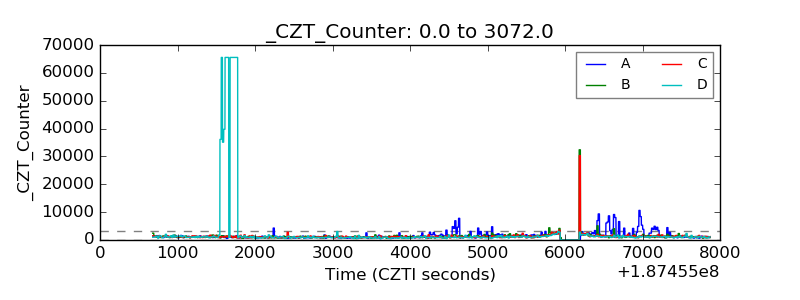 |
| +2.5 Volts monitor |  |
| +5 Volts monitor | 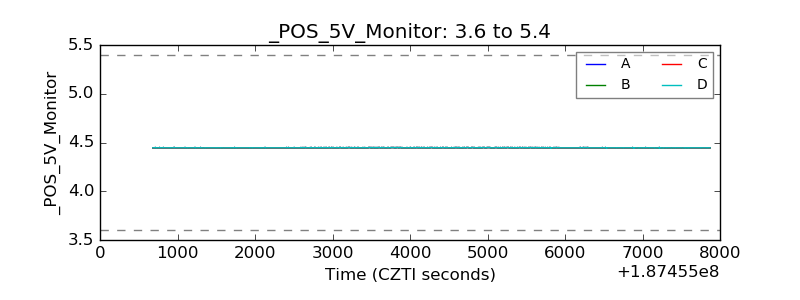 |
| _ROLL_ROT | 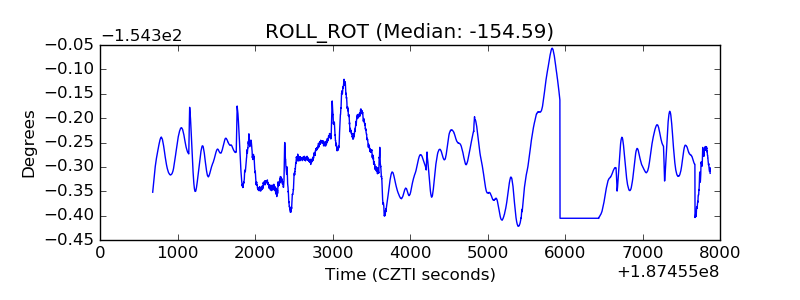 |
| _Roll_DEC | 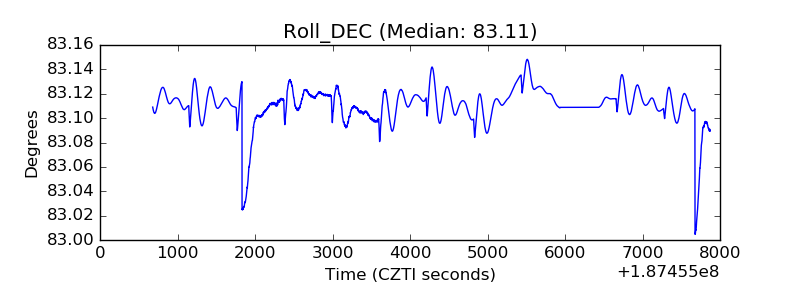 |
| _Roll_RA | 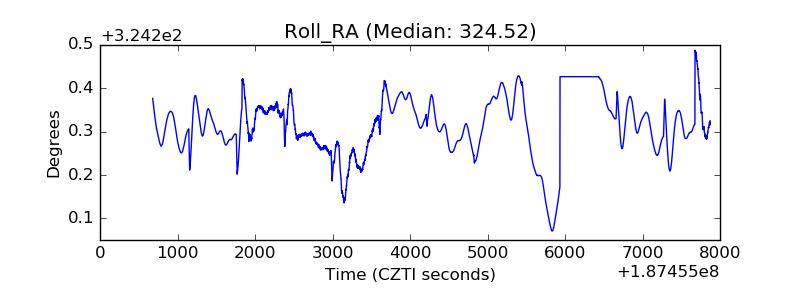 |
| Veto Counter | 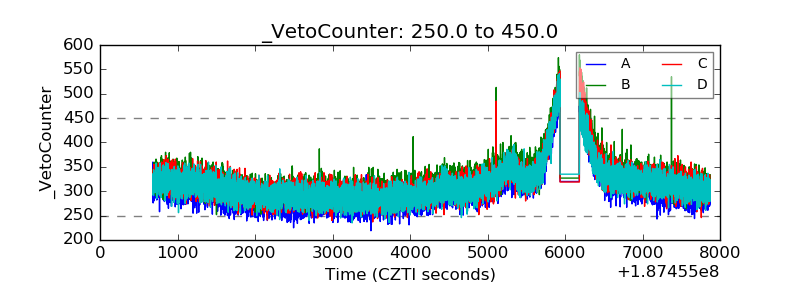 |