| Param | Original file | Final file |
|---|---|---|
| Filename | modeM0/AS1P01_997T02_9000000212_01090cztM0_level2.evt | modeM0/AS1P01_997T02_9000000212_01090cztM0_level2_quad_clean.evt |
| Size (bytes) | 1,229,313,600 | 112,029,120 |
| Size | 1.1 GB | 106.8 MB |
| Events in quadrant A | 9,900,151 | 720,713 |
| Events in quadrant B | 9,499,175 | 731,415 |
| Events in quadrant C | 9,165,803 | 710,885 |
| Events in quadrant D | 8,166,752 | 706,490 |
| Mode M9 | |||
|---|---|---|---|
| Quadrant | BADHDUFLAG | Total packets | Discarded packets |
| A | 0 | 1 | 0 |
| B | 0 | 1 | 0 |
| C | 0 | 1 | 0 |
| D | 0 | 1 | 0 |
| Mode M0 | |||
|---|---|---|---|
| Quadrant | BADHDUFLAG | Total packets | Discarded packets |
| A | 0 | 34838 | 3 |
| B | 0 | 33549 | 2 |
| C | 0 | 32602 | 2 |
| D | 0 | 29626 | 2 |
| Mode SS | |||
|---|---|---|---|
| Quadrant | BADHDUFLAG | Total packets | Discarded packets |
| A | 0 | 154 | 0 |
| B | 0 | 154 | 0 |
| C | 0 | 154 | 0 |
| D | 0 | 154 | 0 |
| Quadrant | Total seconds | Saturated seconds | Saturation percentage |
|---|---|---|---|
| A | 7515 | 319 | 4.244844% |
| B | 7515 | 21 | 0.279441% |
| C | 7515 | 8 | 0.106454% |
| D | 7515 | 9 | 0.119760% |
Noise dominated data is calculated using 1-second bins in cleaned event files. If a bin has >2000 counts, and if more than 50% of those come from <1% of pixels, then it is considered to be noise-dominated and hence unusable.
| Quadrant | # 1 sec bins | Bins with >0 counts | Bins with >2000 counts | High rate bins dominated by noise | Noise dominated (total time) | Noise dominated (detector-on time) | Marked lightcurve |
|---|---|---|---|---|---|---|---|
| A | 7685 | 7517 | 703 | 703 | 9.15% | 9.35% | 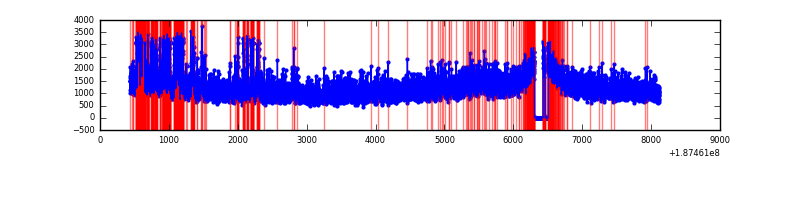 |
| B | 7685 | 7517 | 372 | 372 | 4.84% | 4.95% | 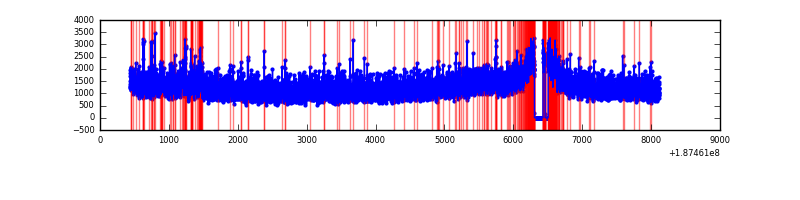 |
| C | 7685 | 7517 | 263 | 263 | 3.42% | 3.50% | 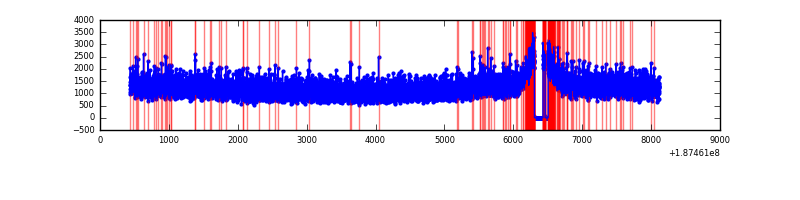 |
| D | 7685 | 7517 | 170 | 170 | 2.21% | 2.26% | 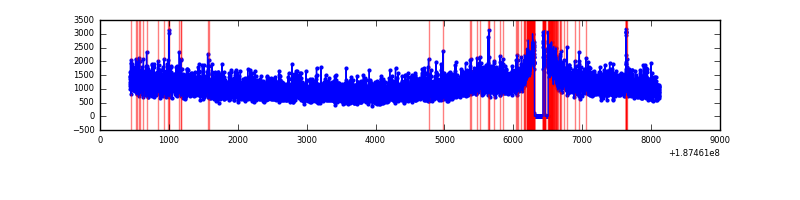 |
Top three noisy pixels from each quadrant. If the there are fewer than three noisy pixels in the level2.evt file, extra rows are filled as -1
| Pixel properties | Quadrant properties | ||||||
|---|---|---|---|---|---|---|---|
| Quadrant | DetID | PixID | Counts | Sigma | Mean | Median | Sigma |
| A | 4 | 32 | 1156385 | 2123.57 | 2274 | 2286 | 543.5 |
| A | 15 | 233 | 12583 | 18.95 | 2274 | 2286 | 543.5 |
| A | 11 | 79 | 11079 | 16.18 | 2274 | 2286 | 543.5 |
| B | 14 | 53 | 98499 | 169.19 | 2409 | 2417 | 567.9 |
| B | 15 | 22 | 63255 | 107.13 | 2409 | 2417 | 567.9 |
| B | 4 | 187 | 47304 | 79.04 | 2409 | 2417 | 567.9 |
| C | 15 | 241 | 361642 | 579.32 | 2224 | 2308 | 620.3 |
| C | 3 | 79 | 55677 | 86.04 | 2224 | 2308 | 620.3 |
| C | 3 | 111 | 43824 | 66.93 | 2224 | 2308 | 620.3 |
| D | 10 | 102 | 45843 | 65.87 | 2155 | 2236 | 662.0 |
| D | 10 | 125 | 28941 | 40.34 | 2155 | 2236 | 662.0 |
| D | 2 | 107 | 24126 | 33.07 | 2155 | 2236 | 662.0 |
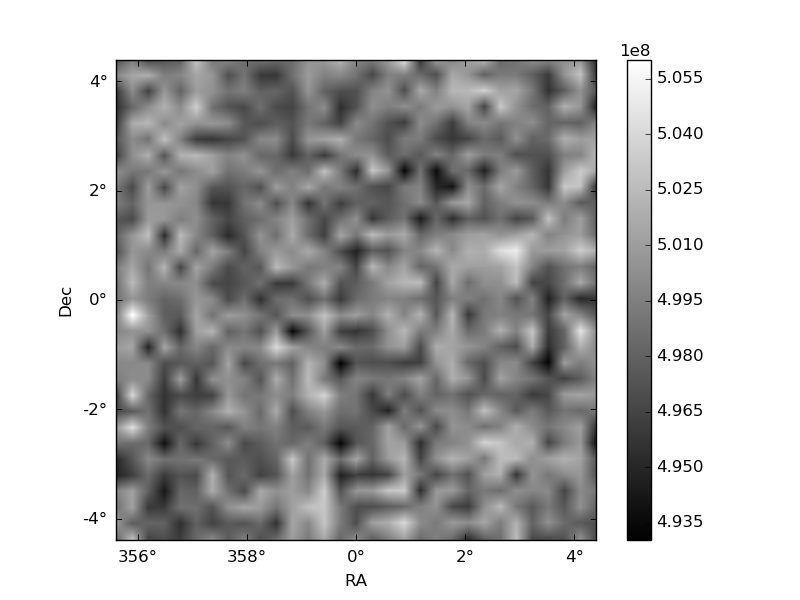
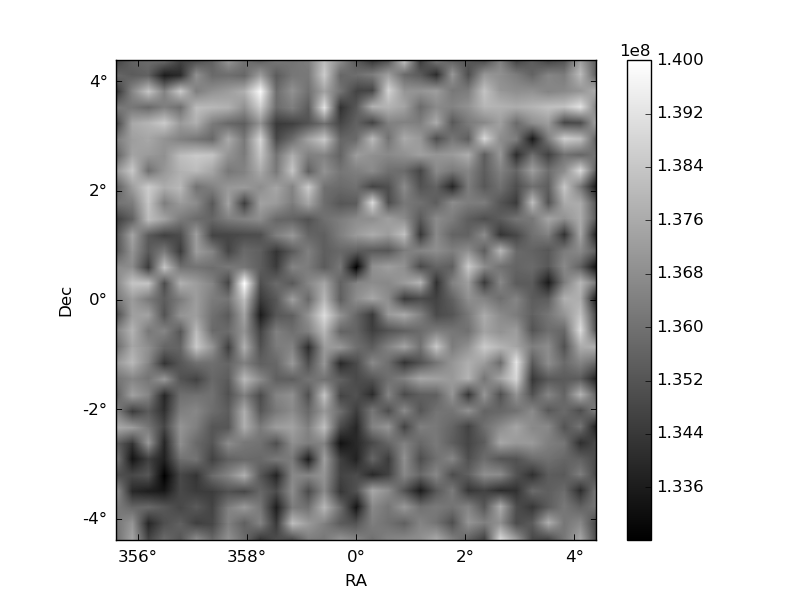
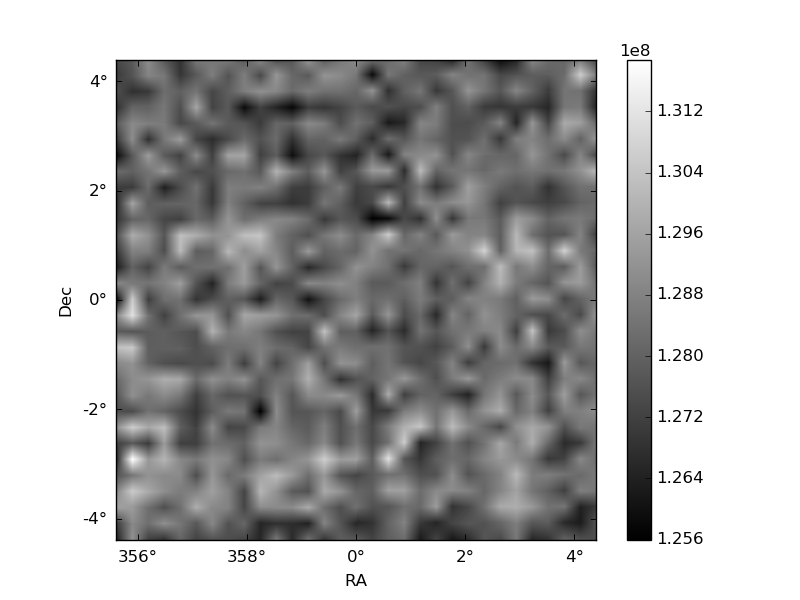
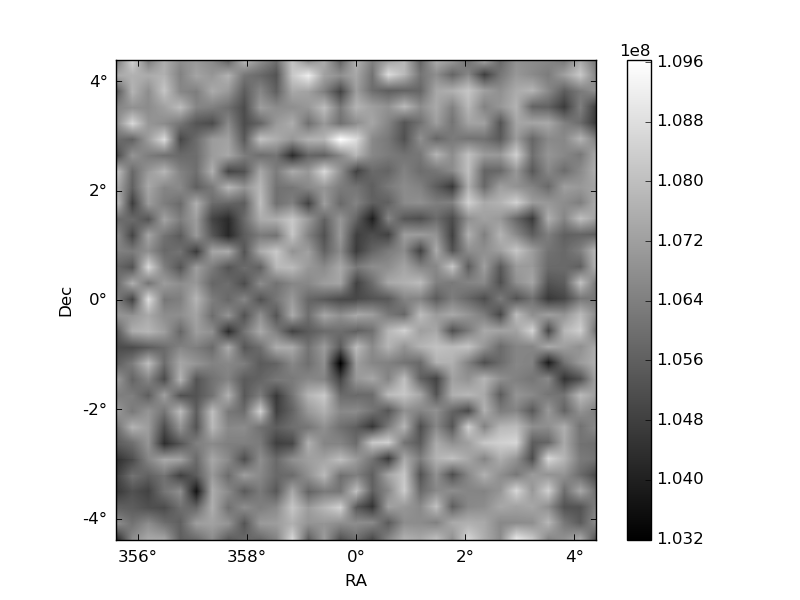
Histogram calculated using DETX and DETY for each event in the final _common_clean file
| Quadrant A | 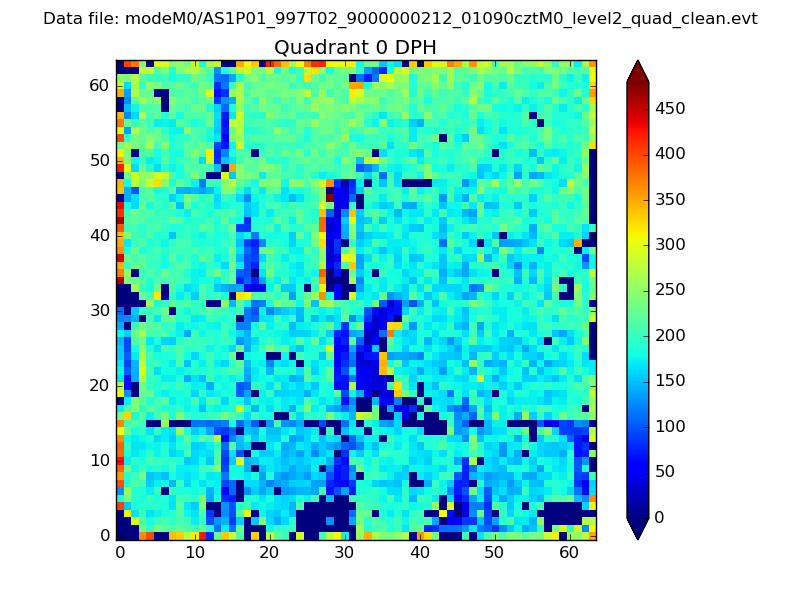 |
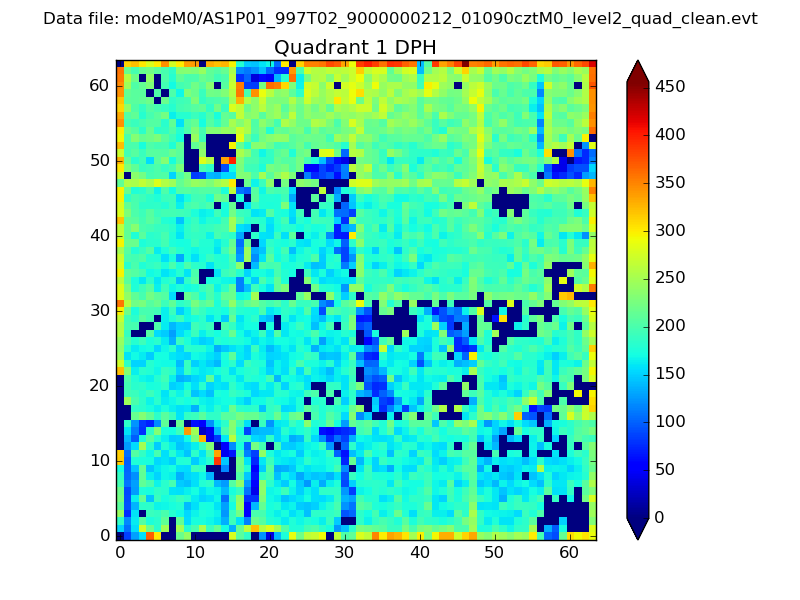 |
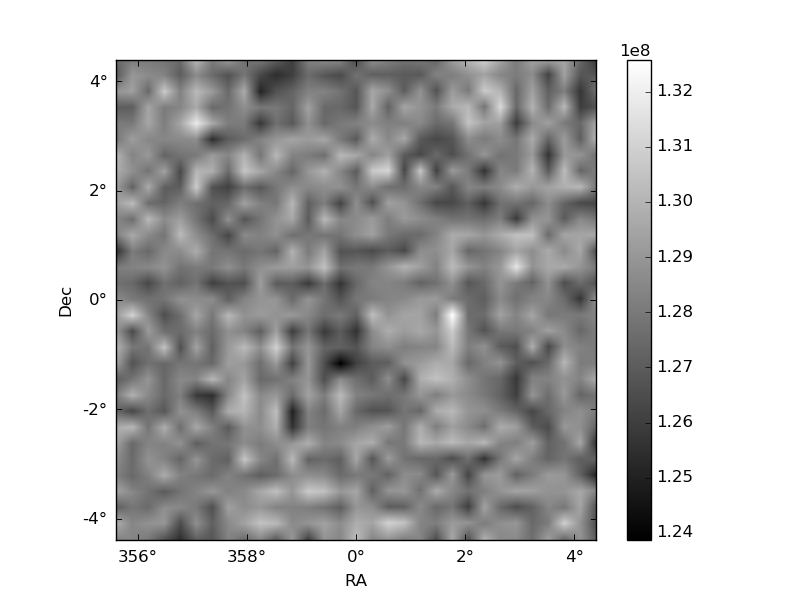
Quadrant B |
|---|---|---|---|
| Quadrant D | 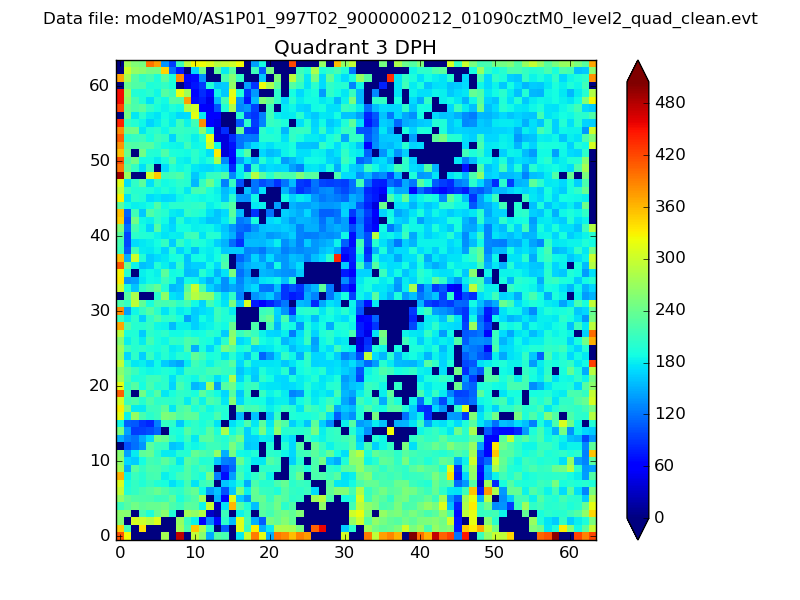 |
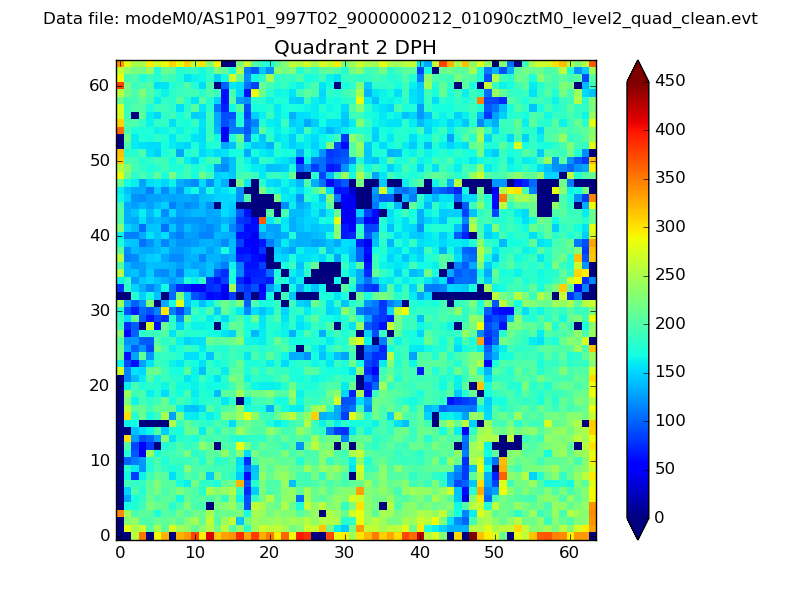 |
Quadrant C |
| Plot type | Count rate plots | Images |
|---|---|---|
| Comparison with Poisson distribution Blue bars denote a histogram of data divided into 1 sec bins. Red curve is a Poisson curve with rate = median count rate of data. |
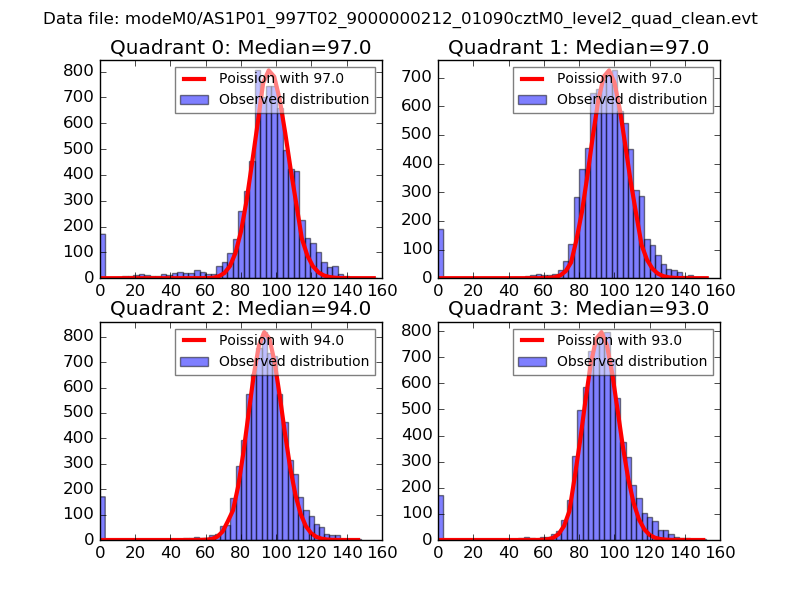 |
 |
| Quadrant-wise count rates Data is divided into 100 sec bins |
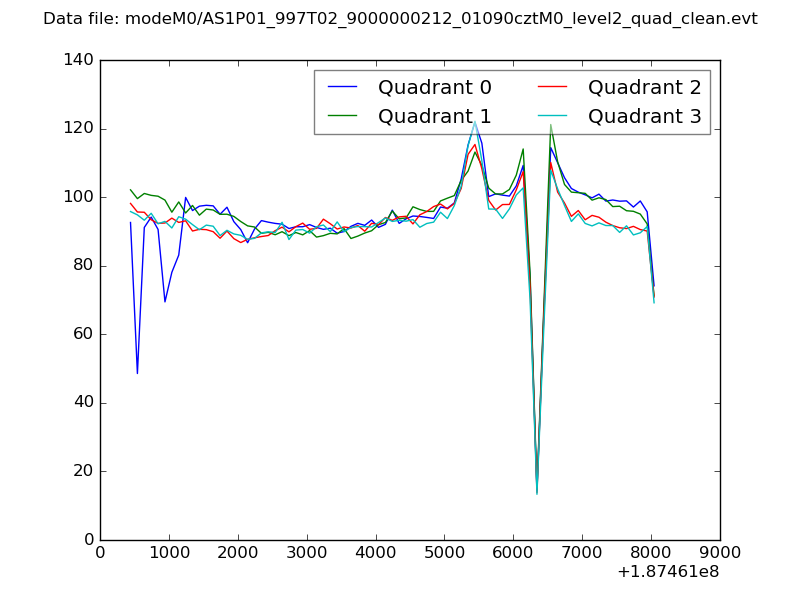 |
|
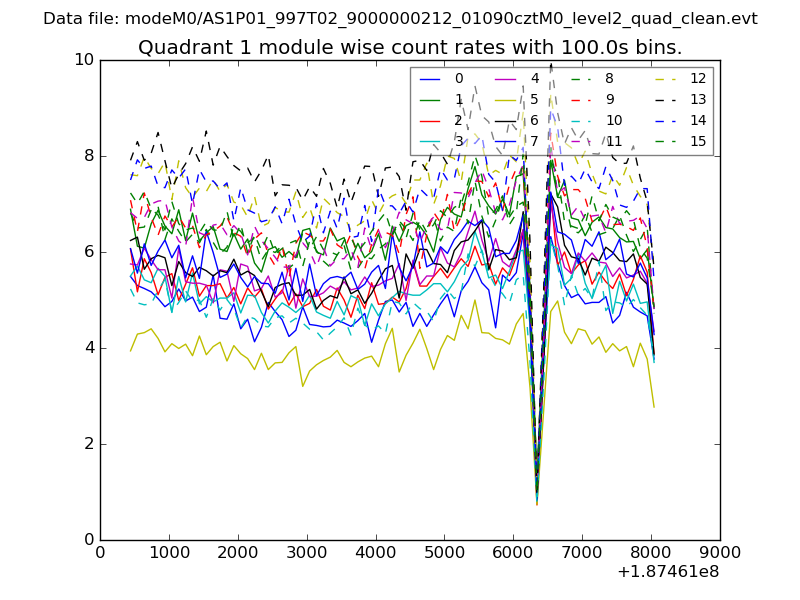
| Module-wise count rates for Quadrant A Data is divided into 100 sec bins |
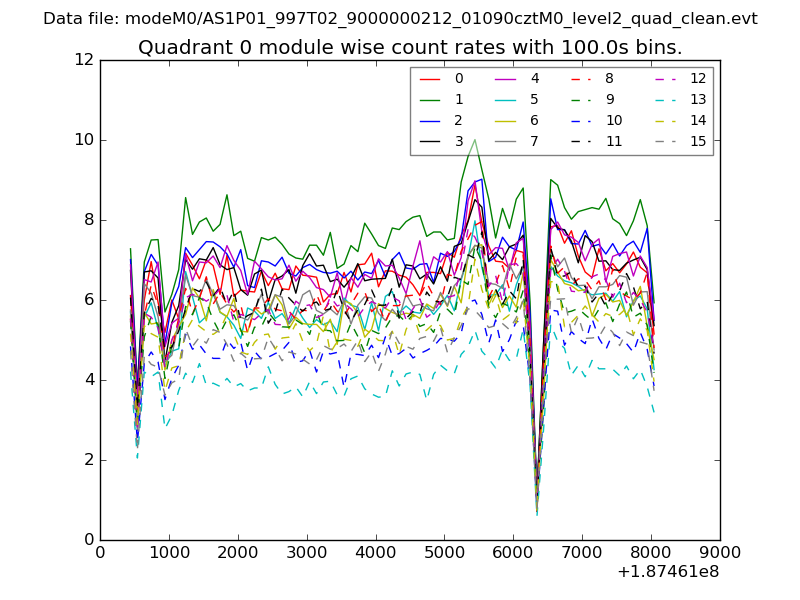 |
 |
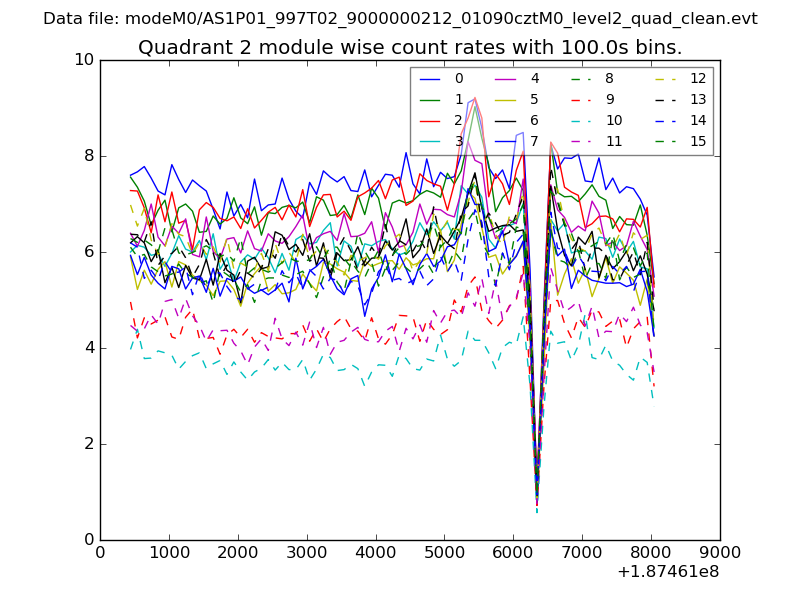
| Module-wise count rates for Quadrant B Data is divided into 100 sec bins |
 |
 |
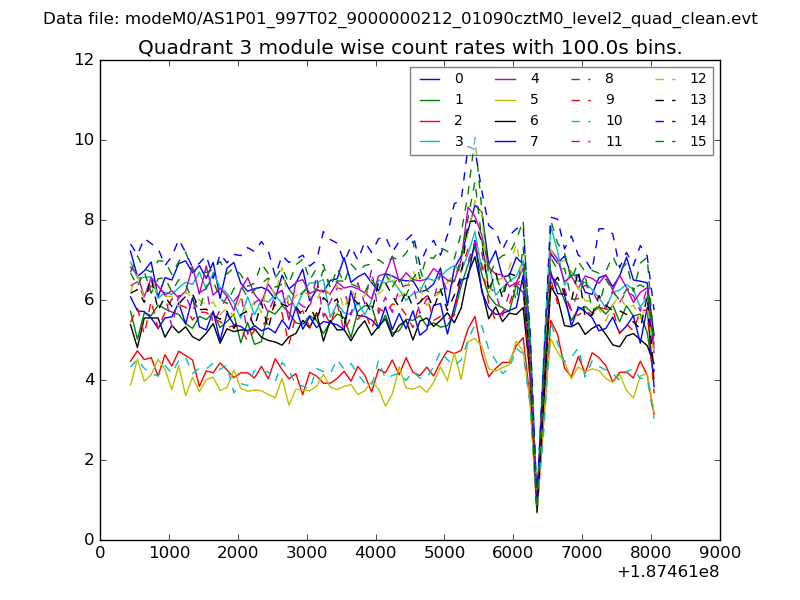
| Module-wise count rates for Quadrant C Data is divided into 100 sec bins |
 |
 |
| Module-wise count rates for Quadrant D Data is divided into 100 sec bins |
 |
 |
| Parameter | Plot |
|---|---|
| CZT HV Monitor | 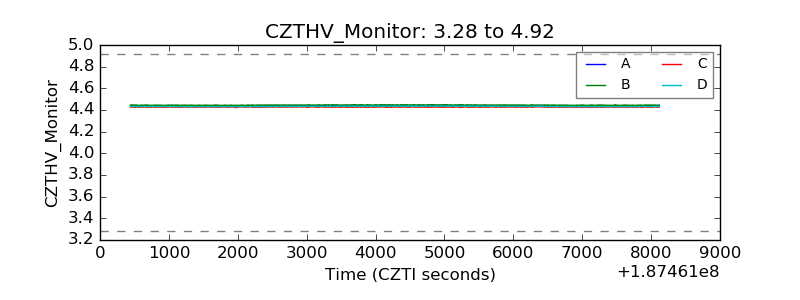 |
| D_VDD | 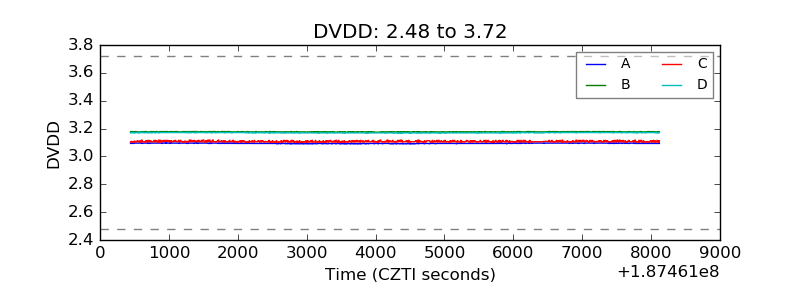 |
| Temperature 1 | 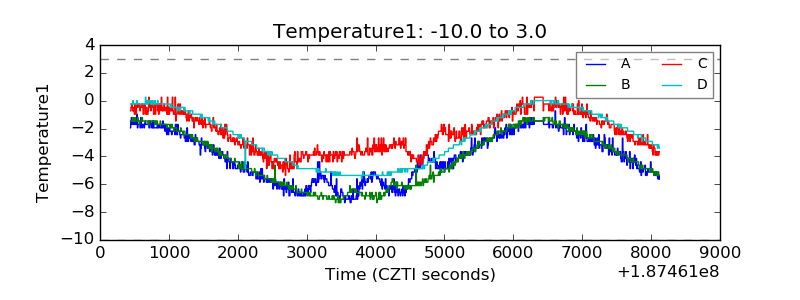 |
| Veto HV Monitor | 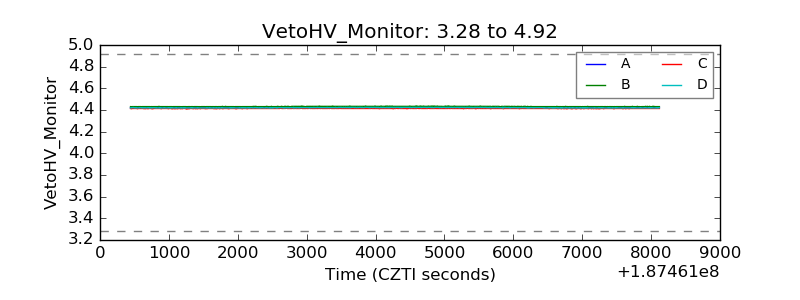 |
| Veto LLD | 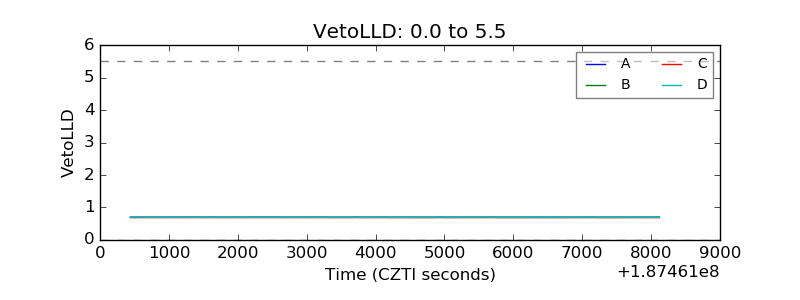 |
| Alpha Counter | 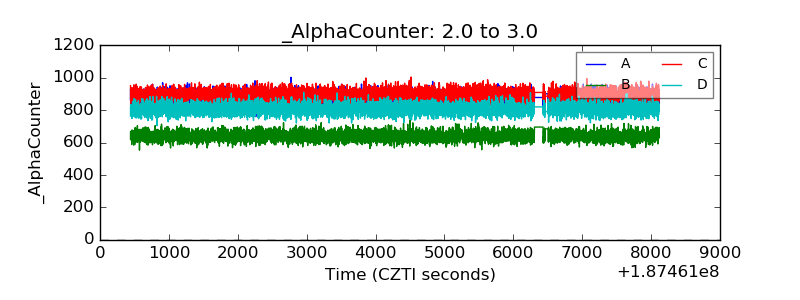 |
| _CPM_Rate | 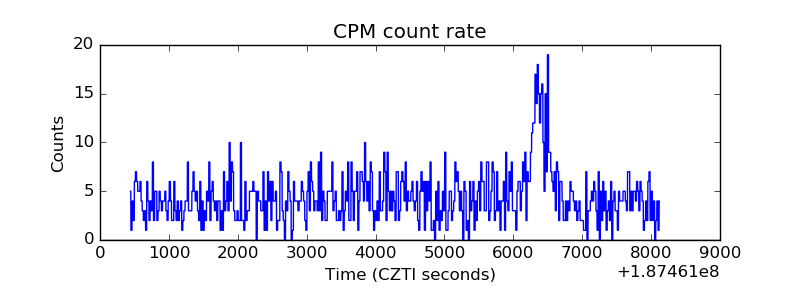 |
| CZT Counter | 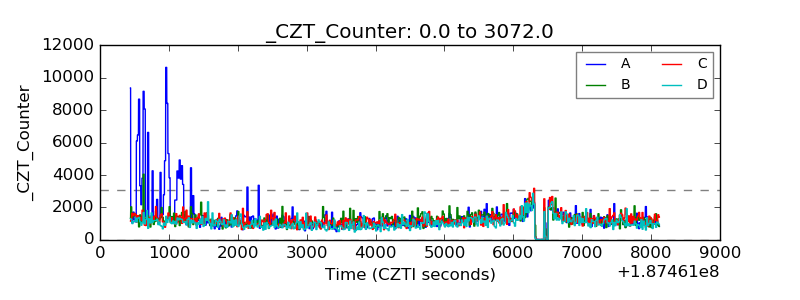 |
| +2.5 Volts monitor | 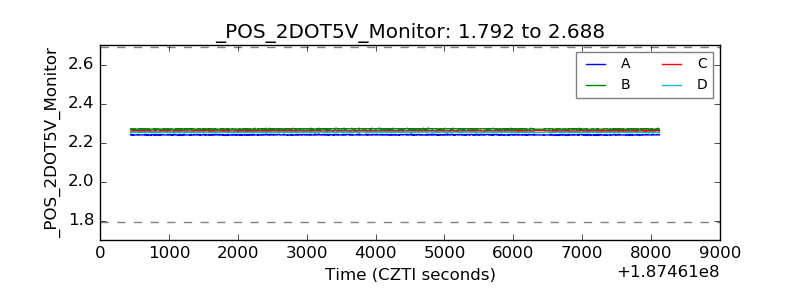 |
| +5 Volts monitor | 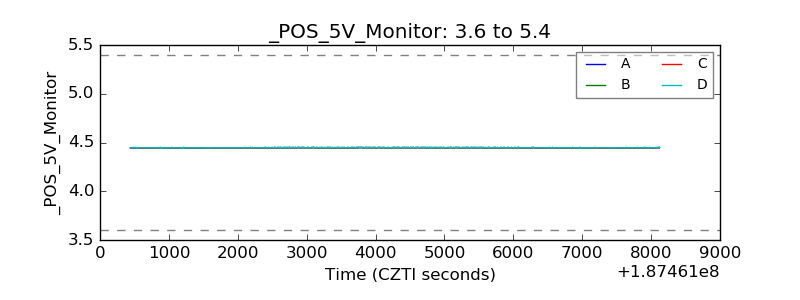 |
| _ROLL_ROT | 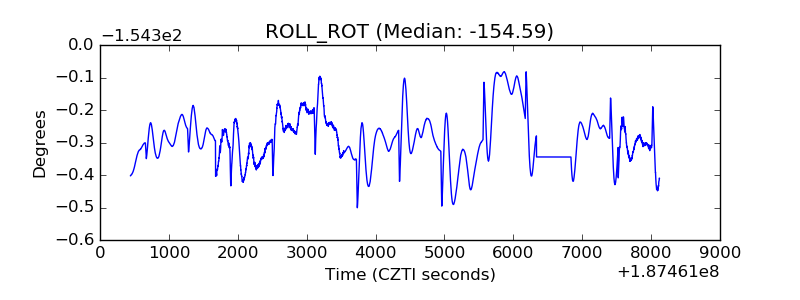 |
| _Roll_DEC | 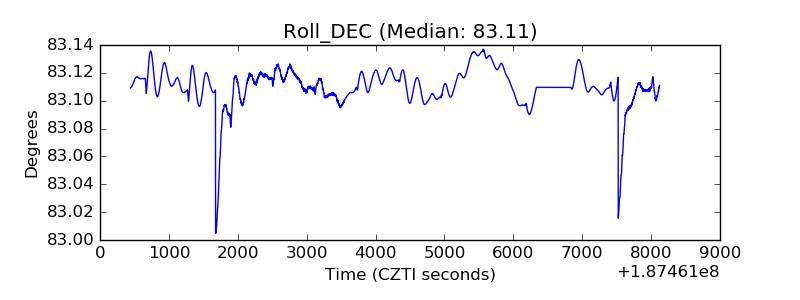 |
| _Roll_RA | 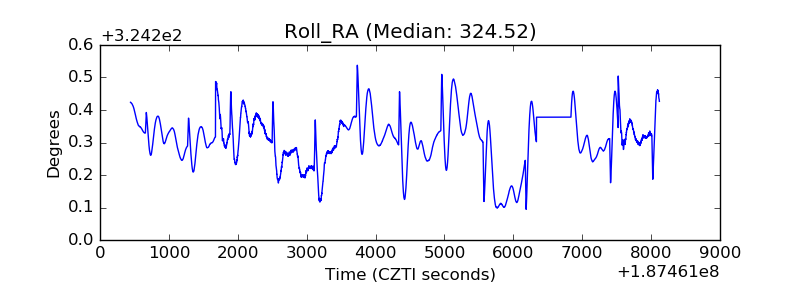 |
| Veto Counter | 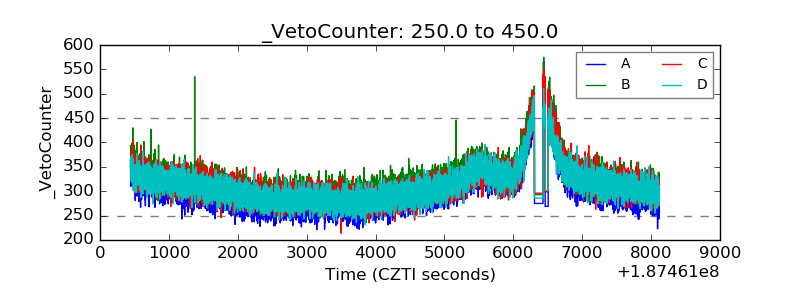 |