| Param | Original file | Final file |
|---|---|---|
| Filename | modeM0/AS1P01_997T02_9000000212_01091cztM0_level2.evt | modeM0/AS1P01_997T02_9000000212_01091cztM0_level2_quad_clean.evt |
| Size (bytes) | 1,127,148,480 | 106,666,560 |
| Size | 1.0 GB | 101.7 MB |
| Events in quadrant A | 8,317,959 | 695,644 |
| Events in quadrant B | 8,860,323 | 692,638 |
| Events in quadrant C | 8,644,965 | 671,695 |
| Events in quadrant D | 7,835,446 | 669,583 |
| Mode M9 | |||
|---|---|---|---|
| Quadrant | BADHDUFLAG | Total packets | Discarded packets |
| A | 0 | 4 | 0 |
| B | 0 | 4 | 0 |
| C | 0 | 4 | 0 |
| D | 0 | 4 | 0 |
| Mode M0 | |||
|---|---|---|---|
| Quadrant | BADHDUFLAG | Total packets | Discarded packets |
| A | 0 | 29841 | 2 |
| B | 0 | 31480 | 1 |
| C | 0 | 30821 | 1 |
| D | 0 | 28397 | 1 |
| Mode SS | |||
|---|---|---|---|
| Quadrant | BADHDUFLAG | Total packets | Discarded packets |
| A | 0 | 146 | 0 |
| B | 0 | 146 | 0 |
| C | 0 | 146 | 0 |
| D | 0 | 146 | 0 |
| Quadrant | Total seconds | Saturated seconds | Saturation percentage |
|---|---|---|---|
| A | 7194 | 4 | 0.055602% |
| B | 7194 | 19 | 0.264109% |
| C | 7194 | 9 | 0.125104% |
| D | 7194 | 17 | 0.236308% |
Noise dominated data is calculated using 1-second bins in cleaned event files. If a bin has >2000 counts, and if more than 50% of those come from <1% of pixels, then it is considered to be noise-dominated and hence unusable.
| Quadrant | # 1 sec bins | Bins with >0 counts | Bins with >2000 counts | High rate bins dominated by noise | Noise dominated (total time) | Noise dominated (detector-on time) | Marked lightcurve |
|---|---|---|---|---|---|---|---|
| A | 7569 | 7196 | 142 | 142 | 1.88% | 1.97% | 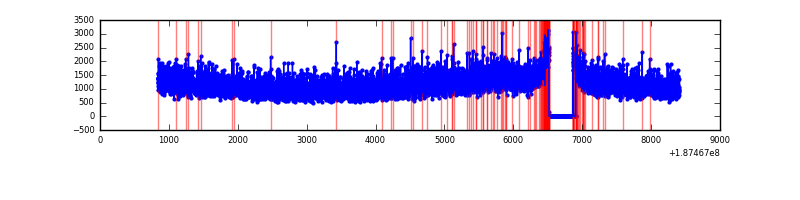 |
| B | 7569 | 7196 | 257 | 257 | 3.40% | 3.57% | 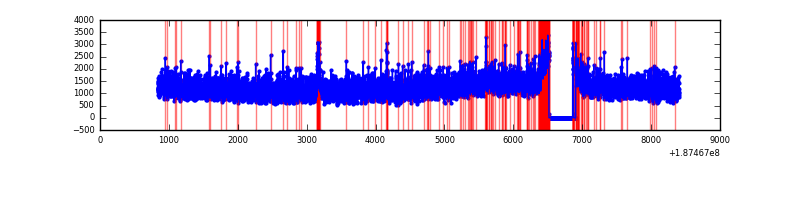 |
| C | 7569 | 7196 | 211 | 211 | 2.79% | 2.93% | 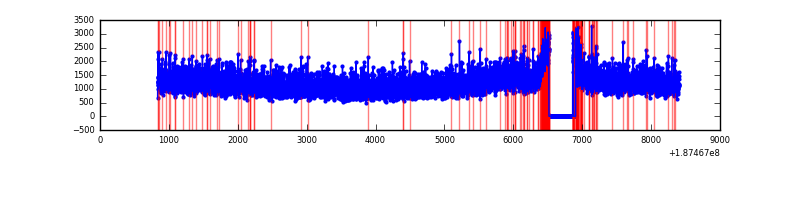 |
| D | 7569 | 7196 | 126 | 126 | 1.66% | 1.75% | 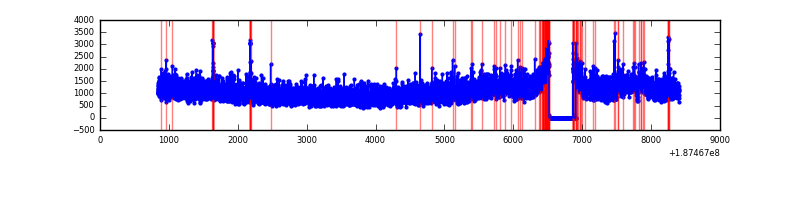 |
Top three noisy pixels from each quadrant. If the there are fewer than three noisy pixels in the level2.evt file, extra rows are filled as -1
| Pixel properties | Quadrant properties | ||||||
|---|---|---|---|---|---|---|---|
| Quadrant | DetID | PixID | Counts | Sigma | Mean | Median | Sigma |
| A | 11 | 79 | 11508 | 17.89 | 2164 | 2175 | 521.6 |
| A | 13 | 9 | 10735 | 16.41 | 2164 | 2175 | 521.6 |
| A | 3 | 111 | 6617 | 8.52 | 2164 | 2175 | 521.6 |
| B | 5 | 191 | 89536 | 164.43 | 2256 | 2261 | 530.8 |
| B | 15 | 22 | 66718 | 121.44 | 2256 | 2261 | 530.8 |
| B | 4 | 187 | 45090 | 80.69 | 2256 | 2261 | 530.8 |
| C | 15 | 241 | 338426 | 576.54 | 2084 | 2156 | 583.3 |
| C | 10 | 207 | 84515 | 141.21 | 2084 | 2156 | 583.3 |
| C | 3 | 79 | 33438 | 53.63 | 2084 | 2156 | 583.3 |
| D | 2 | 216 | 187475 | 296.21 | 2013 | 2080 | 625.9 |
| D | 2 | 107 | 58530 | 90.19 | 2013 | 2080 | 625.9 |
| D | 10 | 125 | 39752 | 60.19 | 2013 | 2080 | 625.9 |
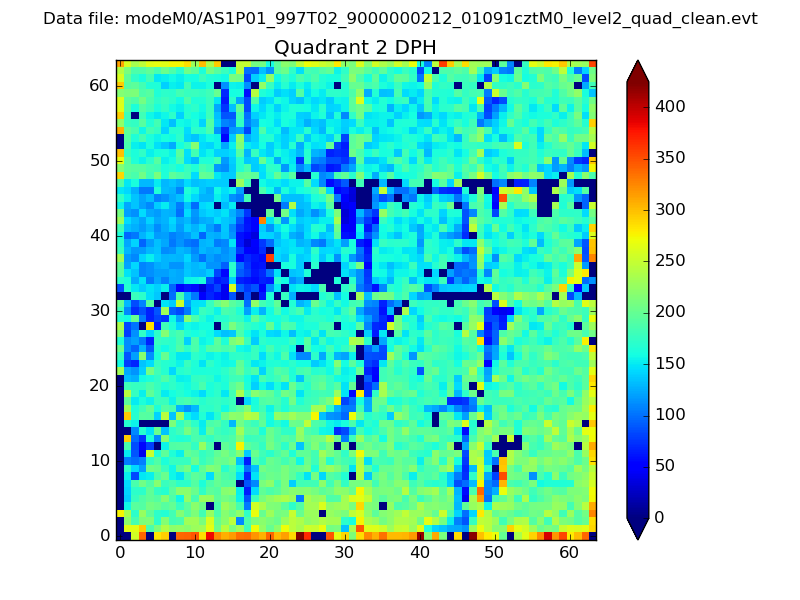
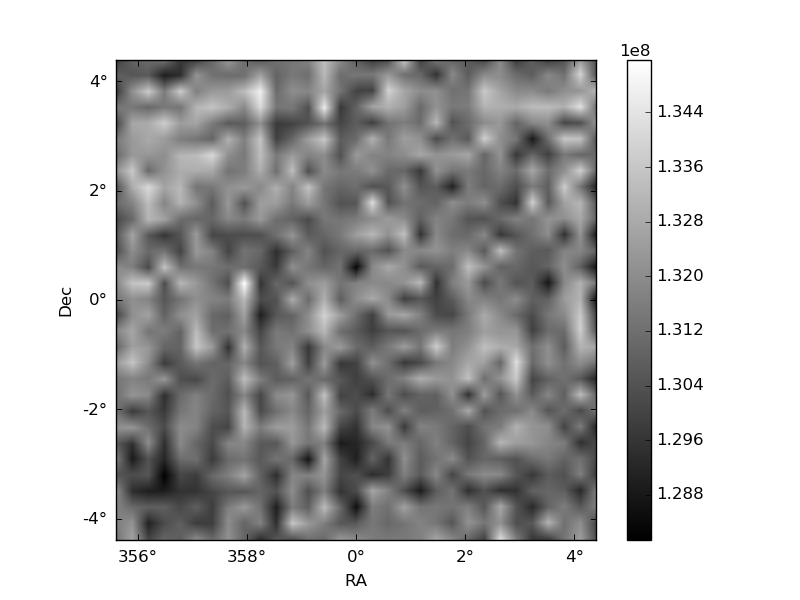
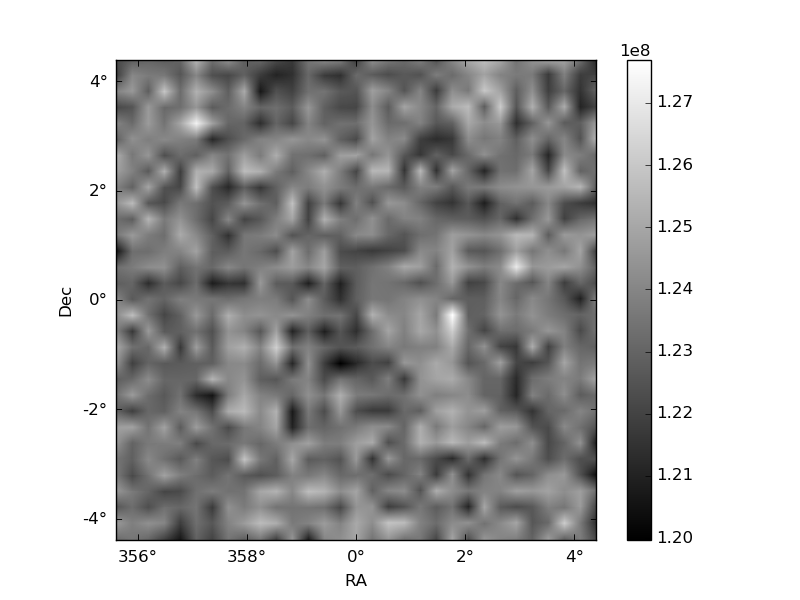
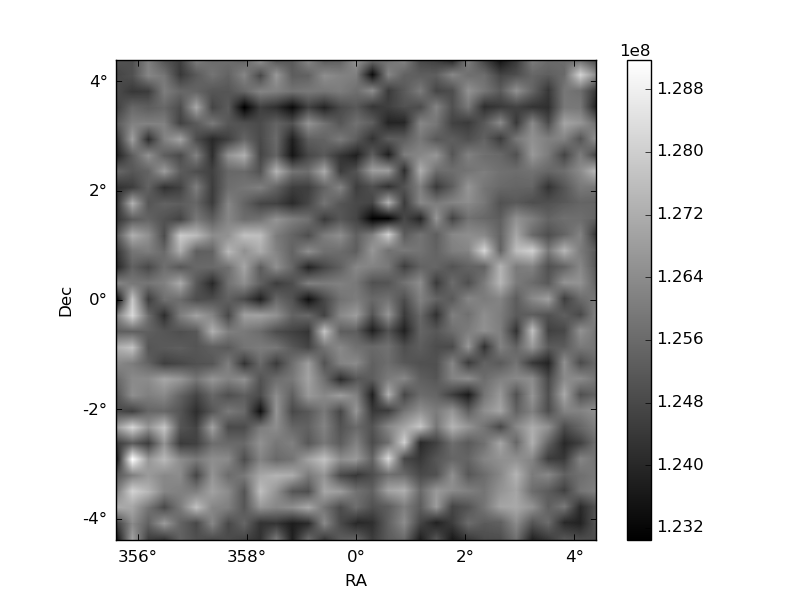
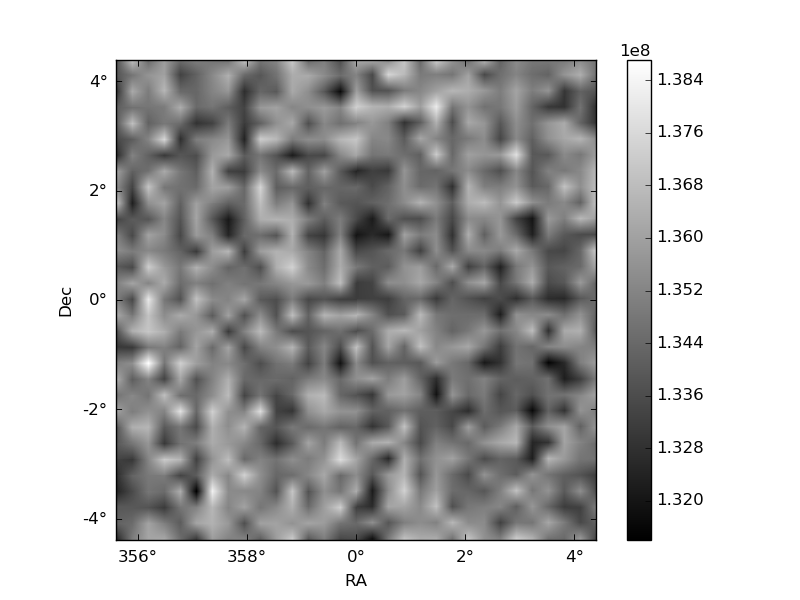
Histogram calculated using DETX and DETY for each event in the final _common_clean file
| Quadrant A | 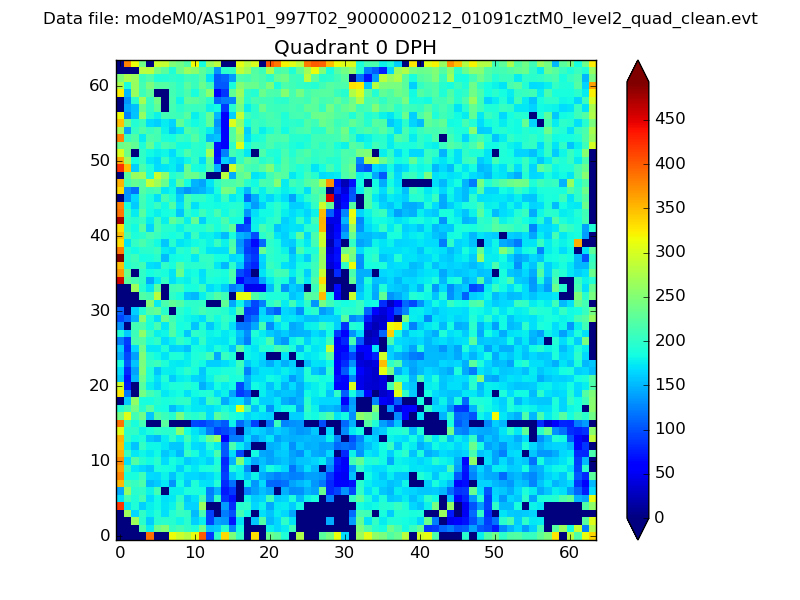 |
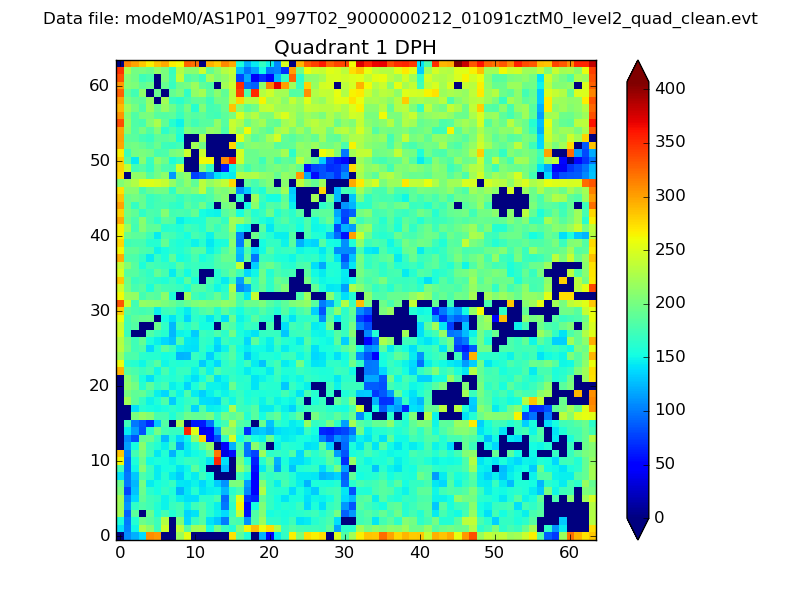 |
Quadrant B |
|---|---|---|---|
| Quadrant D | 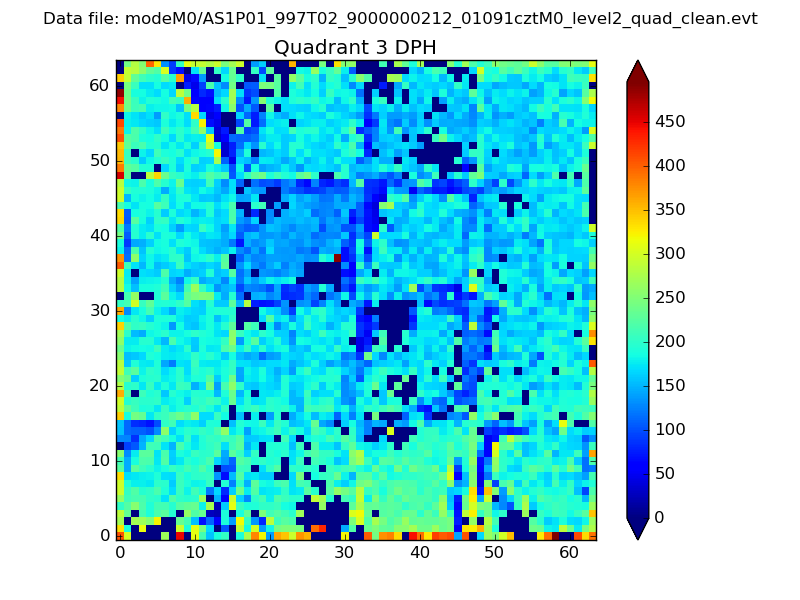 |
 |
Quadrant C |
| Plot type | Count rate plots | Images |
|---|---|---|
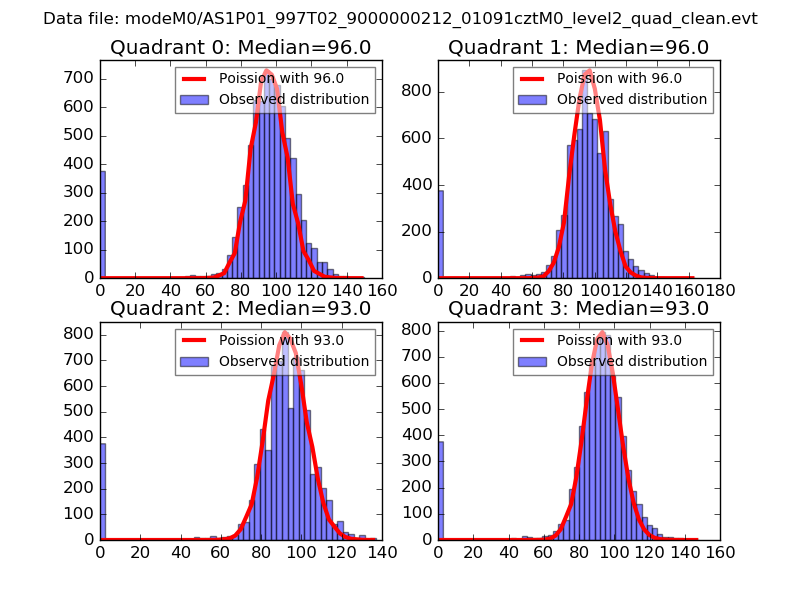
| Comparison with Poisson distribution Blue bars denote a histogram of data divided into 1 sec bins. Red curve is a Poisson curve with rate = median count rate of data. |
 |
 |
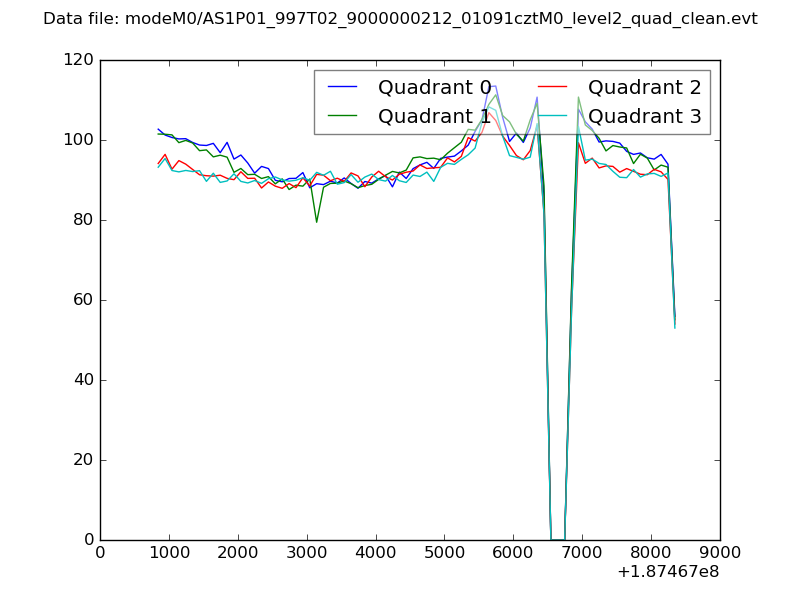
| Quadrant-wise count rates Data is divided into 100 sec bins |
 |
|
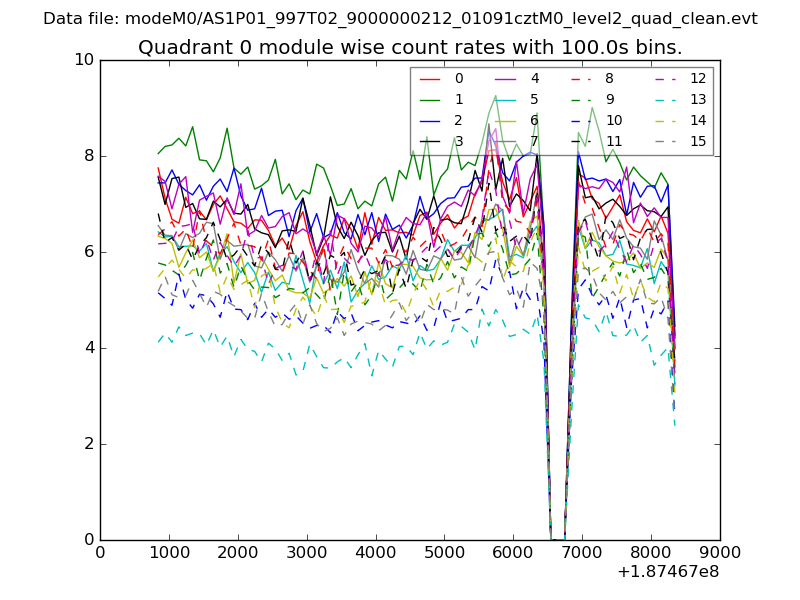
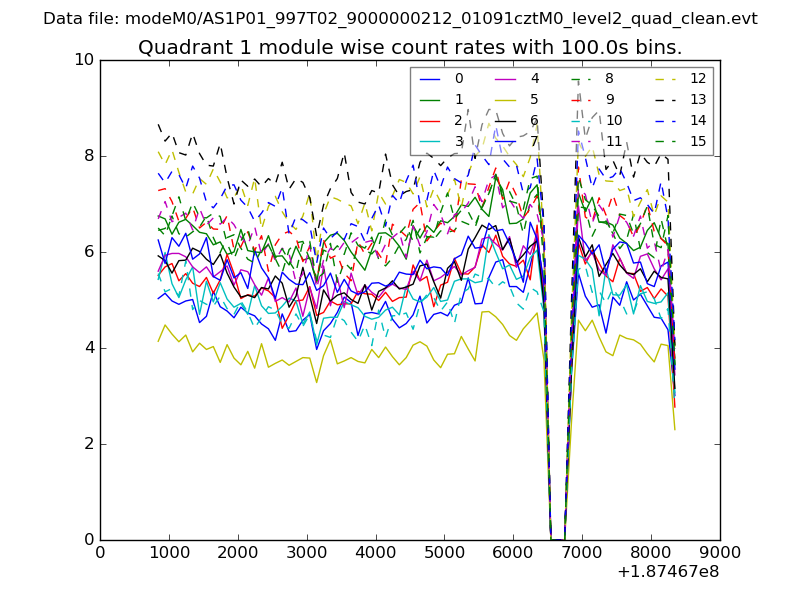
| Module-wise count rates for Quadrant A Data is divided into 100 sec bins |
 |
 |
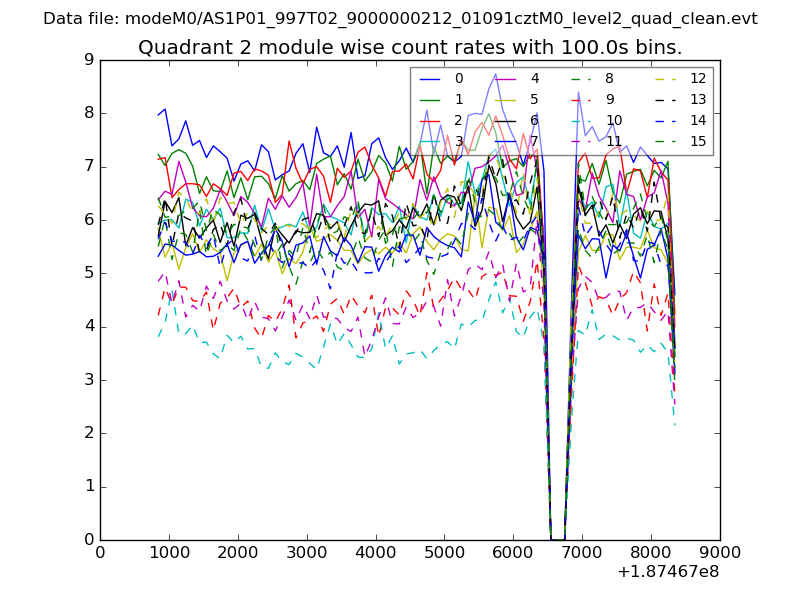
| Module-wise count rates for Quadrant B Data is divided into 100 sec bins |
 |
 |
| Module-wise count rates for Quadrant C Data is divided into 100 sec bins |
 |
 |
| Module-wise count rates for Quadrant D Data is divided into 100 sec bins |
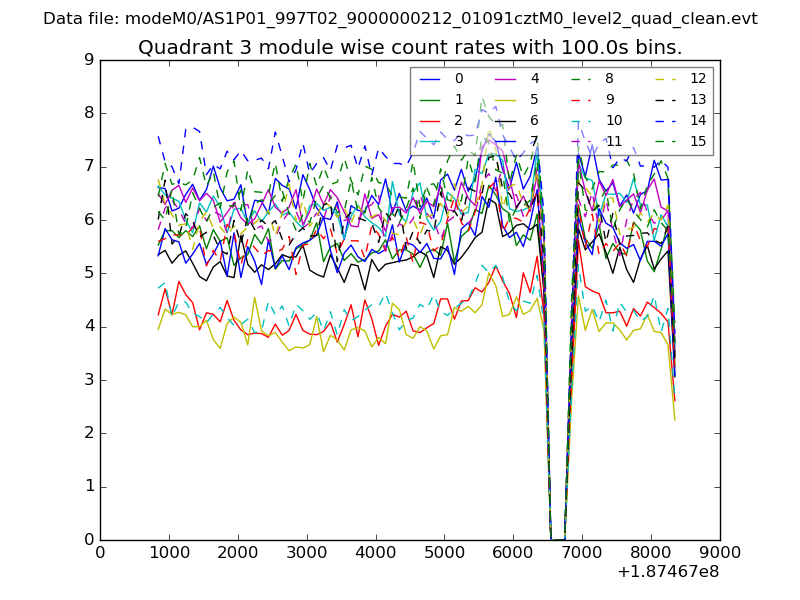 |
 |
| Parameter | Plot |
|---|---|
| CZT HV Monitor | 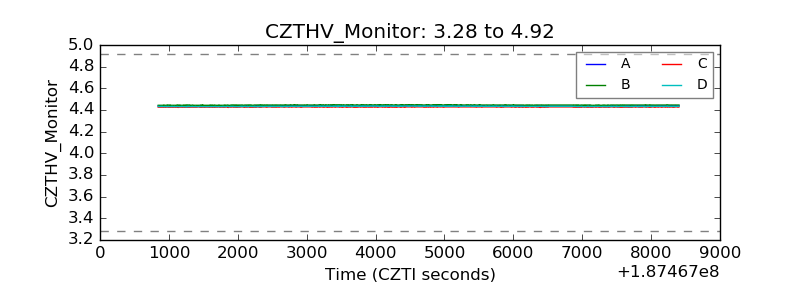 |
| D_VDD | 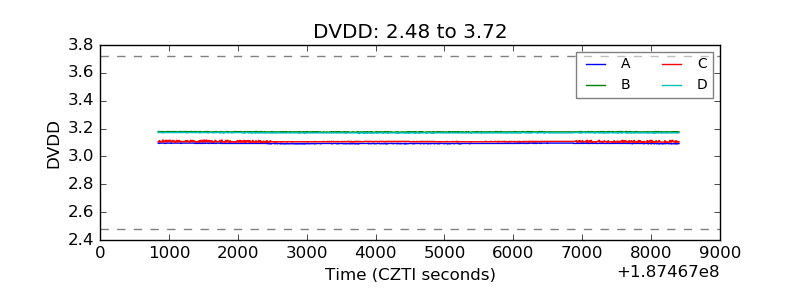 |
| Temperature 1 | 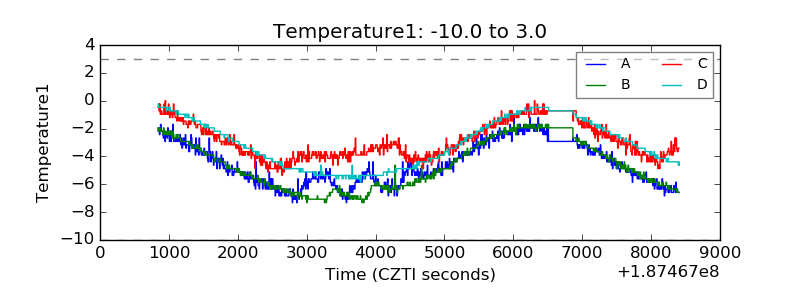 |
| Veto HV Monitor | 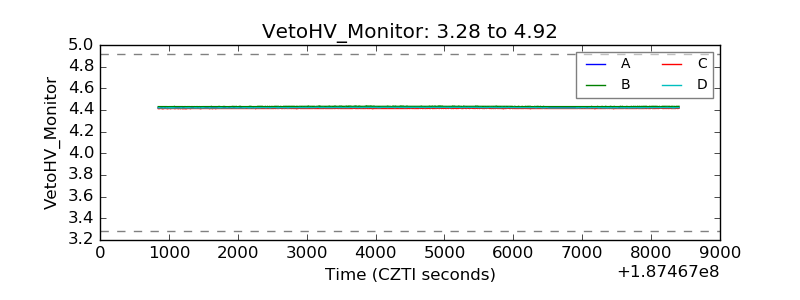 |
| Veto LLD | 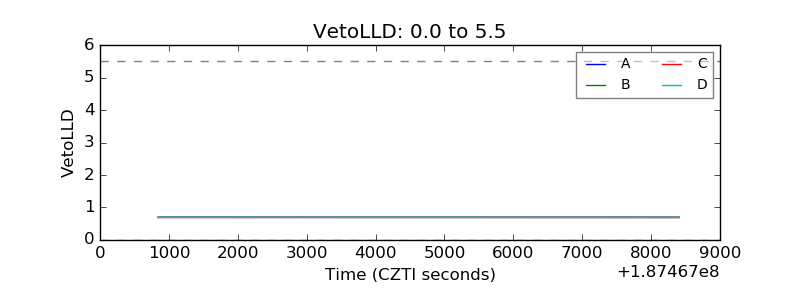 |
| Alpha Counter | 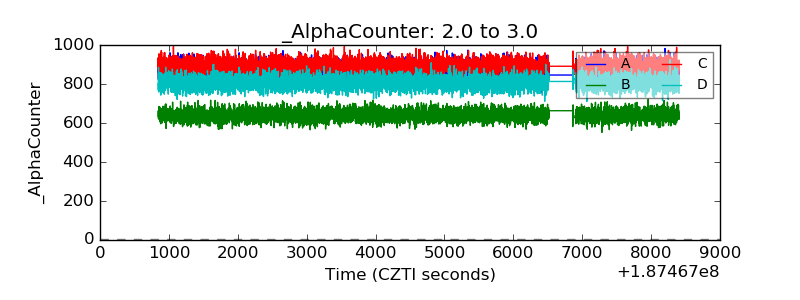 |
| _CPM_Rate | 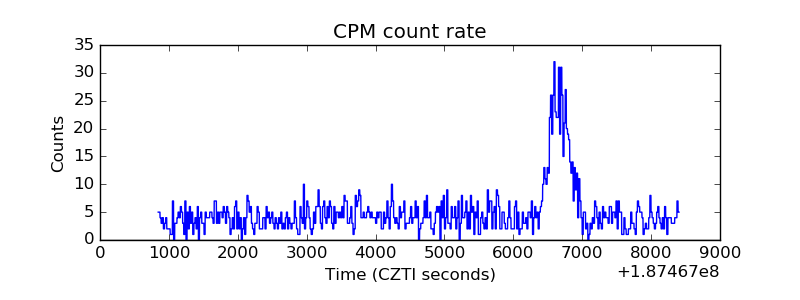 |
| CZT Counter | 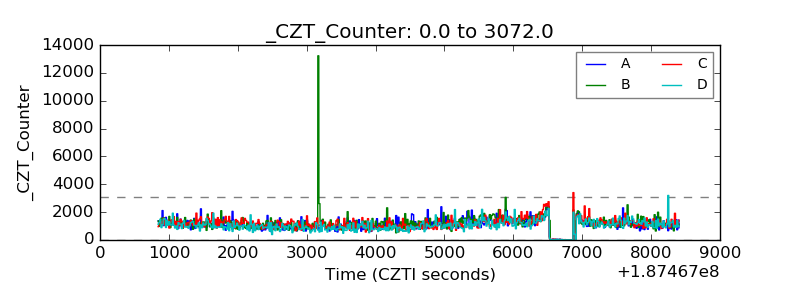 |
| +2.5 Volts monitor |  |
| +5 Volts monitor |  |
| _ROLL_ROT | 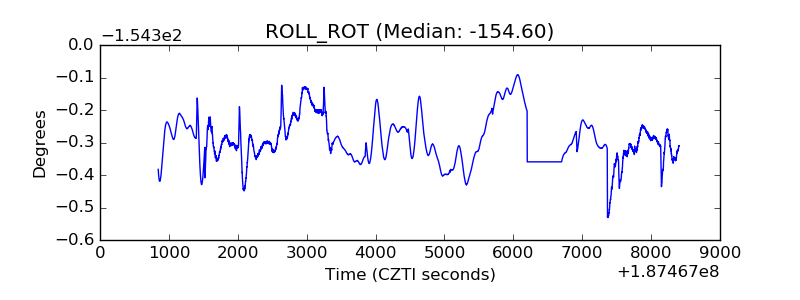 |
| _Roll_DEC | 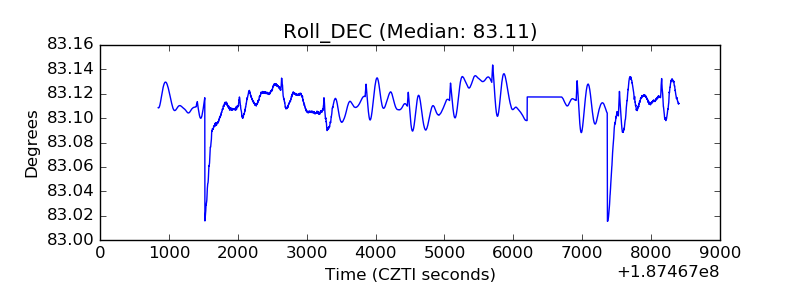 |
| _Roll_RA | 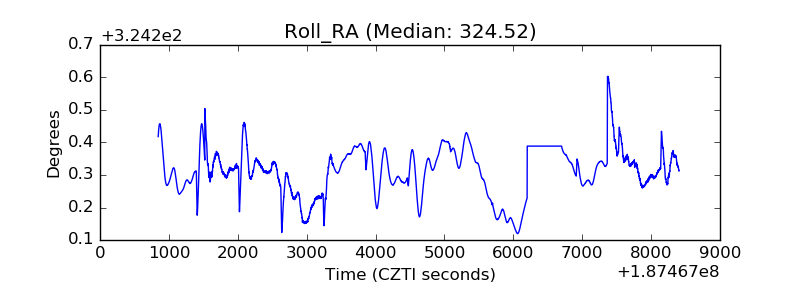 |
| Veto Counter | 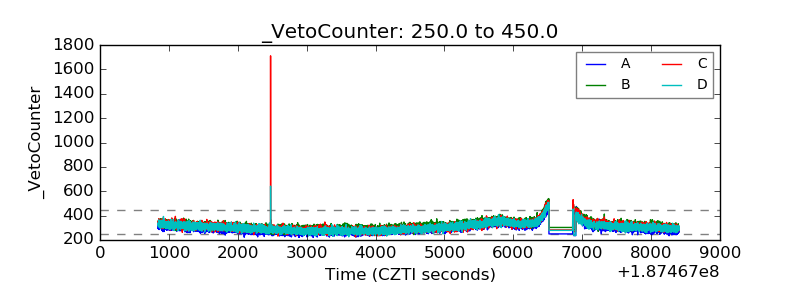 |