| Param | Original file | Final file |
|---|---|---|
| Filename | modeM0/AS1P01_997T02_9000000212_01092cztM0_level2.evt | modeM0/AS1P01_997T02_9000000212_01092cztM0_level2_quad_clean.evt |
| Size (bytes) | 1,169,749,440 | 109,673,280 |
| Size | 1.1 GB | 104.6 MB |
| Events in quadrant A | 8,547,899 | 713,424 |
| Events in quadrant B | 8,966,207 | 712,795 |
| Events in quadrant C | 8,959,072 | 693,189 |
| Events in quadrant D | 8,463,788 | 688,612 |
| Mode M9 | |||
|---|---|---|---|
| Quadrant | BADHDUFLAG | Total packets | Discarded packets |
| A | 0 | 6 | 0 |
| B | 0 | 6 | 0 |
| C | 0 | 6 | 0 |
| D | 0 | 7 | 0 |
| Mode M0 | |||
|---|---|---|---|
| Quadrant | BADHDUFLAG | Total packets | Discarded packets |
| A | 0 | 30668 | 3 |
| B | 0 | 31908 | 2 |
| C | 0 | 31848 | 2 |
| D | 0 | 30383 | 2 |
| Mode SS | |||
|---|---|---|---|
| Quadrant | BADHDUFLAG | Total packets | Discarded packets |
| A | 0 | 150 | 0 |
| B | 0 | 150 | 0 |
| C | 0 | 150 | 0 |
| D | 0 | 150 | 0 |
| Quadrant | Total seconds | Saturated seconds | Saturation percentage |
|---|---|---|---|
| A | 7377 | 4 | 0.054223% |
| B | 7377 | 9 | 0.122001% |
| C | 7377 | 12 | 0.162668% |
| D | 7377 | 8 | 0.108445% |
Noise dominated data is calculated using 1-second bins in cleaned event files. If a bin has >2000 counts, and if more than 50% of those come from <1% of pixels, then it is considered to be noise-dominated and hence unusable.
| Quadrant | # 1 sec bins | Bins with >0 counts | Bins with >2000 counts | High rate bins dominated by noise | Noise dominated (total time) | Noise dominated (detector-on time) | Marked lightcurve |
|---|---|---|---|---|---|---|---|
| A | 7902 | 7379 | 182 | 182 | 2.30% | 2.47% | 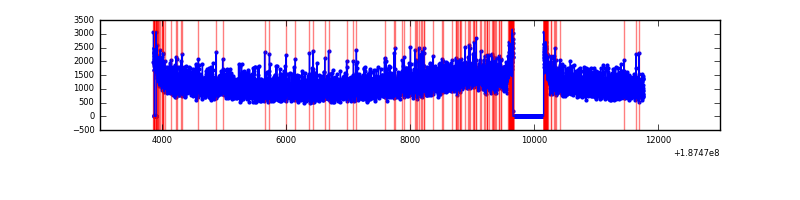 |
| B | 7902 | 7379 | 223 | 223 | 2.82% | 3.02% | 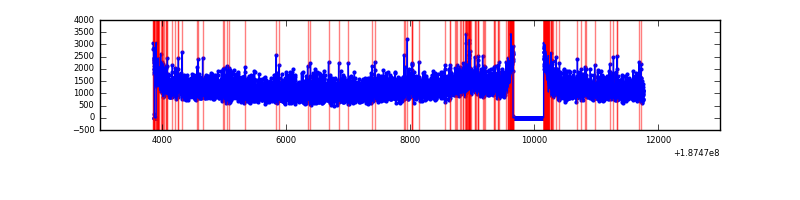 |
| C | 7902 | 7379 | 233 | 233 | 2.95% | 3.16% | 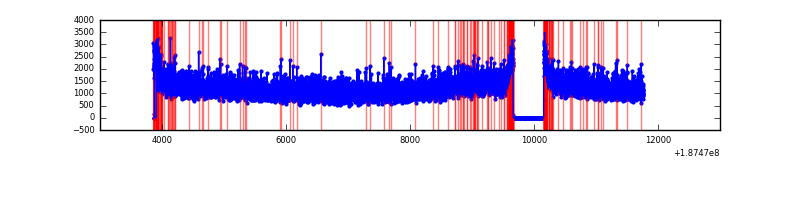 |
| D | 7902 | 7379 | 134 | 134 | 1.70% | 1.82% | 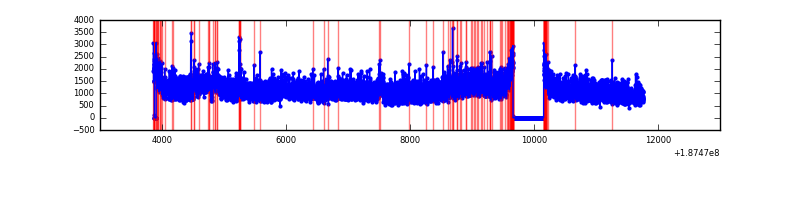 |
Top three noisy pixels from each quadrant. If the there are fewer than three noisy pixels in the level2.evt file, extra rows are filled as -1
| Pixel properties | Quadrant properties | ||||||
|---|---|---|---|---|---|---|---|
| Quadrant | DetID | PixID | Counts | Sigma | Mean | Median | Sigma |
| A | 15 | 233 | 14175 | 22.36 | 2217 | 2231 | 534.2 |
| A | 11 | 79 | 11595 | 17.53 | 2217 | 2231 | 534.2 |
| A | 4 | 32 | 10721 | 15.89 | 2217 | 2231 | 534.2 |
| B | 15 | 22 | 22004 | 36.02 | 2325 | 2337 | 546.1 |
| B | 5 | 184 | 21840 | 35.72 | 2325 | 2337 | 546.1 |
| B | 5 | 249 | 17815 | 28.34 | 2325 | 2337 | 546.1 |
| C | 15 | 241 | 384034 | 637.76 | 2149 | 2221 | 598.7 |
| C | 10 | 207 | 115740 | 189.62 | 2149 | 2221 | 598.7 |
| C | 3 | 111 | 31554 | 49.0 | 2149 | 2221 | 598.7 |
| D | 2 | 216 | 651854 | 1007.51 | 2068 | 2142 | 644.9 |
| D | 10 | 125 | 52737 | 78.46 | 2068 | 2142 | 644.9 |
| D | 2 | 107 | 16157 | 21.73 | 2068 | 2142 | 644.9 |
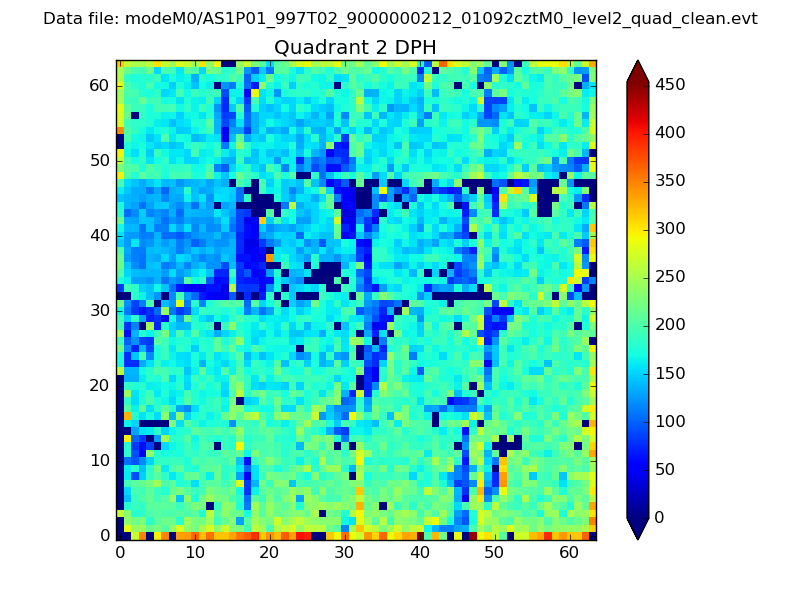
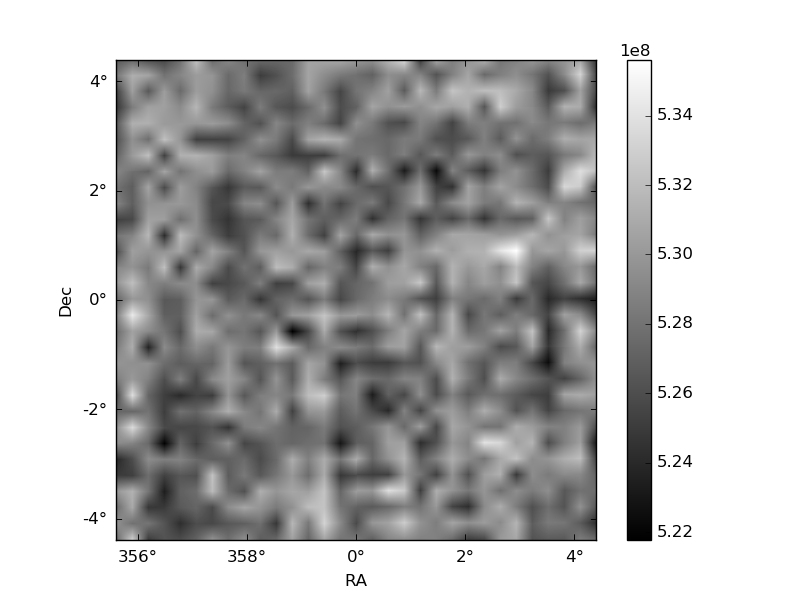
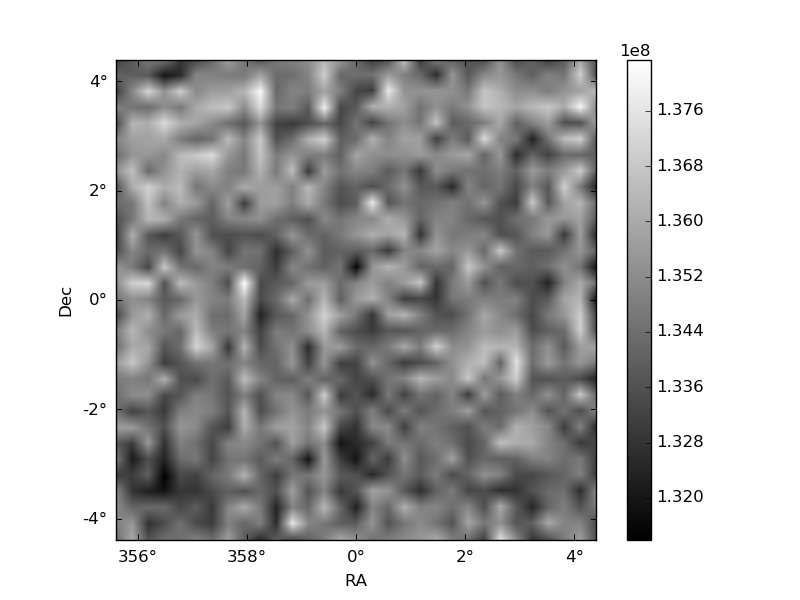
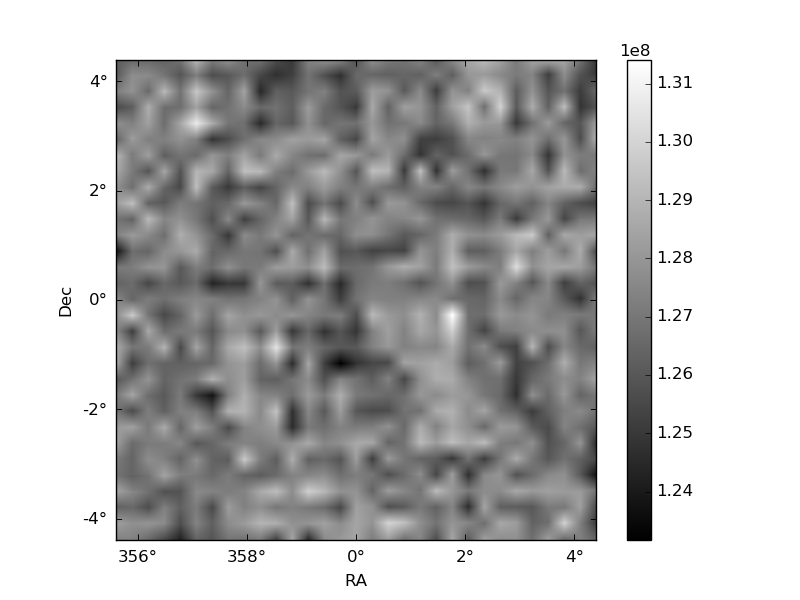
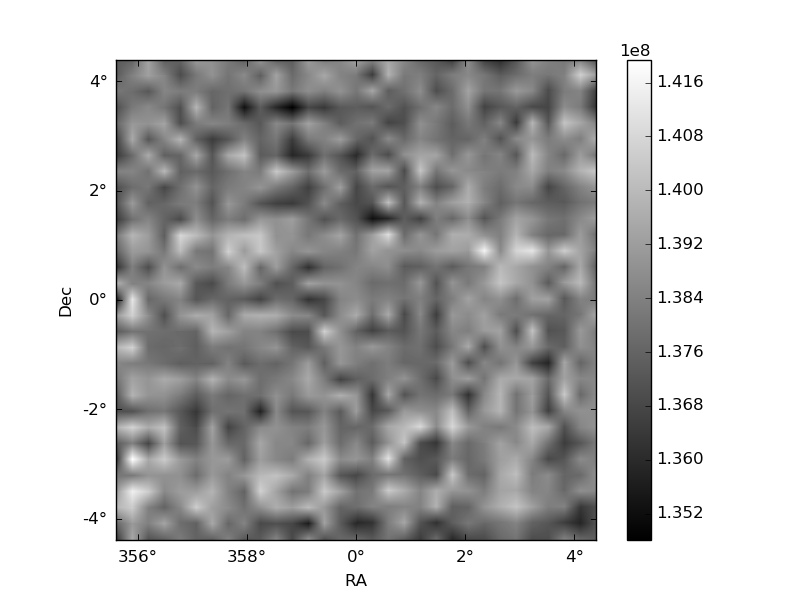
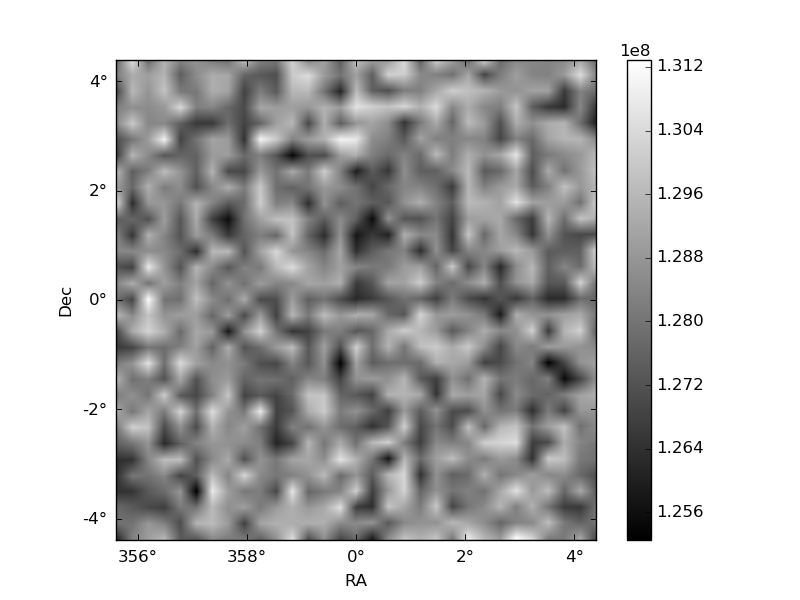
Histogram calculated using DETX and DETY for each event in the final _common_clean file
| Quadrant A | 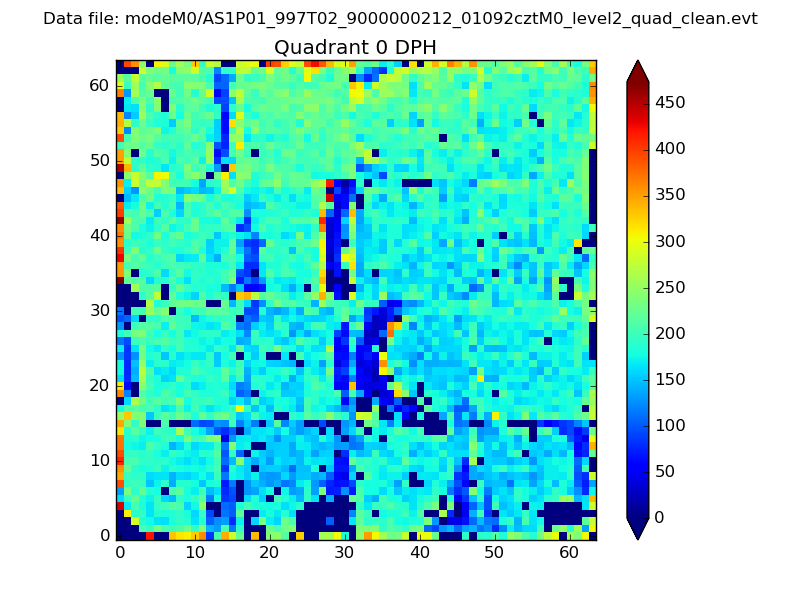 |
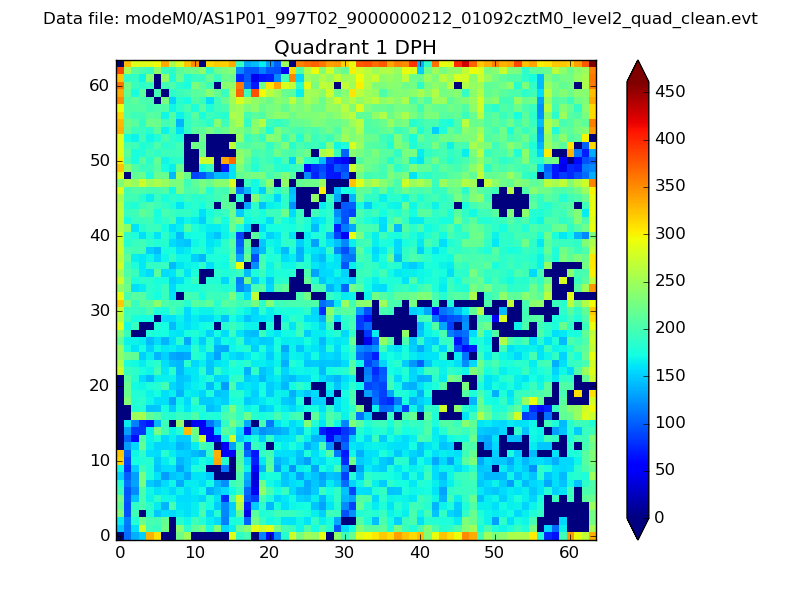 |
Quadrant B |
|---|---|---|---|
| Quadrant D | 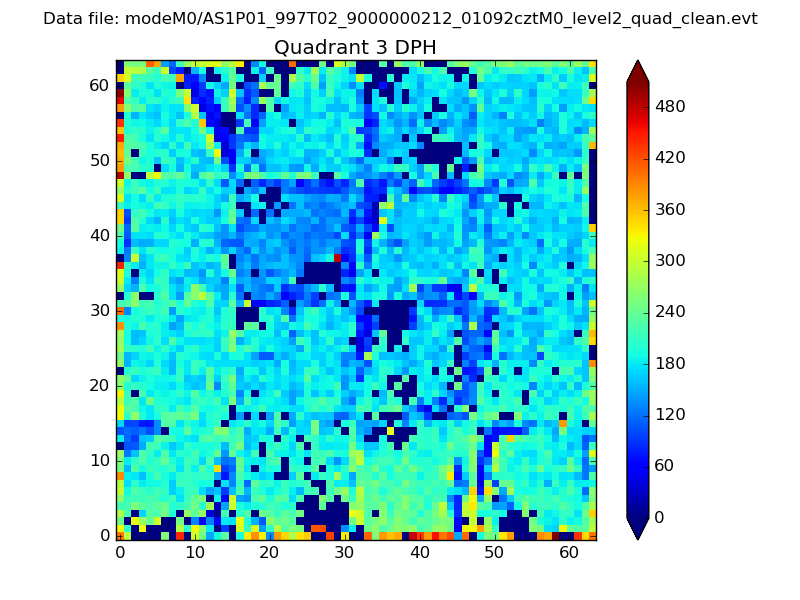 |
 |
Quadrant C |
| Plot type | Count rate plots | Images |
|---|---|---|
| Comparison with Poisson distribution Blue bars denote a histogram of data divided into 1 sec bins. Red curve is a Poisson curve with rate = median count rate of data. |
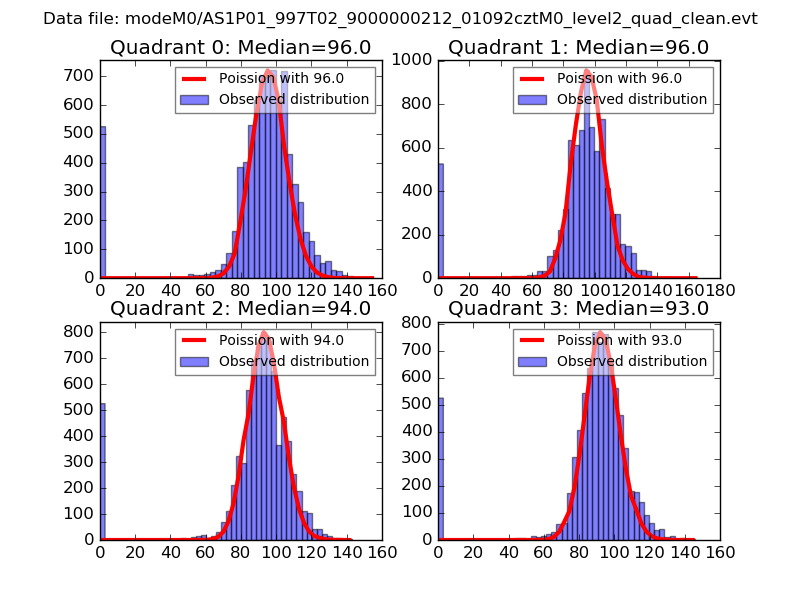 |
 |
| Quadrant-wise count rates Data is divided into 100 sec bins |
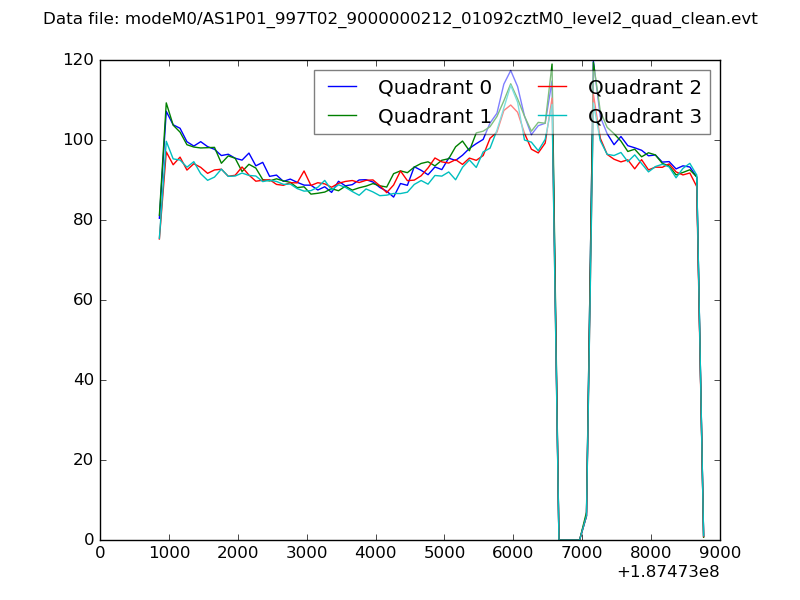 |
|
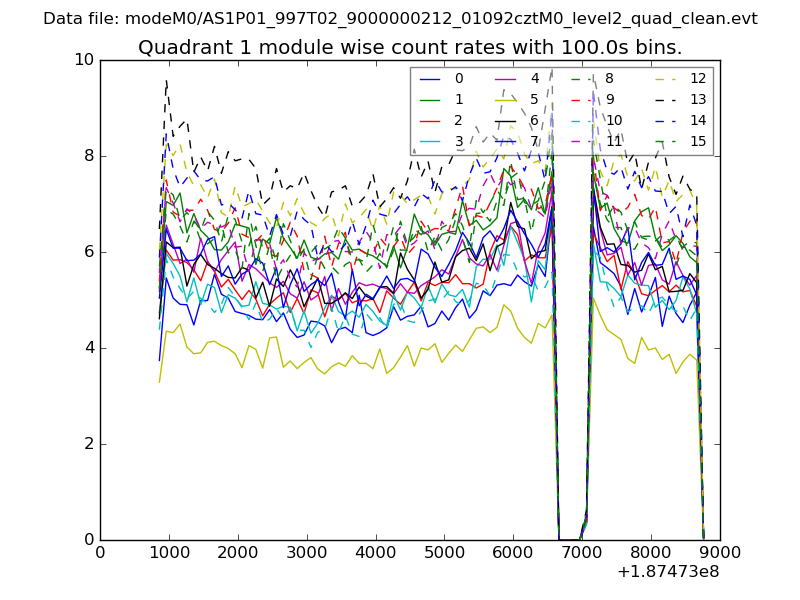
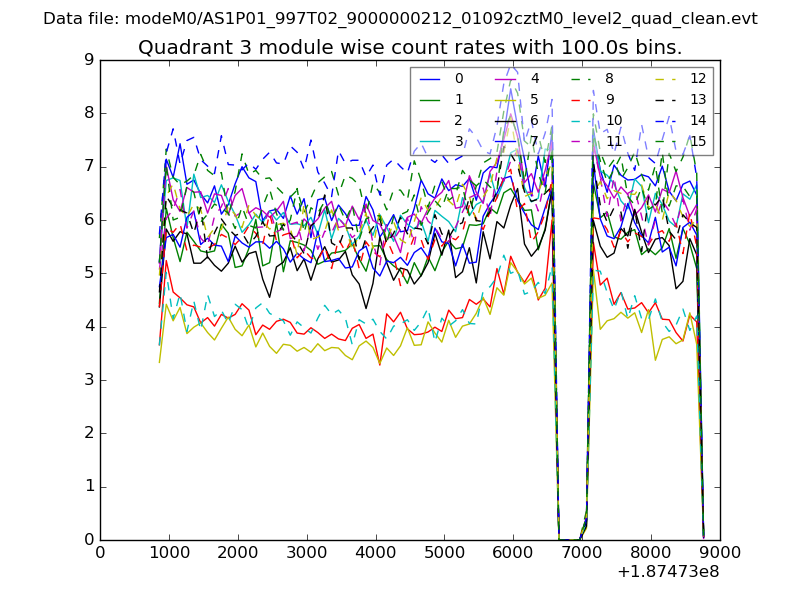
| Module-wise count rates for Quadrant A Data is divided into 100 sec bins |
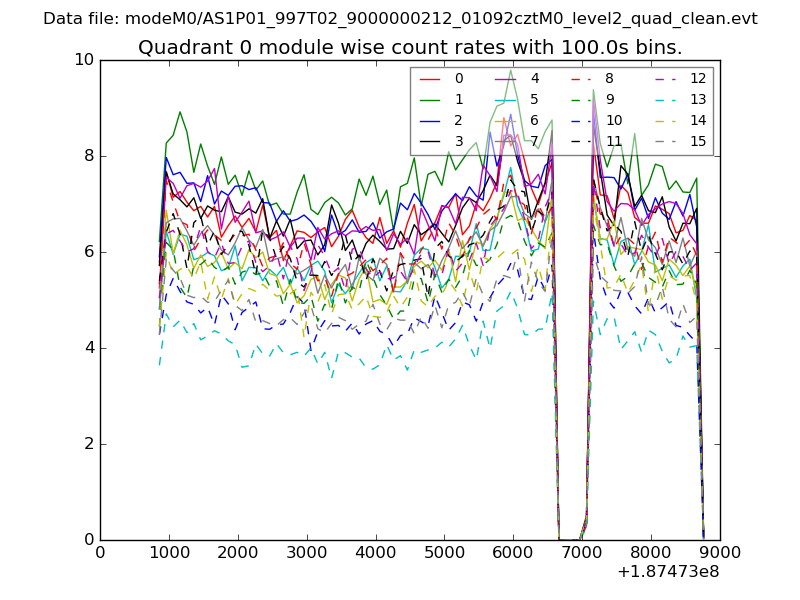 |
 |
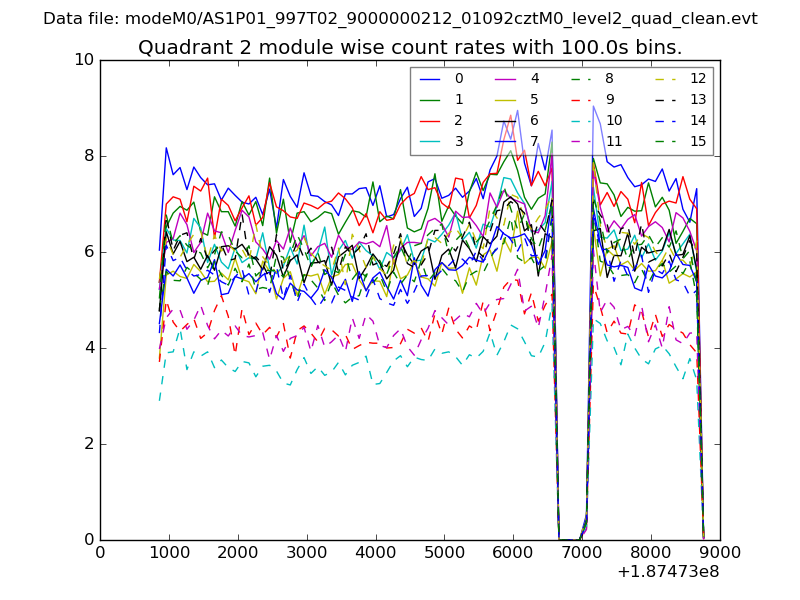
| Module-wise count rates for Quadrant B Data is divided into 100 sec bins |
 |
 |
| Module-wise count rates for Quadrant C Data is divided into 100 sec bins |
 |
 |
| Module-wise count rates for Quadrant D Data is divided into 100 sec bins |
 |
 |
| Parameter | Plot |
|---|---|
| CZT HV Monitor | 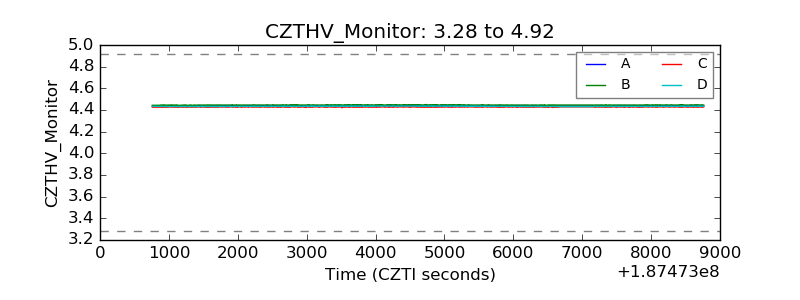 |
| D_VDD | 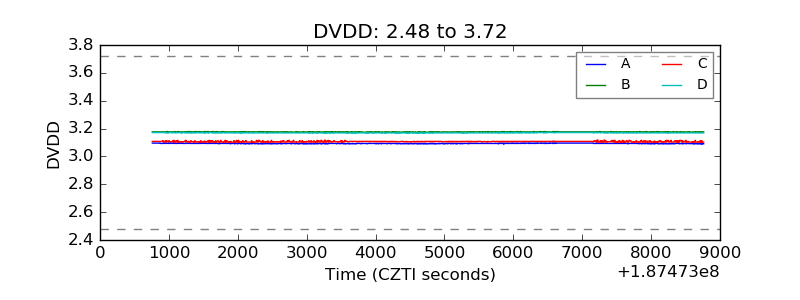 |
| Temperature 1 | 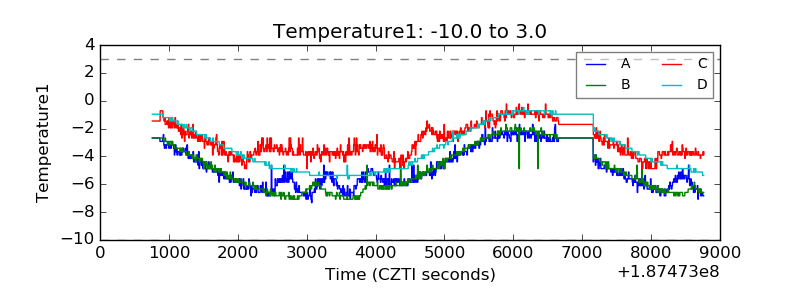 |
| Veto HV Monitor | 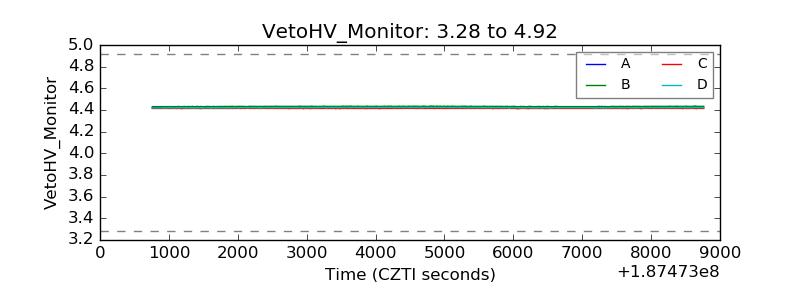 |
| Veto LLD | 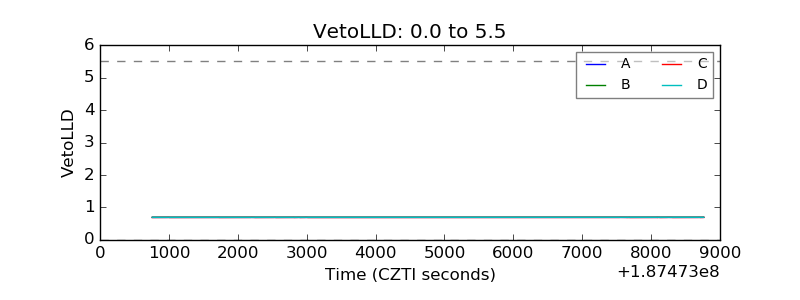 |
| Alpha Counter | 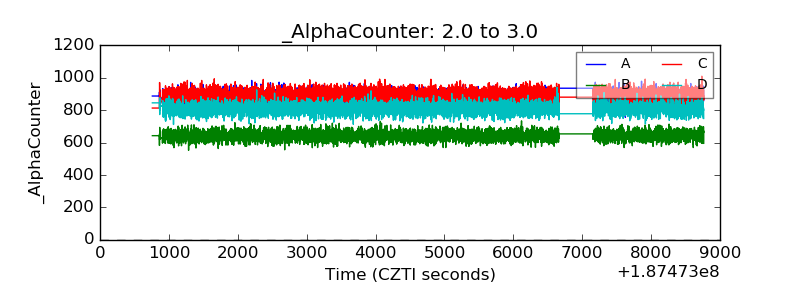 |
| _CPM_Rate | 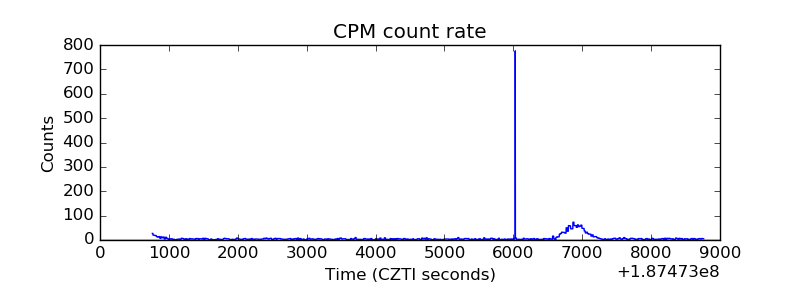 |
| CZT Counter | 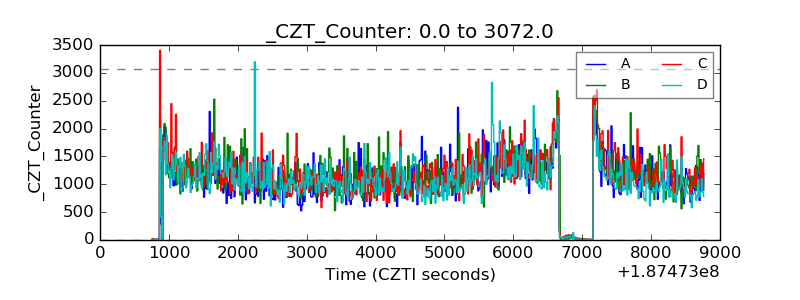 |
| +2.5 Volts monitor |  |
| +5 Volts monitor |  |
| _ROLL_ROT | 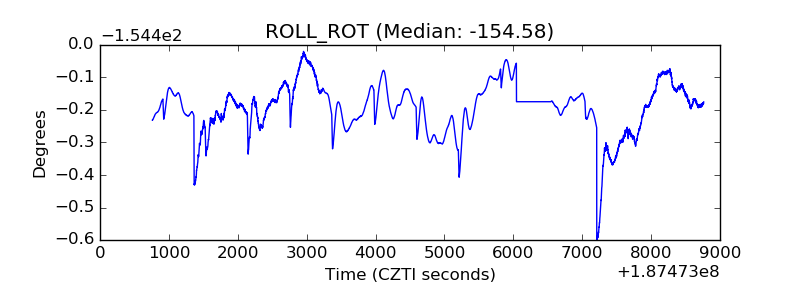 |
| _Roll_DEC | 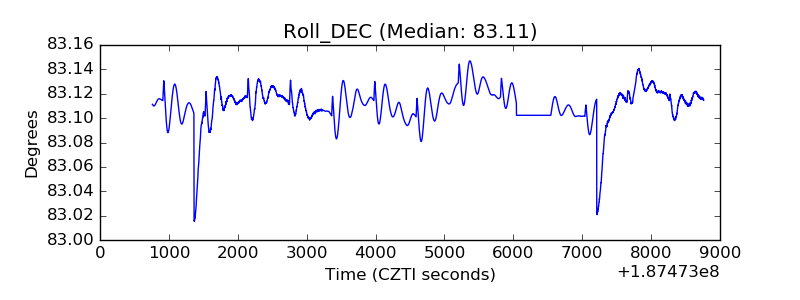 |
| _Roll_RA | 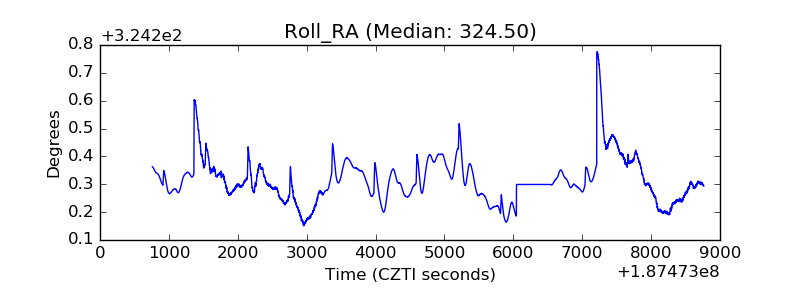 |
| Veto Counter | 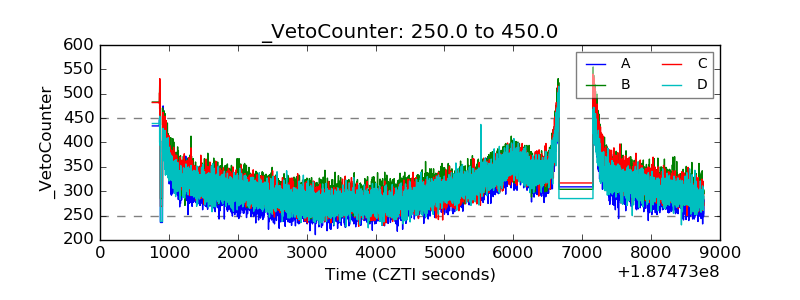 |