| Param | Original file | Final file |
|---|---|---|
| Filename | modeM0/AS1P01_997T02_9000000212_01094cztM0_level2.evt | modeM0/AS1P01_997T02_9000000212_01094cztM0_level2_quad_clean.evt |
| Size (bytes) | 1,996,957,440 | 190,022,400 |
| Size | 1.9 GB | 181.2 MB |
| Events in quadrant A | 15,012,811 | 1,230,370 |
| Events in quadrant B | 15,812,617 | 1,235,661 |
| Events in quadrant C | 15,397,379 | 1,207,116 |
| Events in quadrant D | 13,409,363 | 1,198,042 |
| Mode M9 | |||
|---|---|---|---|
| Quadrant | BADHDUFLAG | Total packets | Discarded packets |
| A | 0 | 21 | 0 |
| B | 0 | 21 | 0 |
| C | 0 | 21 | 0 |
| D | 0 | 21 | 0 |
| Mode M0 | |||
|---|---|---|---|
| Quadrant | BADHDUFLAG | Total packets | Discarded packets |
| A | 0 | 53685 | 4 |
| B | 0 | 56068 | 3 |
| C | 0 | 54828 | 3 |
| D | 0 | 49026 | 3 |
| Mode SS | |||
|---|---|---|---|
| Quadrant | BADHDUFLAG | Total packets | Discarded packets |
| A | 0 | 262 | 0 |
| B | 0 | 262 | 0 |
| C | 0 | 262 | 0 |
| D | 0 | 262 | 0 |
| Quadrant | Total seconds | Saturated seconds | Saturation percentage |
|---|---|---|---|
| A | 12799 | 26 | 0.203141% |
| B | 12799 | 13 | 0.101570% |
| C | 12799 | 12 | 0.093757% |
| D | 12799 | 3 | 0.023439% |
Noise dominated data is calculated using 1-second bins in cleaned event files. If a bin has >2000 counts, and if more than 50% of those come from <1% of pixels, then it is considered to be noise-dominated and hence unusable.
| Quadrant | # 1 sec bins | Bins with >0 counts | Bins with >2000 counts | High rate bins dominated by noise | Noise dominated (total time) | Noise dominated (detector-on time) | Marked lightcurve |
|---|---|---|---|---|---|---|---|
| A | 14844 | 12802 | 376 | 376 | 2.53% | 2.94% | 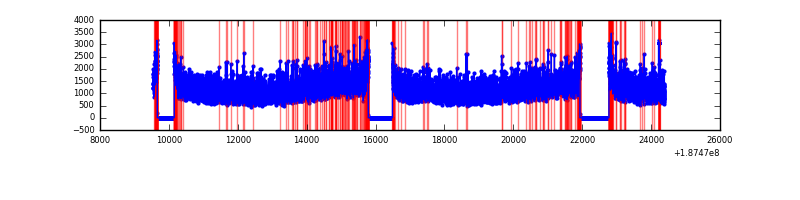 |
| B | 14844 | 12802 | 401 | 401 | 2.70% | 3.13% | 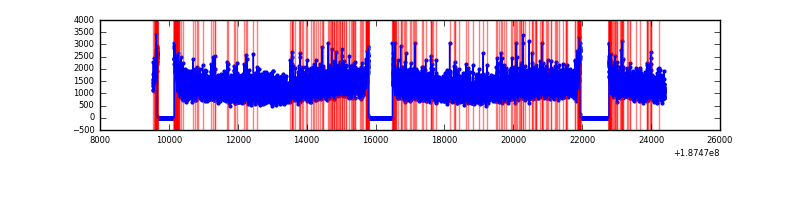 |
| C | 14844 | 12802 | 389 | 389 | 2.62% | 3.04% |  |
| D | 14844 | 12802 | 171 | 171 | 1.15% | 1.34% | 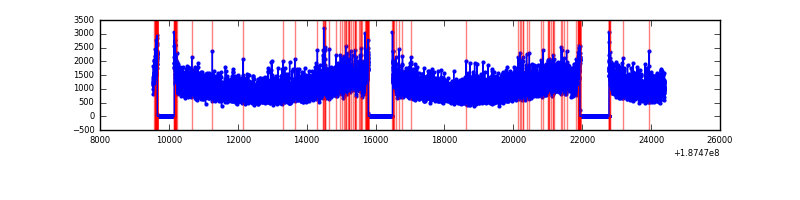 |
Top three noisy pixels from each quadrant. If the there are fewer than three noisy pixels in the level2.evt file, extra rows are filled as -1
| Pixel properties | Quadrant properties | ||||||
|---|---|---|---|---|---|---|---|
| Quadrant | DetID | PixID | Counts | Sigma | Mean | Median | Sigma |
| A | 4 | 32 | 168652 | 178.82 | 3840 | 3867 | 921.5 |
| A | 15 | 233 | 88265 | 91.59 | 3840 | 3867 | 921.5 |
| A | 11 | 79 | 17745 | 15.06 | 3840 | 3867 | 921.5 |
| B | 4 | 187 | 155348 | 158.15 | 4052 | 4065 | 956.6 |
| B | 5 | 249 | 52074 | 50.19 | 4052 | 4065 | 956.6 |
| B | 5 | 184 | 45342 | 43.15 | 4052 | 4065 | 956.6 |
| C | 15 | 241 | 648966 | 627.8 | 3688 | 3817 | 1027.6 |
| C | 10 | 207 | 214547 | 205.06 | 3688 | 3817 | 1027.6 |
| C | 3 | 111 | 53417 | 48.27 | 3688 | 3817 | 1027.6 |
| D | 10 | 125 | 114302 | 100.65 | 3540 | 3671 | 1099.1 |
| D | 2 | 216 | 47048 | 39.46 | 3540 | 3671 | 1099.1 |
| D | 14 | 34 | 19896 | 14.76 | 3540 | 3671 | 1099.1 |
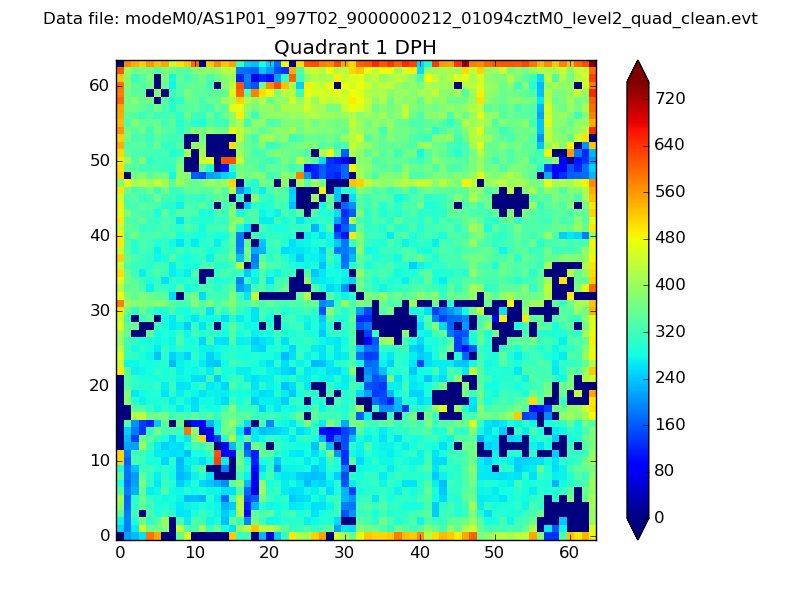
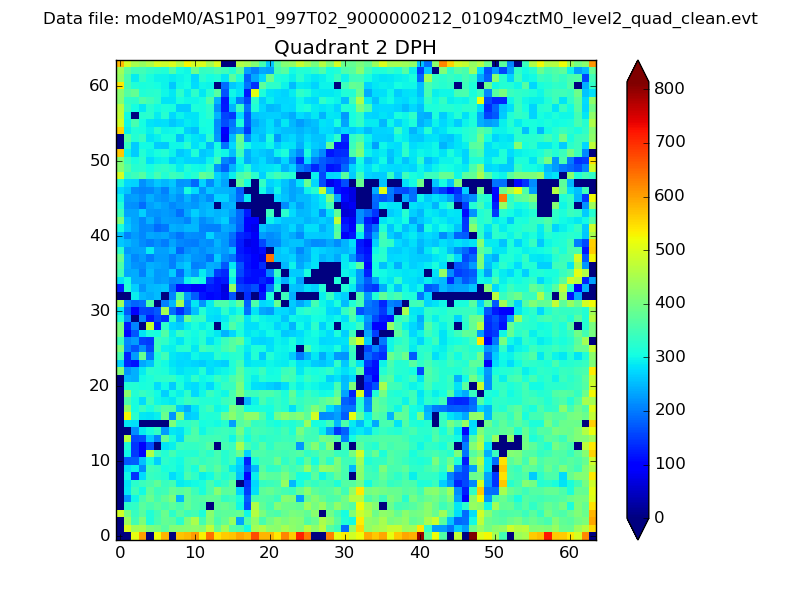
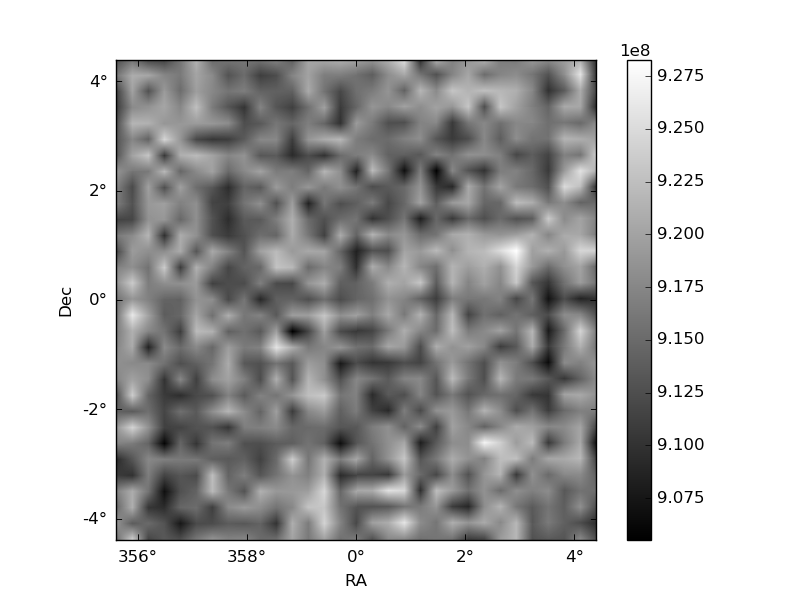
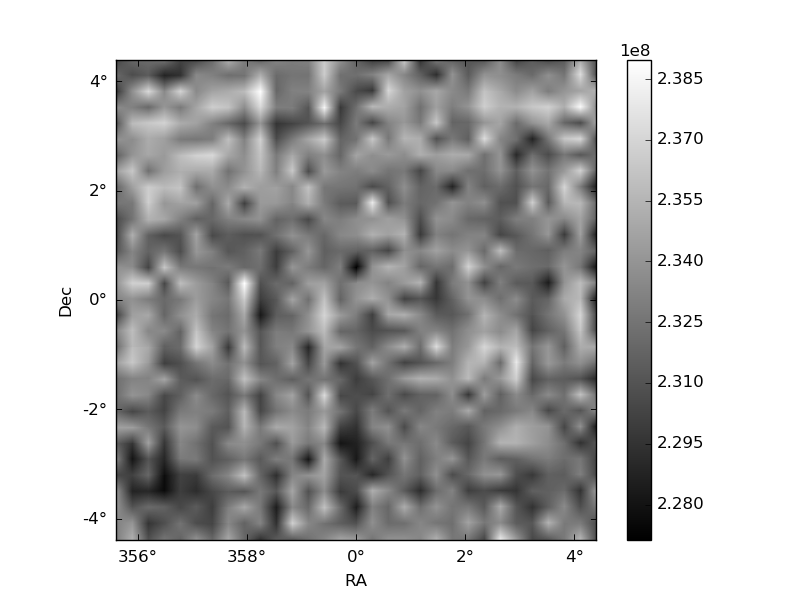
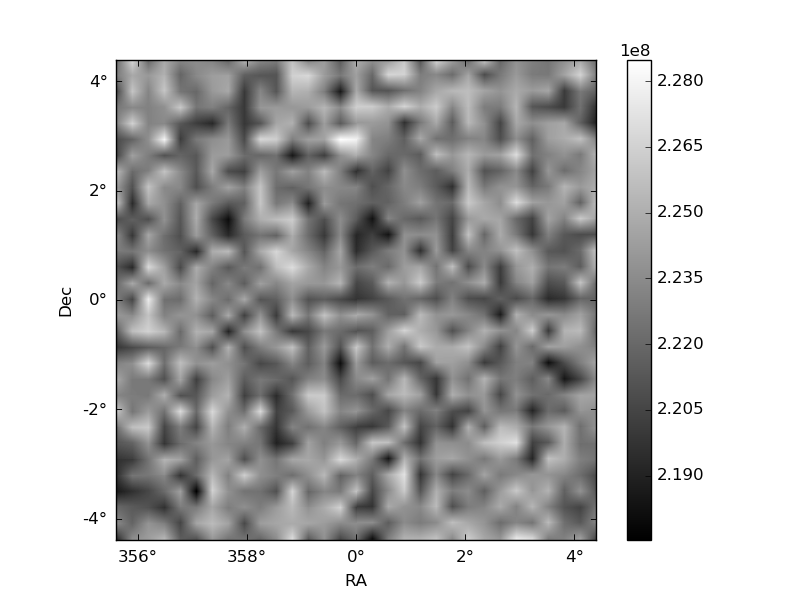
Histogram calculated using DETX and DETY for each event in the final _common_clean file
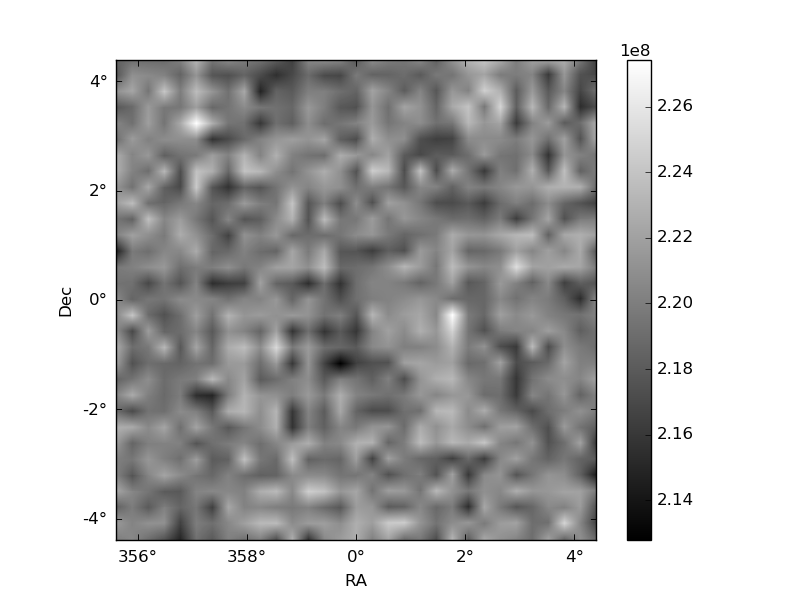
| Quadrant A | 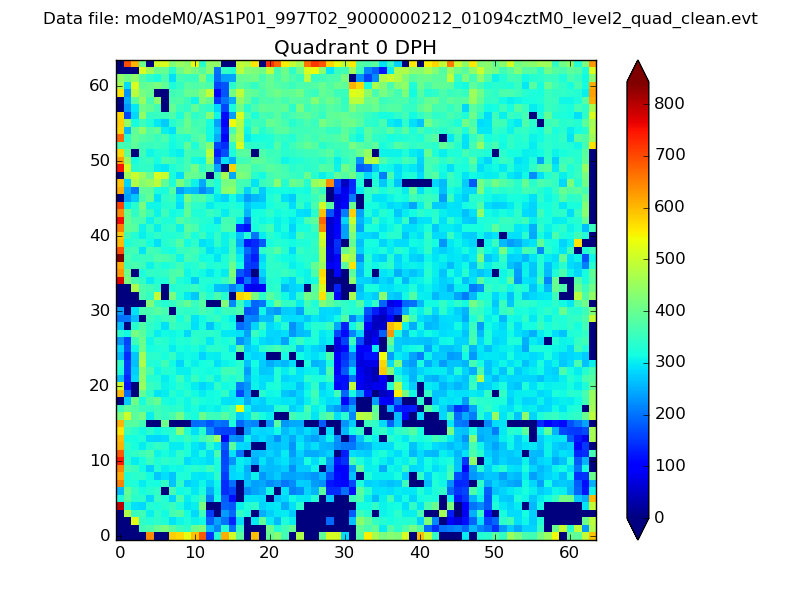 |
 |
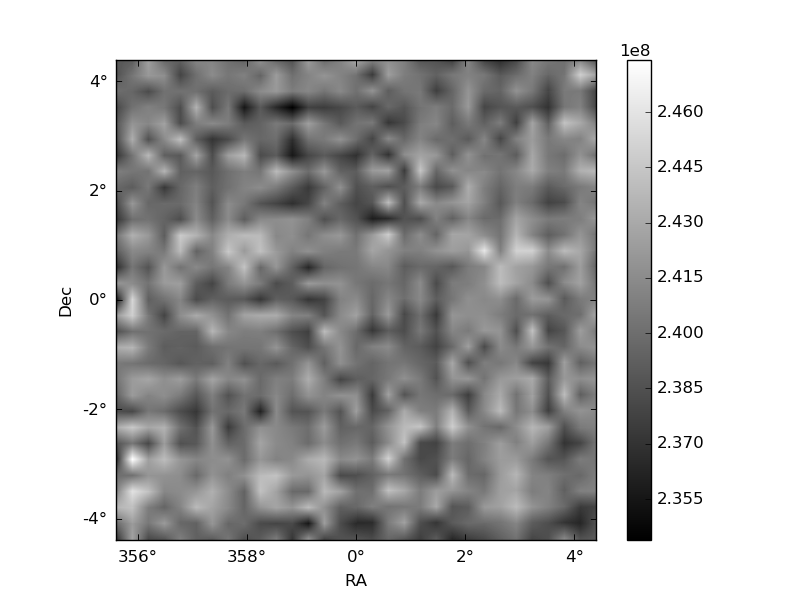
Quadrant B |
|---|---|---|---|
| Quadrant D | 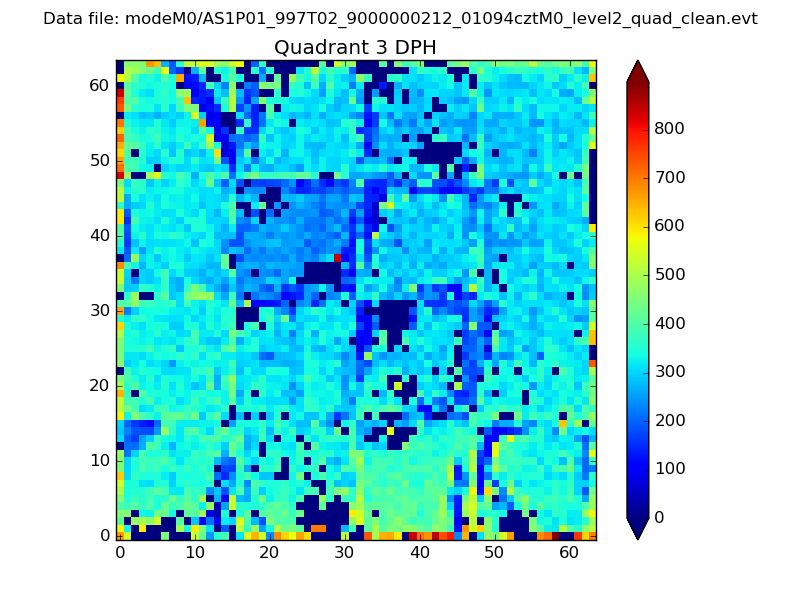 |
 |
Quadrant C |
| Plot type | Count rate plots | Images |
|---|---|---|
| Comparison with Poisson distribution Blue bars denote a histogram of data divided into 1 sec bins. Red curve is a Poisson curve with rate = median count rate of data. |
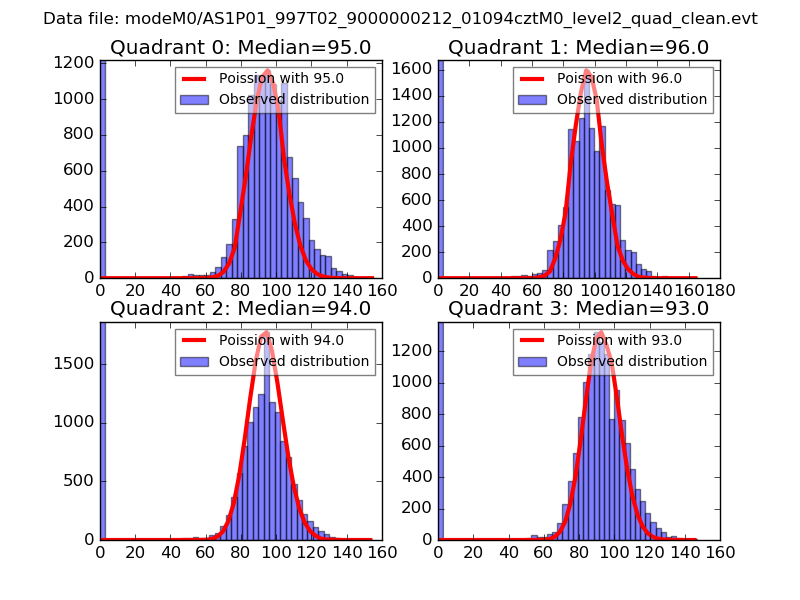 |
 |
| Quadrant-wise count rates Data is divided into 100 sec bins |
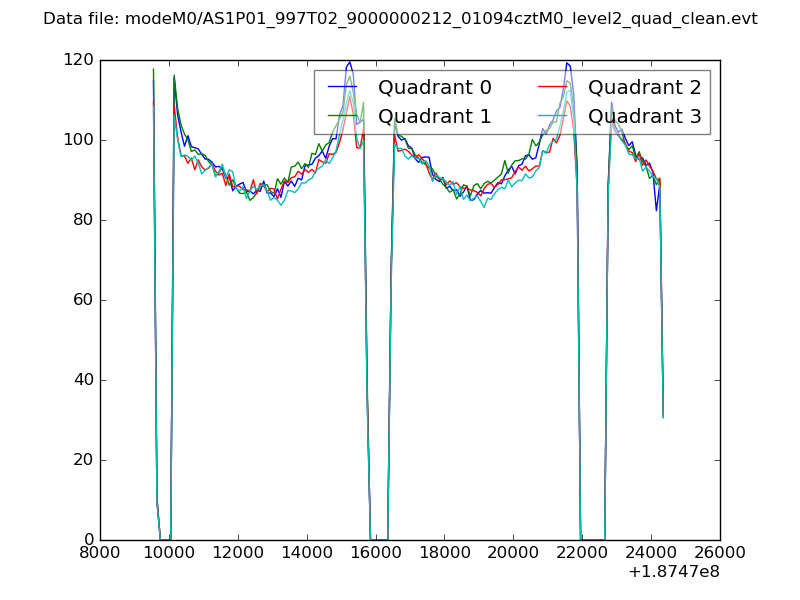 |
|
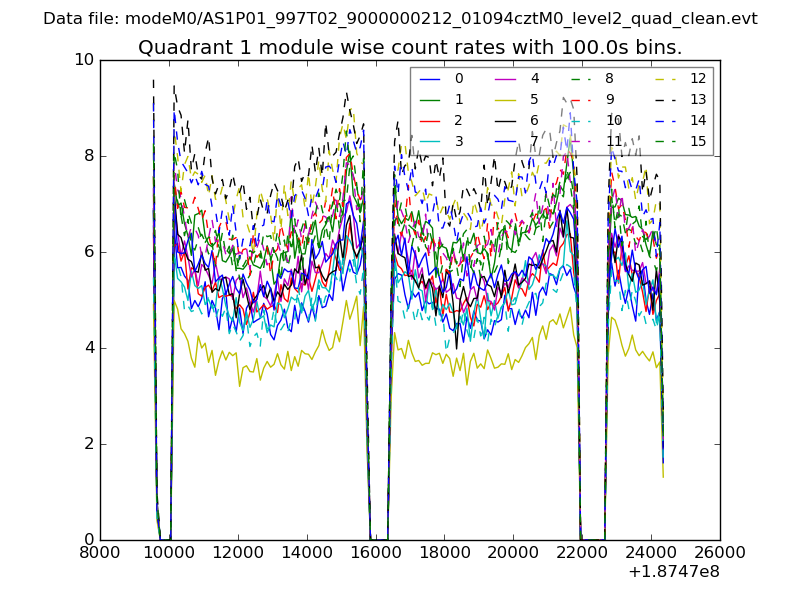
| Module-wise count rates for Quadrant A Data is divided into 100 sec bins |
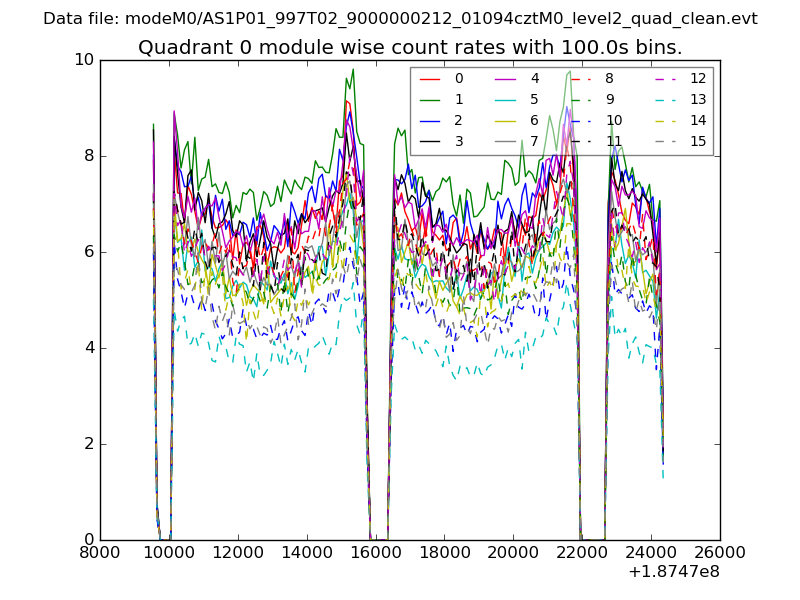 |
 |
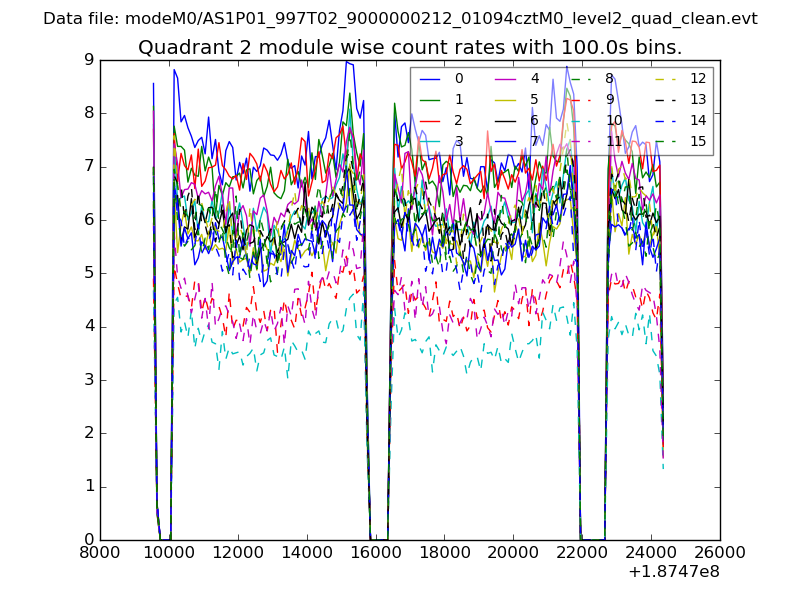
| Module-wise count rates for Quadrant B Data is divided into 100 sec bins |
 |
 |
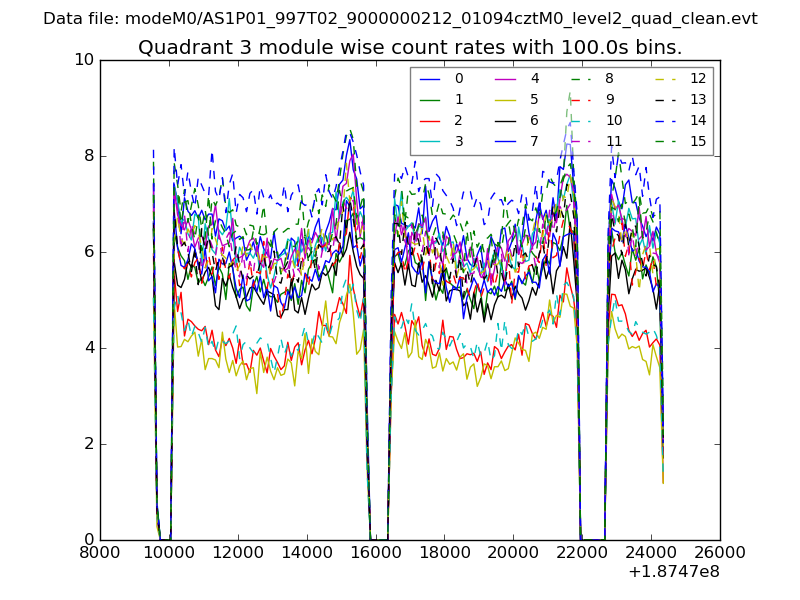
| Module-wise count rates for Quadrant C Data is divided into 100 sec bins |
 |
 |
| Module-wise count rates for Quadrant D Data is divided into 100 sec bins |
 |
 |
| Parameter | Plot |
|---|---|
| CZT HV Monitor | 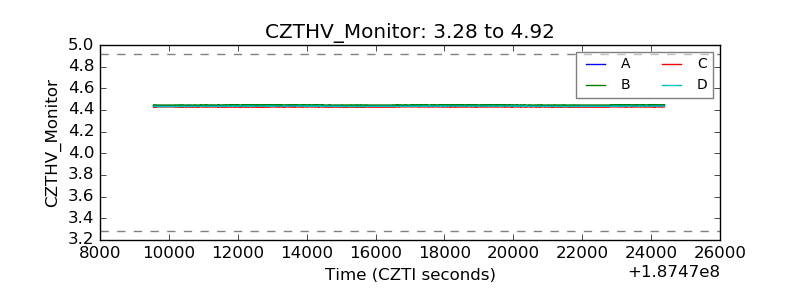 |
| D_VDD | 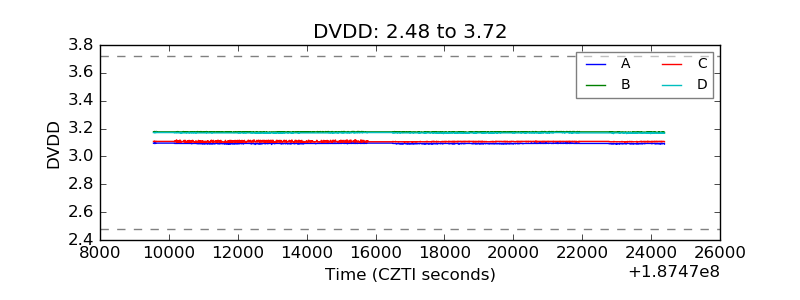 |
| Temperature 1 | 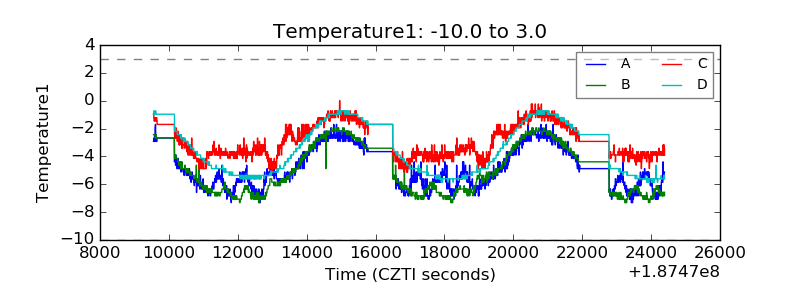 |
| Veto HV Monitor | 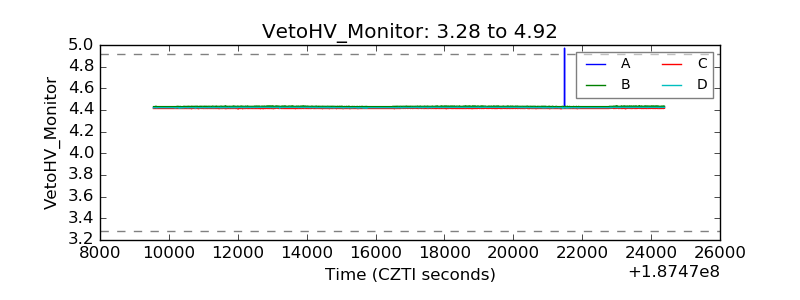 |
| Veto LLD | 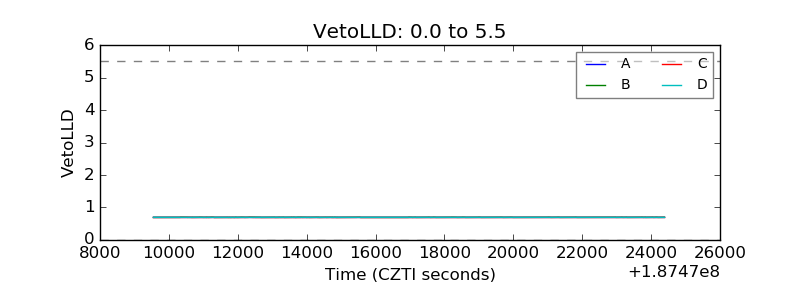 |
| Alpha Counter | 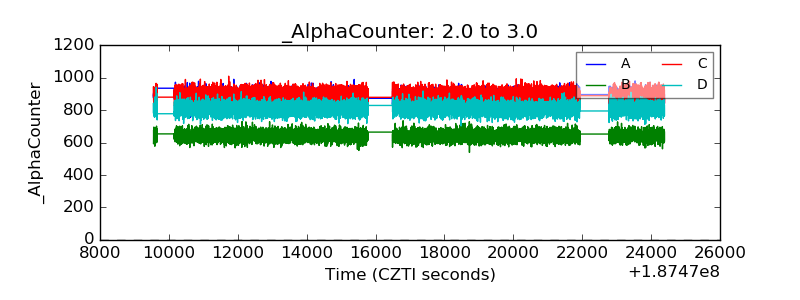 |
| _CPM_Rate | 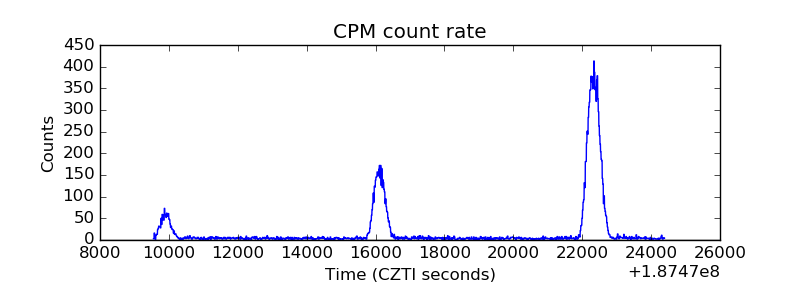 |
| CZT Counter | 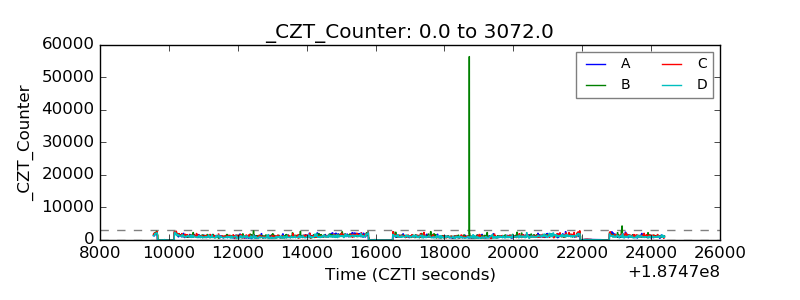 |
| +2.5 Volts monitor |  |
| +5 Volts monitor |  |
| _ROLL_ROT | 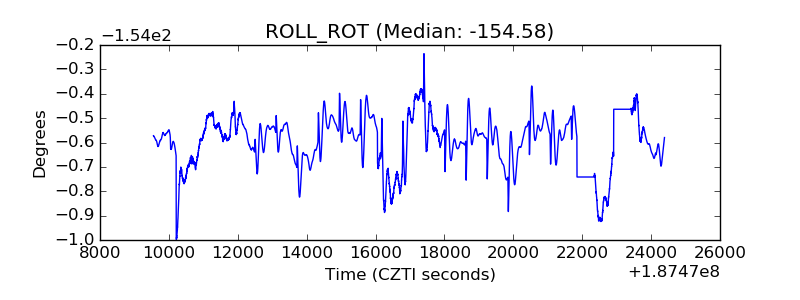 |
| _Roll_DEC | 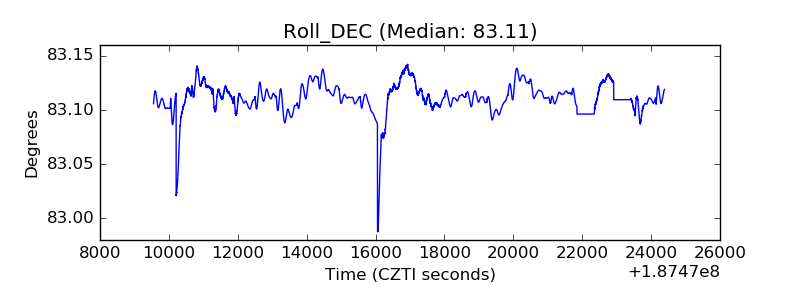 |
| _Roll_RA | 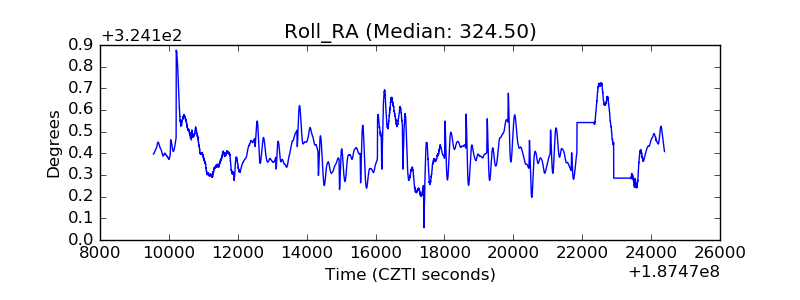 |
| Veto Counter | 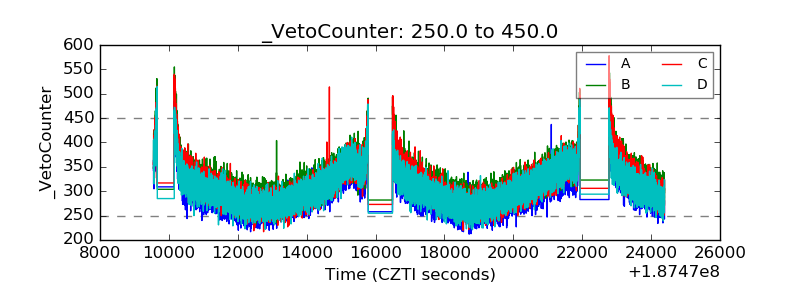 |