| Param | Original file | Final file |
|---|---|---|
| Filename | modeM0/AS1P01_997T02_9000000212_01098cztM0_level2.evt | modeM0/AS1P01_997T02_9000000212_01098cztM0_level2_quad_clean.evt |
| Size (bytes) | 977,166,720 | 97,773,120 |
| Size | 931.9 MB | 93.2 MB |
| Events in quadrant A | 7,282,099 | 646,656 |
| Events in quadrant B | 7,560,027 | 653,086 |
| Events in quadrant C | 7,323,787 | 618,409 |
| Events in quadrant D | 7,017,615 | 611,860 |
| Mode M9 | |||
|---|---|---|---|
| Quadrant | BADHDUFLAG | Total packets | Discarded packets |
| A | 0 | 12 | 0 |
| B | 0 | 12 | 0 |
| C | 0 | 12 | 0 |
| D | 0 | 12 | 0 |
| Mode M0 | |||
|---|---|---|---|
| Quadrant | BADHDUFLAG | Total packets | Discarded packets |
| A | 0 | 26003 | 2 |
| B | 0 | 26858 | 1 |
| C | 0 | 26167 | 1 |
| D | 0 | 25286 | 1 |
| Mode SS | |||
|---|---|---|---|
| Quadrant | BADHDUFLAG | Total packets | Discarded packets |
| A | 0 | 124 | 0 |
| B | 0 | 124 | 0 |
| C | 0 | 124 | 0 |
| D | 0 | 124 | 0 |
| Quadrant | Total seconds | Saturated seconds | Saturation percentage |
|---|---|---|---|
| A | 6180 | 42 | 0.679612% |
| B | 6180 | 46 | 0.744337% |
| C | 6180 | 47 | 0.760518% |
| D | 6180 | 138 | 2.233010% |
Noise dominated data is calculated using 1-second bins in cleaned event files. If a bin has >2000 counts, and if more than 50% of those come from <1% of pixels, then it is considered to be noise-dominated and hence unusable.
| Quadrant | # 1 sec bins | Bins with >0 counts | Bins with >2000 counts | High rate bins dominated by noise | Noise dominated (total time) | Noise dominated (detector-on time) | Marked lightcurve |
|---|---|---|---|---|---|---|---|
| A | 7340 | 6180 | 152 | 152 | 2.07% | 2.46% | 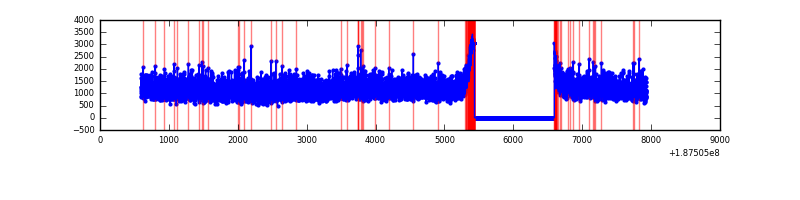 |
| B | 7340 | 6180 | 181 | 181 | 2.47% | 2.93% | 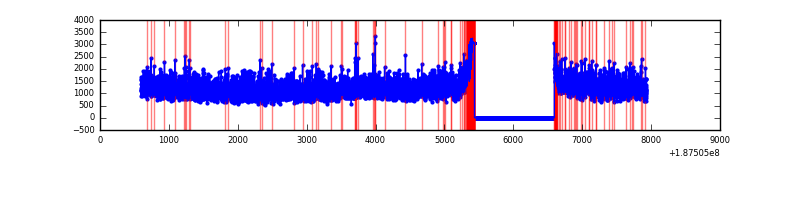 |
| C | 7340 | 6180 | 188 | 188 | 2.56% | 3.04% | 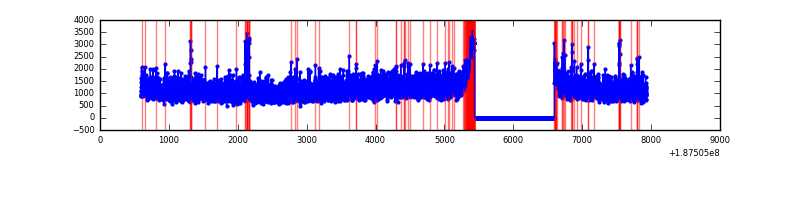 |
| D | 7340 | 6180 | 313 | 313 | 4.26% | 5.06% | 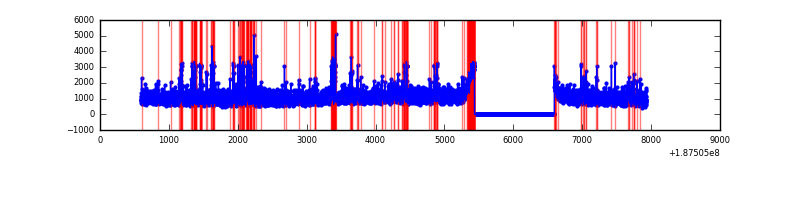 |
Top three noisy pixels from each quadrant. If the there are fewer than three noisy pixels in the level2.evt file, extra rows are filled as -1
| Pixel properties | Quadrant properties | ||||||
|---|---|---|---|---|---|---|---|
| Quadrant | DetID | PixID | Counts | Sigma | Mean | Median | Sigma |
| A | 4 | 32 | 11933 | 22.29 | 1891 | 1906 | 449.9 |
| A | 13 | 9 | 8504 | 14.66 | 1891 | 1906 | 449.9 |
| A | 11 | 79 | 7588 | 12.63 | 1891 | 1906 | 449.9 |
| B | 0 | 190 | 28011 | 55.82 | 1967 | 1976 | 466.4 |
| B | 5 | 249 | 24006 | 47.23 | 1967 | 1976 | 466.4 |
| B | 15 | 85 | 18099 | 34.57 | 1967 | 1976 | 466.4 |
| C | 15 | 241 | 290598 | 593.78 | 1753 | 1808 | 486.4 |
| C | 10 | 5 | 95832 | 193.32 | 1753 | 1808 | 486.4 |
| C | 10 | 207 | 53039 | 105.33 | 1753 | 1808 | 486.4 |
| D | 10 | 125 | 84956 | 153.66 | 1787 | 1801 | 541.1 |
| D | 2 | 216 | 57144 | 102.27 | 1787 | 1801 | 541.1 |
| D | 2 | 14 | 11626 | 18.16 | 1787 | 1801 | 541.1 |
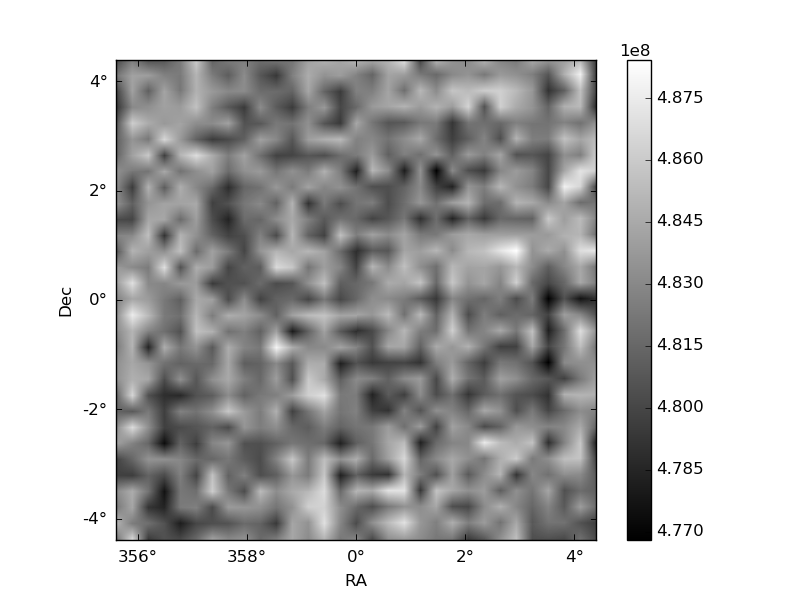
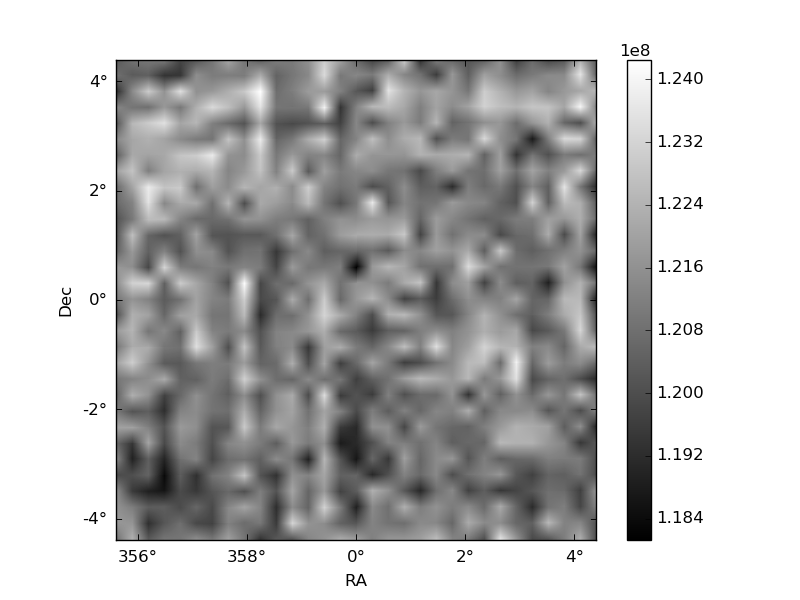
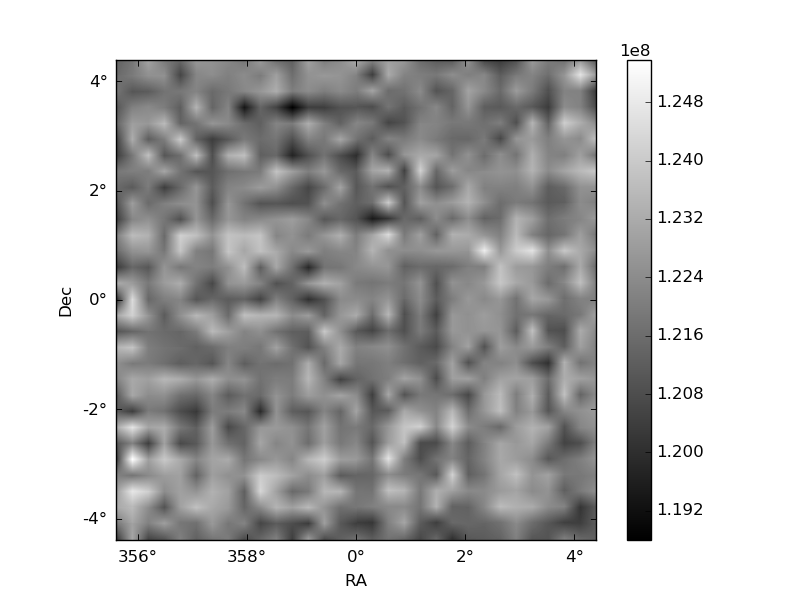
Histogram calculated using DETX and DETY for each event in the final _common_clean file
| Quadrant A | 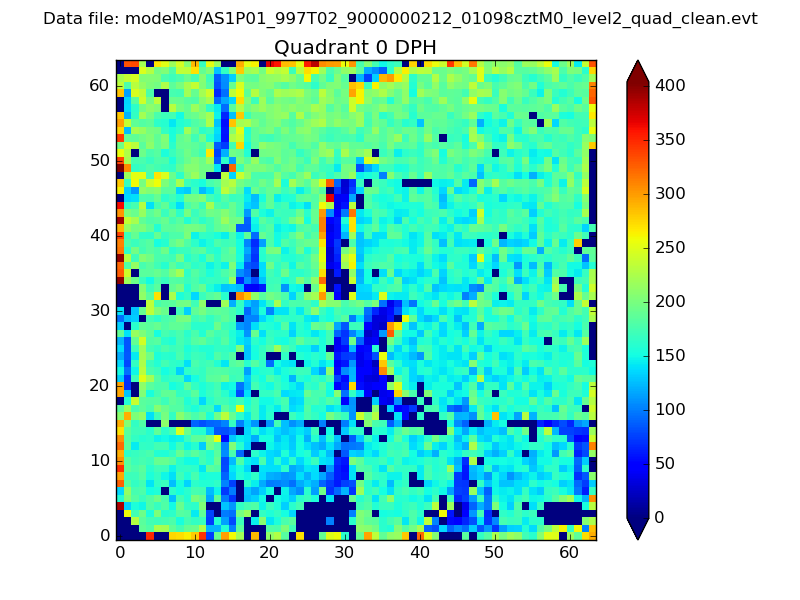 |
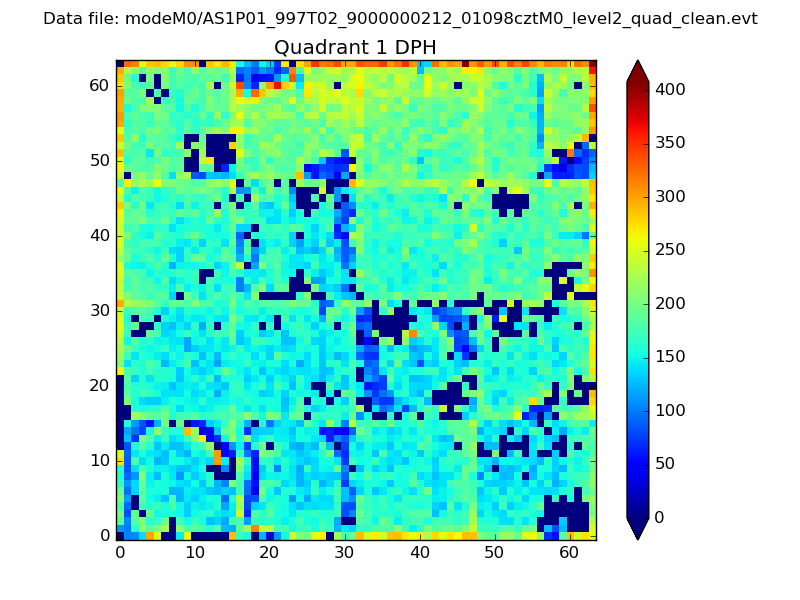 |
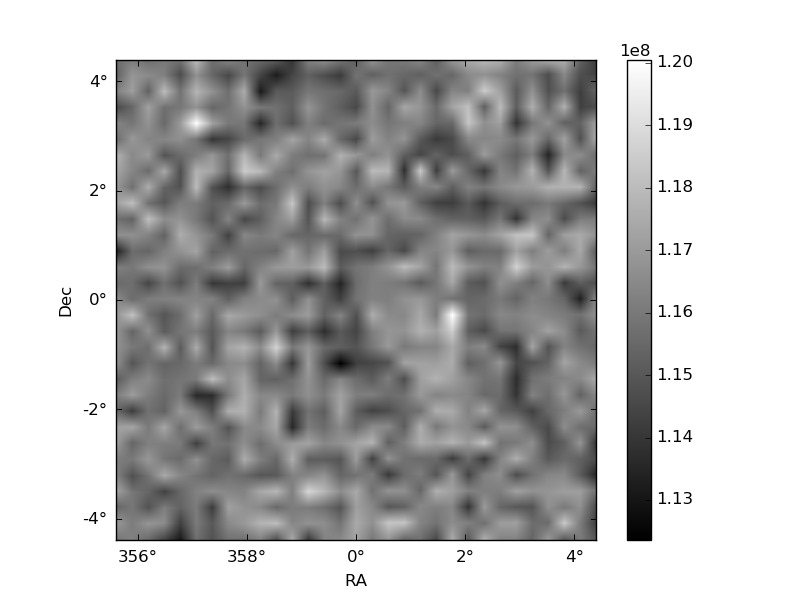
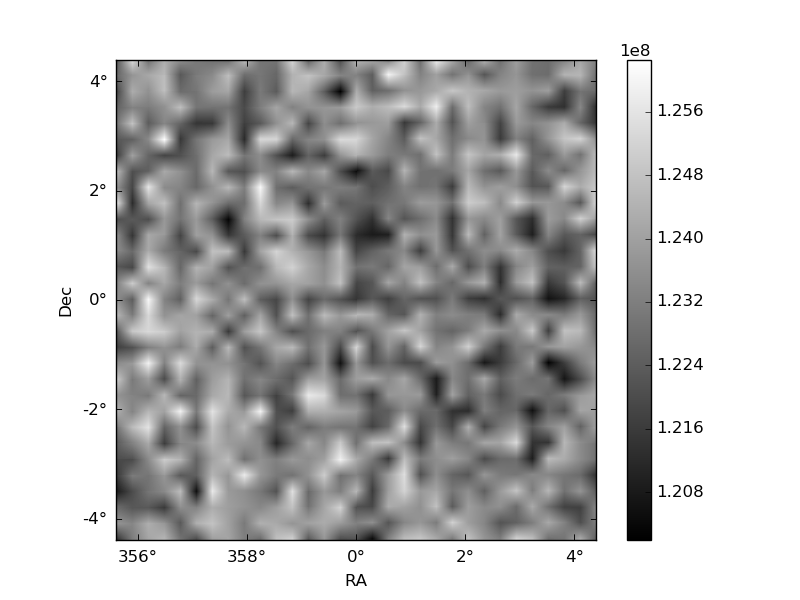
Quadrant B |
|---|---|---|---|
| Quadrant D | 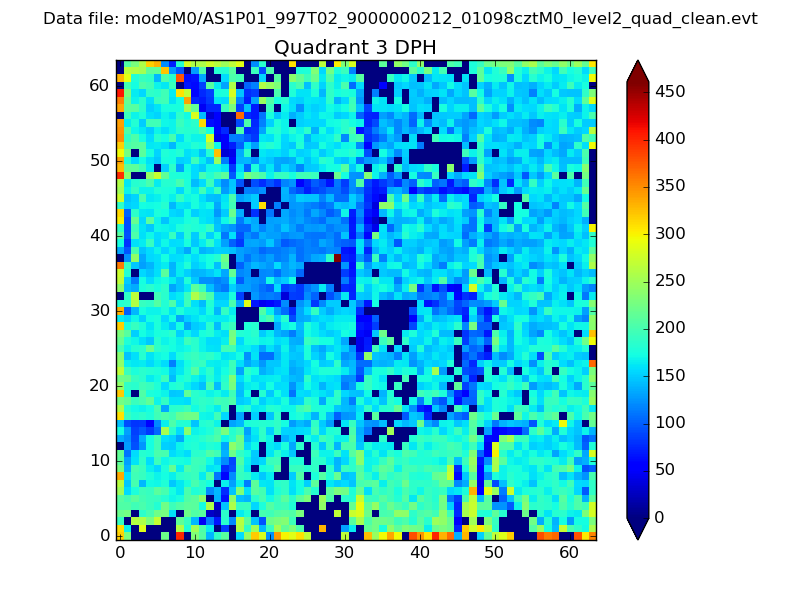 |
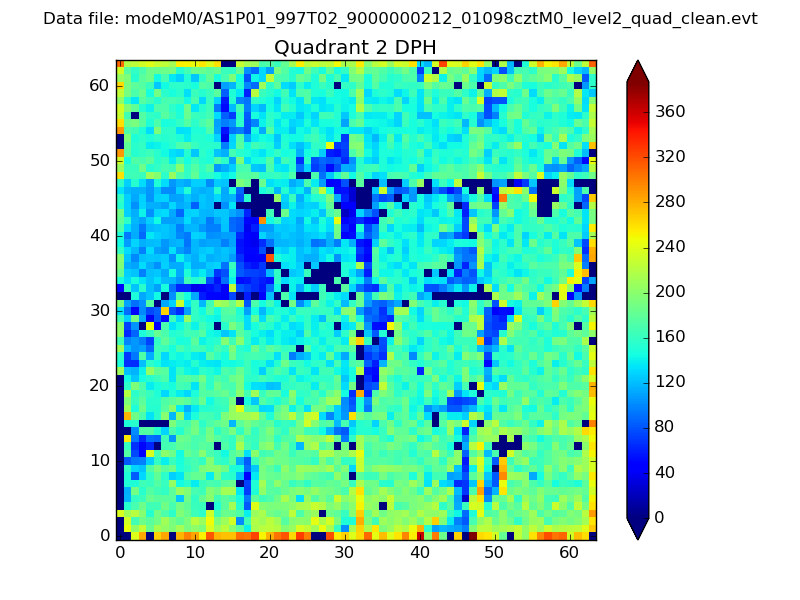 |
Quadrant C |
| Plot type | Count rate plots | Images |
|---|---|---|
| Comparison with Poisson distribution Blue bars denote a histogram of data divided into 1 sec bins. Red curve is a Poisson curve with rate = median count rate of data. |
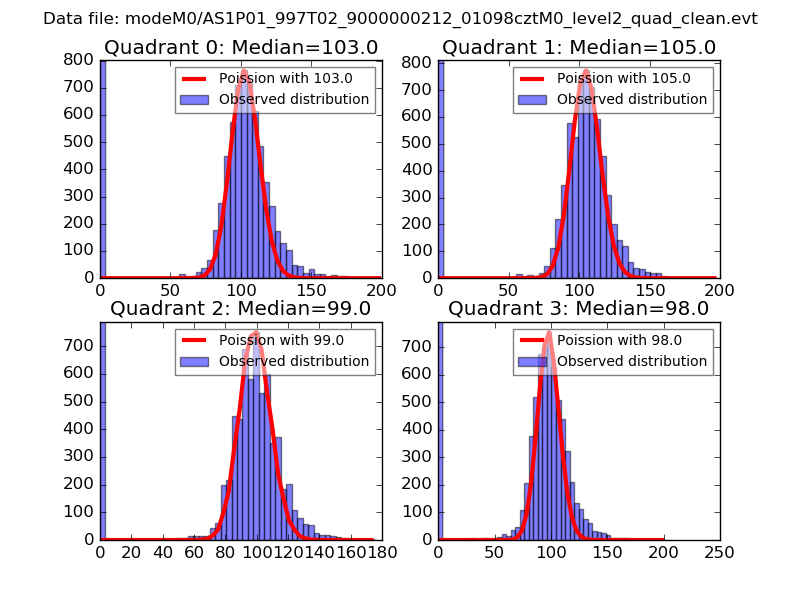 |
 |
| Quadrant-wise count rates Data is divided into 100 sec bins |
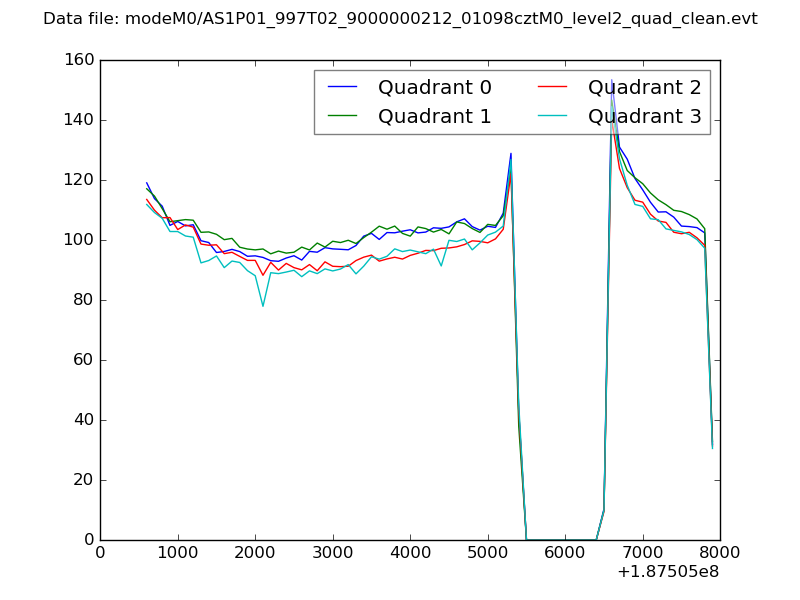 |
|
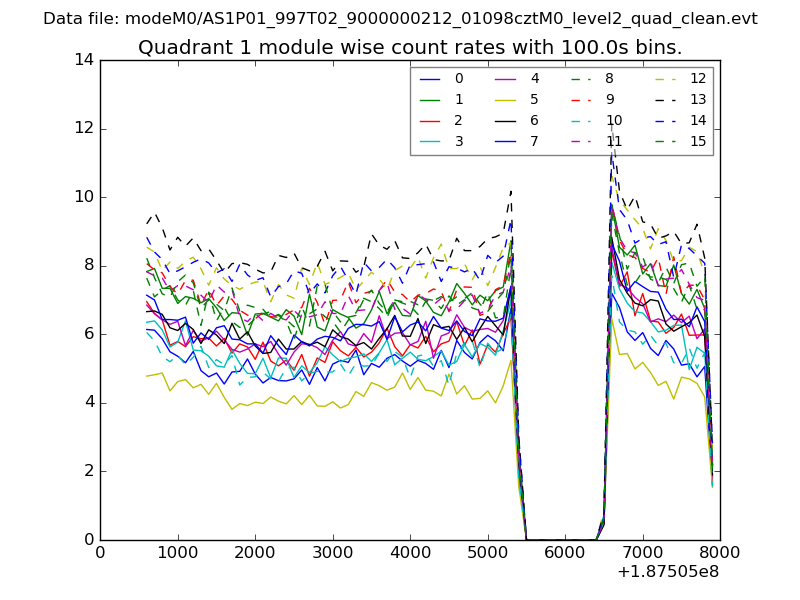
| Module-wise count rates for Quadrant A Data is divided into 100 sec bins |
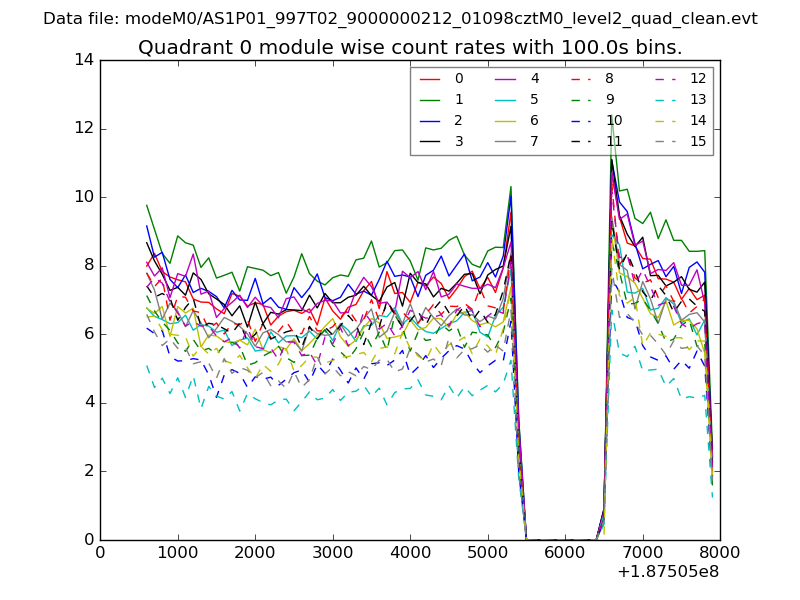 |
 |
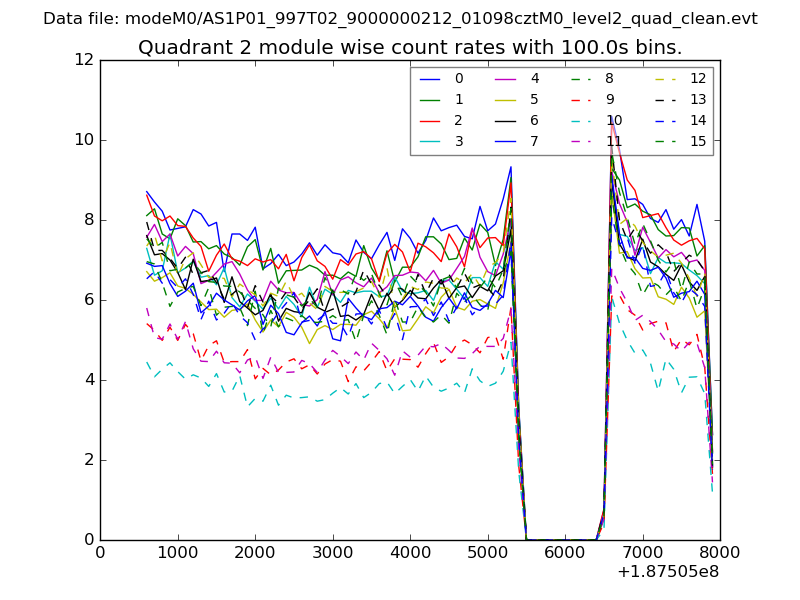
| Module-wise count rates for Quadrant B Data is divided into 100 sec bins |
 |
 |
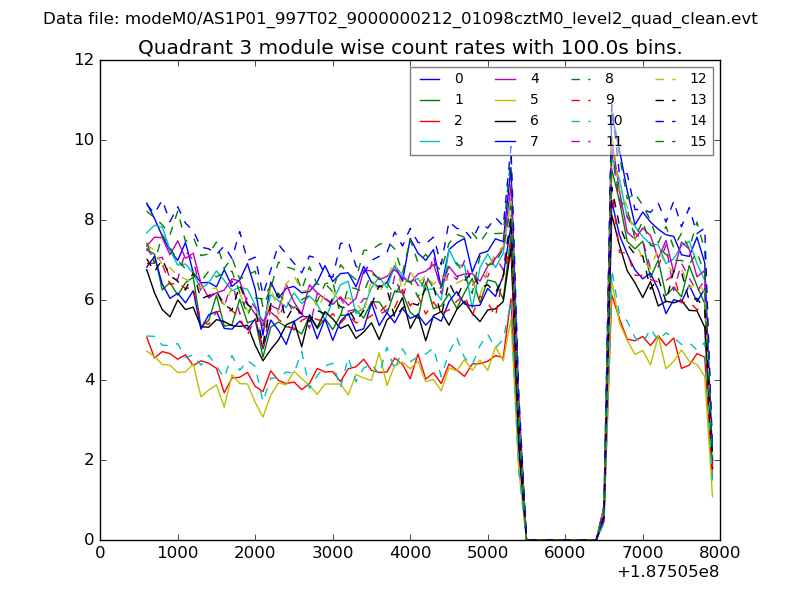
| Module-wise count rates for Quadrant C Data is divided into 100 sec bins |
 |
 |
| Module-wise count rates for Quadrant D Data is divided into 100 sec bins |
 |
 |
| Parameter | Plot |
|---|---|
| CZT HV Monitor | 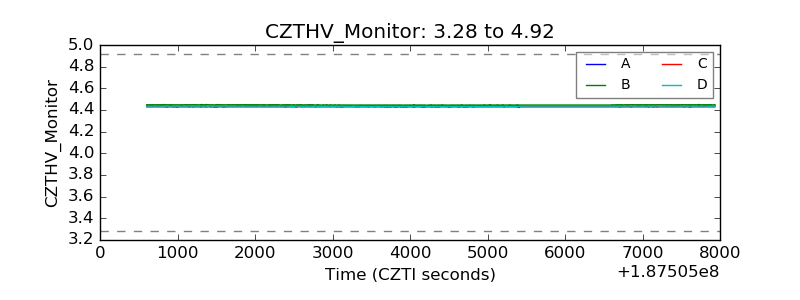 |
| D_VDD |  |
| Temperature 1 | 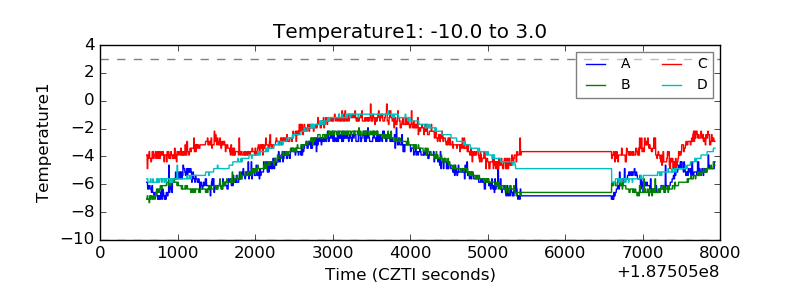 |
| Veto HV Monitor | 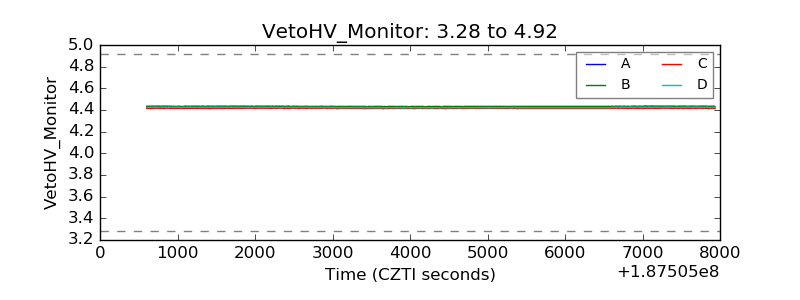 |
| Veto LLD | 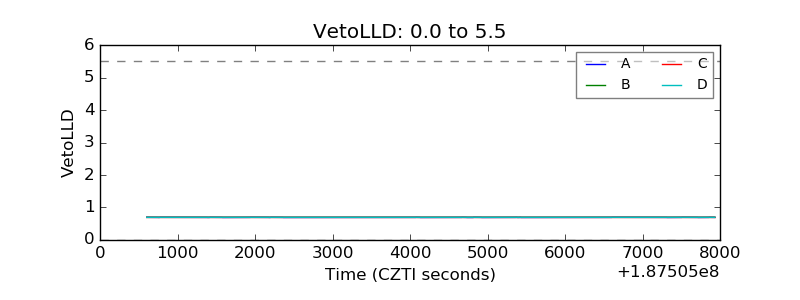 |
| Alpha Counter | 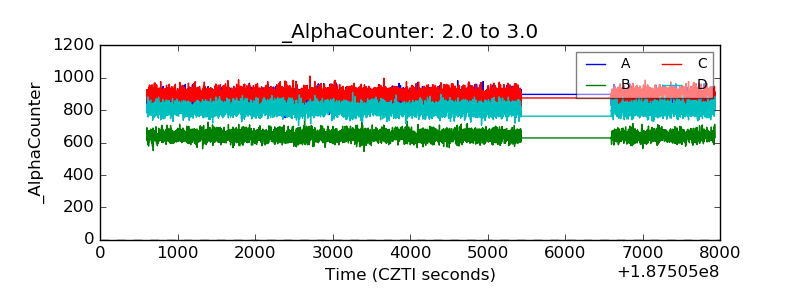 |
| _CPM_Rate | 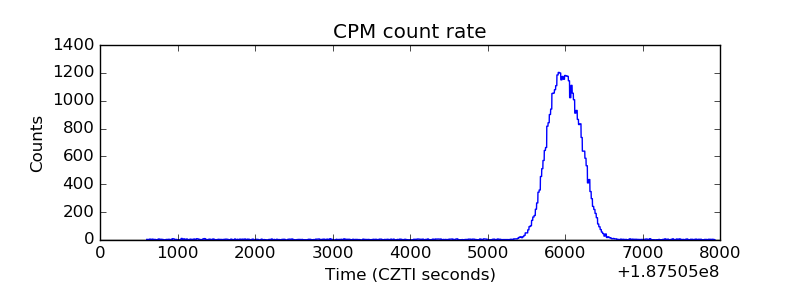 |
| CZT Counter | 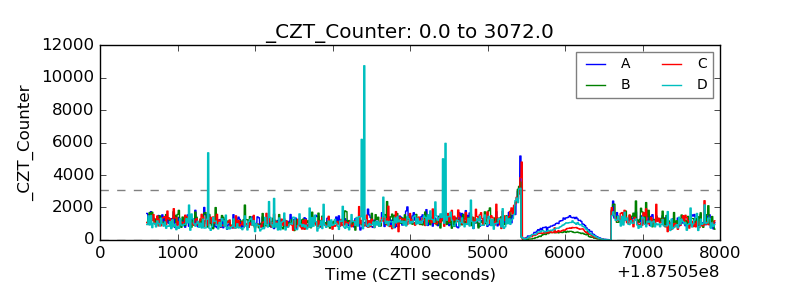 |
| +2.5 Volts monitor | 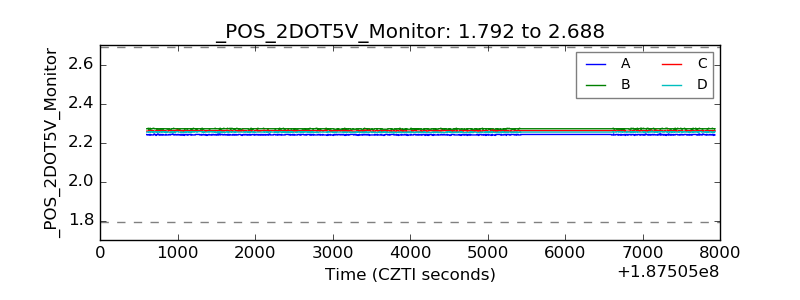 |
| +5 Volts monitor | 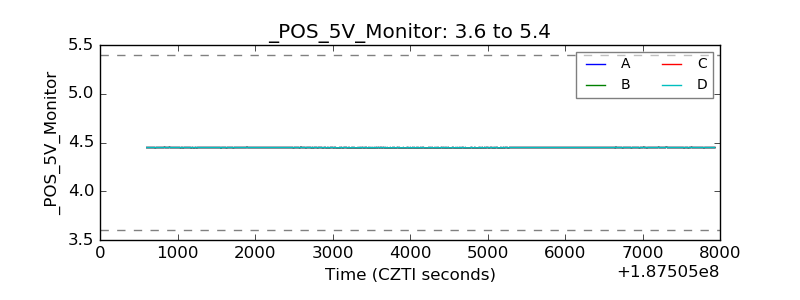 |
| _ROLL_ROT | 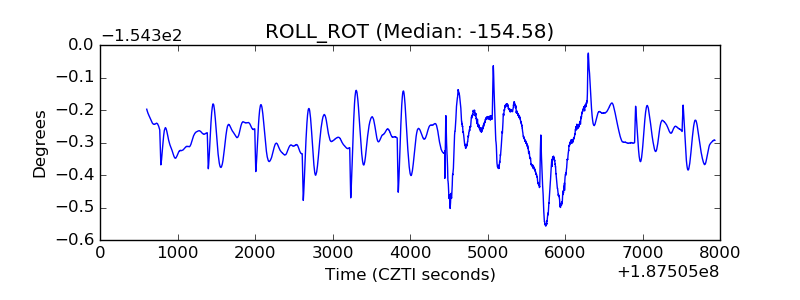 |
| _Roll_DEC | 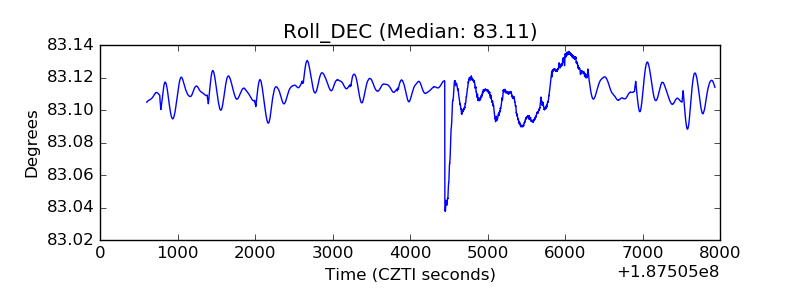 |
| _Roll_RA | 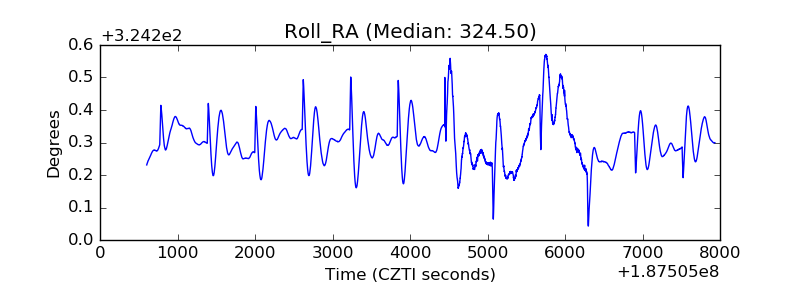 |
| Veto Counter | 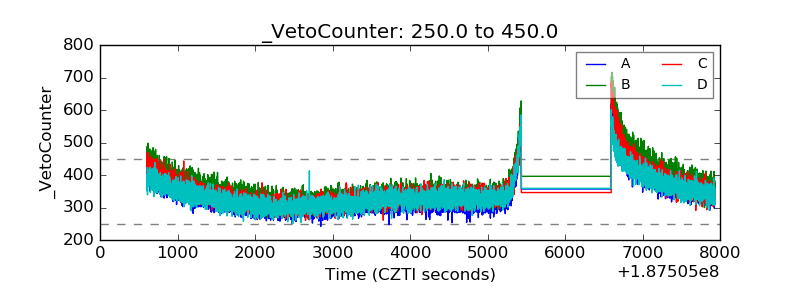 |