| Param | Original file | Final file |
|---|---|---|
| Filename | modeM0/AS1P01_997T02_9000000212_01100cztM0_level2.evt | modeM0/AS1P01_997T02_9000000212_01100cztM0_level2_quad_clean.evt |
| Size (bytes) | 1,043,884,800 | 97,096,320 |
| Size | 995.5 MB | 92.6 MB |
| Events in quadrant A | 7,436,479 | 652,908 |
| Events in quadrant B | 7,693,672 | 654,200 |
| Events in quadrant C | 8,176,506 | 611,463 |
| Events in quadrant D | 7,900,440 | 592,697 |
| Mode M9 | |||
|---|---|---|---|
| Quadrant | BADHDUFLAG | Total packets | Discarded packets |
| A | 0 | 11 | 0 |
| B | 0 | 11 | 0 |
| C | 0 | 11 | 0 |
| D | 0 | 11 | 0 |
| Mode M0 | |||
|---|---|---|---|
| Quadrant | BADHDUFLAG | Total packets | Discarded packets |
| A | 0 | 26482 | 2 |
| B | 0 | 27203 | 1 |
| C | 0 | 28667 | 1 |
| D | 0 | 27949 | 1 |
| Mode SS | |||
|---|---|---|---|
| Quadrant | BADHDUFLAG | Total packets | Discarded packets |
| A | 0 | 126 | 0 |
| B | 0 | 126 | 0 |
| C | 0 | 126 | 0 |
| D | 0 | 126 | 0 |
| Quadrant | Total seconds | Saturated seconds | Saturation percentage |
|---|---|---|---|
| A | 6140 | 46 | 0.749186% |
| B | 6140 | 52 | 0.846906% |
| C | 6140 | 196 | 3.192182% |
| D | 6140 | 445 | 7.247557% |
Noise dominated data is calculated using 1-second bins in cleaned event files. If a bin has >2000 counts, and if more than 50% of those come from <1% of pixels, then it is considered to be noise-dominated and hence unusable.
| Quadrant | # 1 sec bins | Bins with >0 counts | Bins with >2000 counts | High rate bins dominated by noise | Noise dominated (total time) | Noise dominated (detector-on time) | Marked lightcurve |
|---|---|---|---|---|---|---|---|
| A | 7300 | 6140 | 233 | 233 | 3.19% | 3.79% | 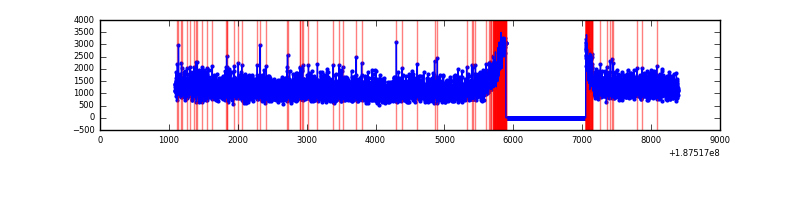 |
| B | 7300 | 6140 | 262 | 262 | 3.59% | 4.27% | 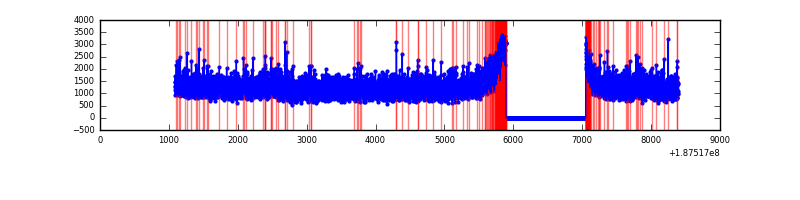 |
| C | 7300 | 6141 | 575 | 575 | 7.88% | 9.36% | 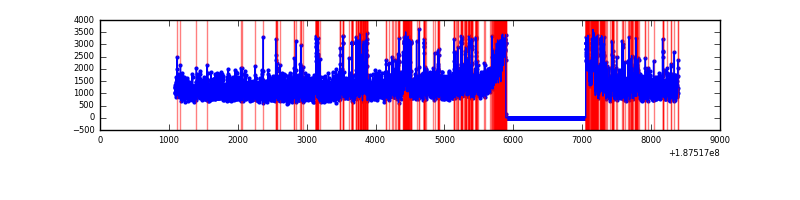 |
| D | 7300 | 6140 | 690 | 690 | 9.45% | 11.24% | 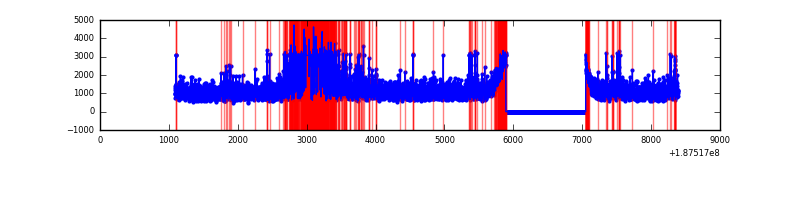 |
Top three noisy pixels from each quadrant. If the there are fewer than three noisy pixels in the level2.evt file, extra rows are filled as -1
| Pixel properties | Quadrant properties | ||||||
|---|---|---|---|---|---|---|---|
| Quadrant | DetID | PixID | Counts | Sigma | Mean | Median | Sigma |
| A | 4 | 32 | 38050 | 77.8 | 1927 | 1939 | 464.2 |
| A | 11 | 79 | 6883 | 10.65 | 1927 | 1939 | 464.2 |
| A | 3 | 111 | 6069 | 8.9 | 1927 | 1939 | 464.2 |
| B | 4 | 187 | 77890 | 161.86 | 1982 | 1989 | 468.9 |
| B | 5 | 249 | 31726 | 63.41 | 1982 | 1989 | 468.9 |
| B | 15 | 22 | 20468 | 39.41 | 1982 | 1989 | 468.9 |
| C | 10 | 207 | 938314 | 1920.54 | 1756 | 1815 | 487.6 |
| C | 15 | 241 | 287315 | 585.49 | 1756 | 1815 | 487.6 |
| C | 10 | 5 | 29443 | 56.66 | 1756 | 1815 | 487.6 |
| D | 2 | 216 | 45262 | 85.43 | 1741 | 1779 | 509.0 |
| D | 10 | 125 | 28435 | 52.37 | 1741 | 1779 | 509.0 |
| D | 2 | 14 | 25893 | 47.38 | 1741 | 1779 | 509.0 |
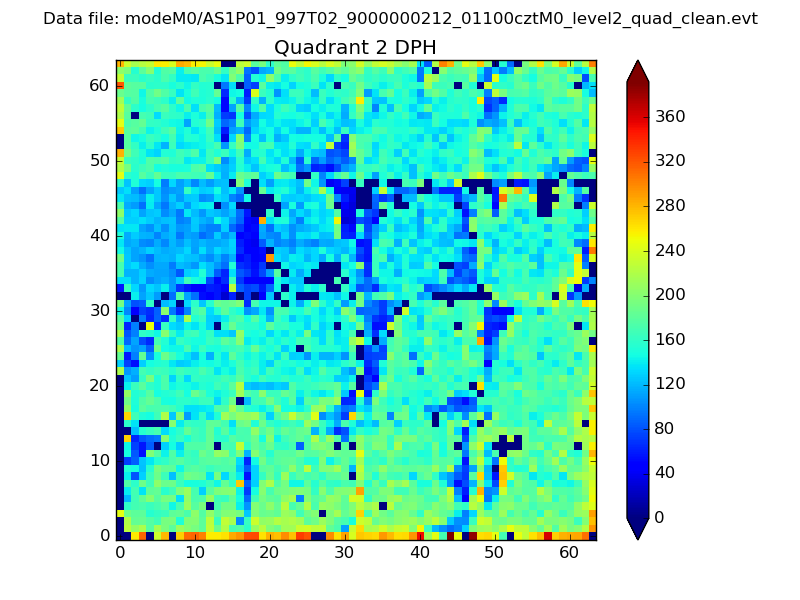
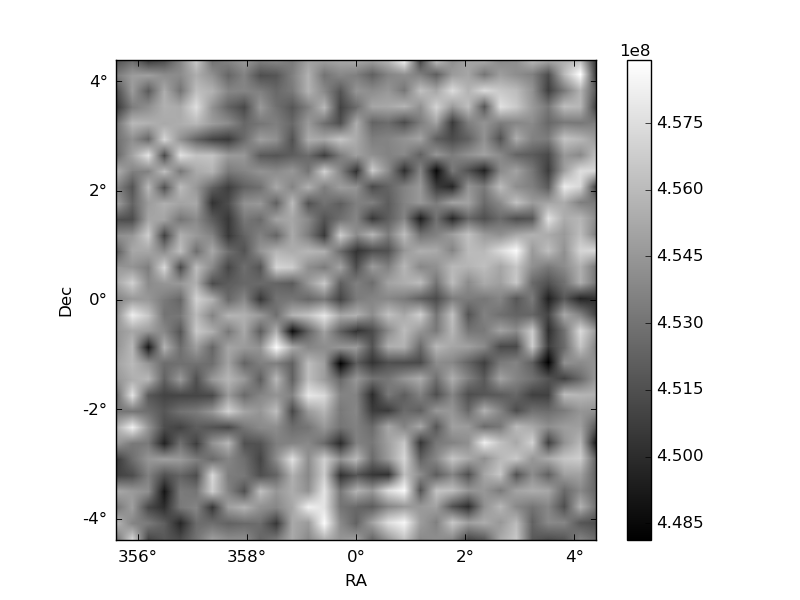
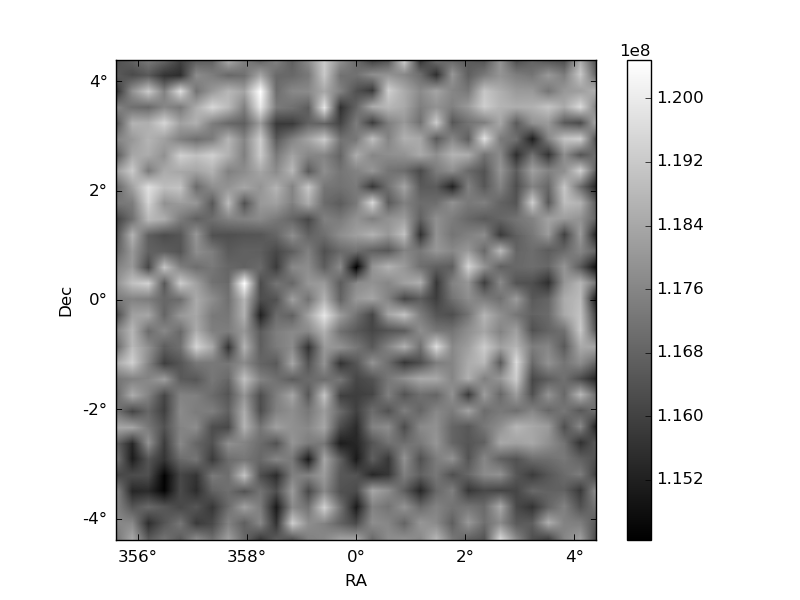
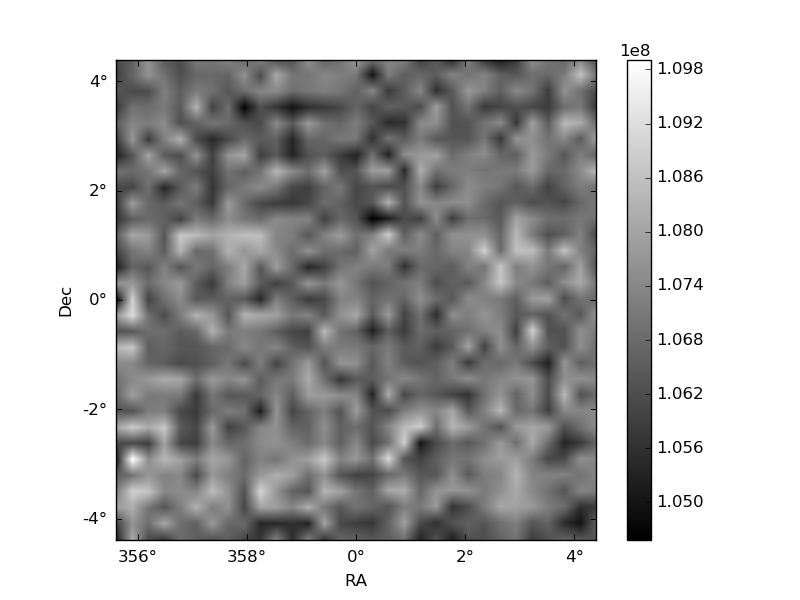
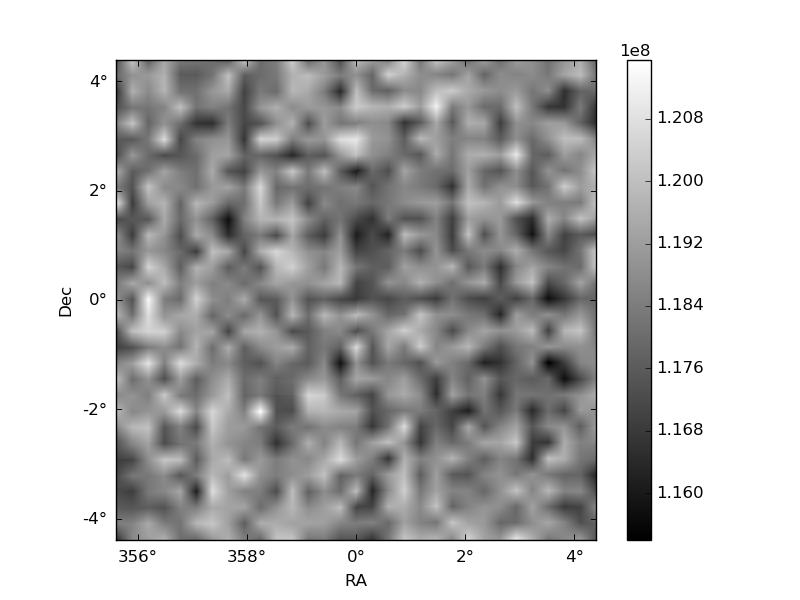
Histogram calculated using DETX and DETY for each event in the final _common_clean file
| Quadrant A | 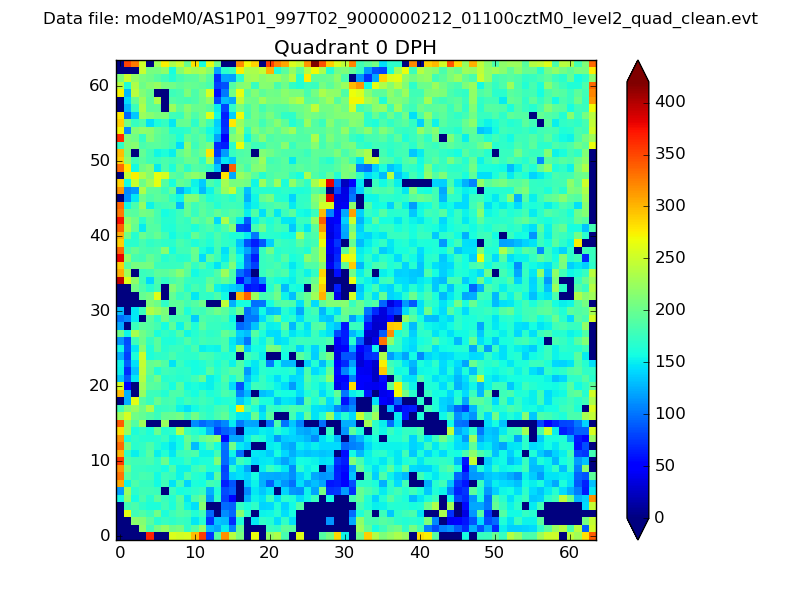 |
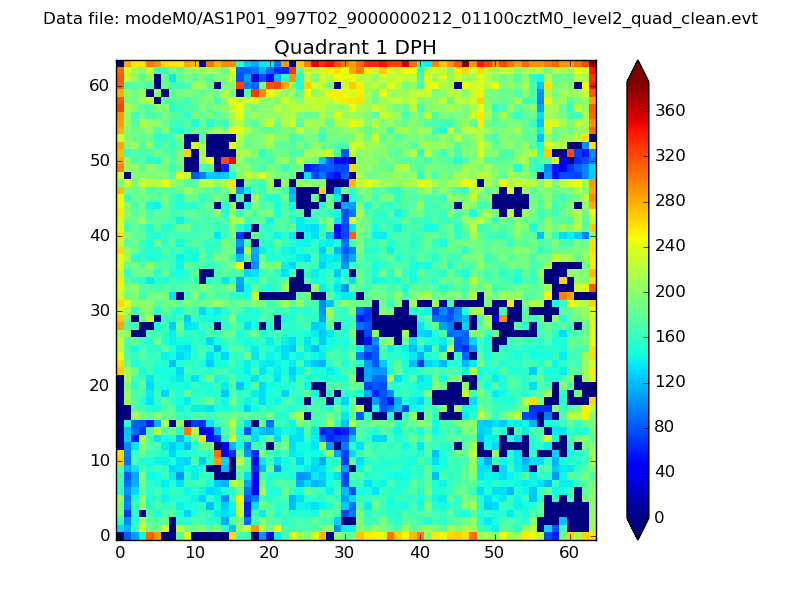 |
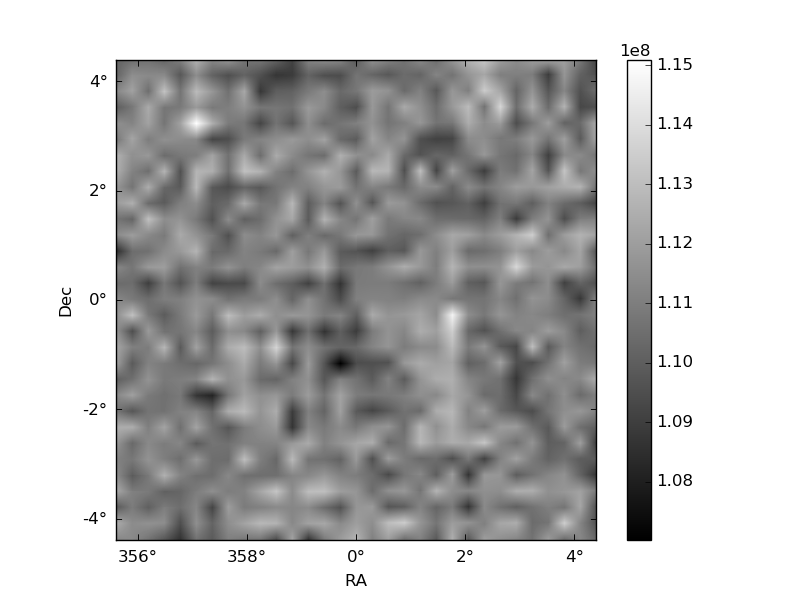
Quadrant B |
|---|---|---|---|
| Quadrant D | 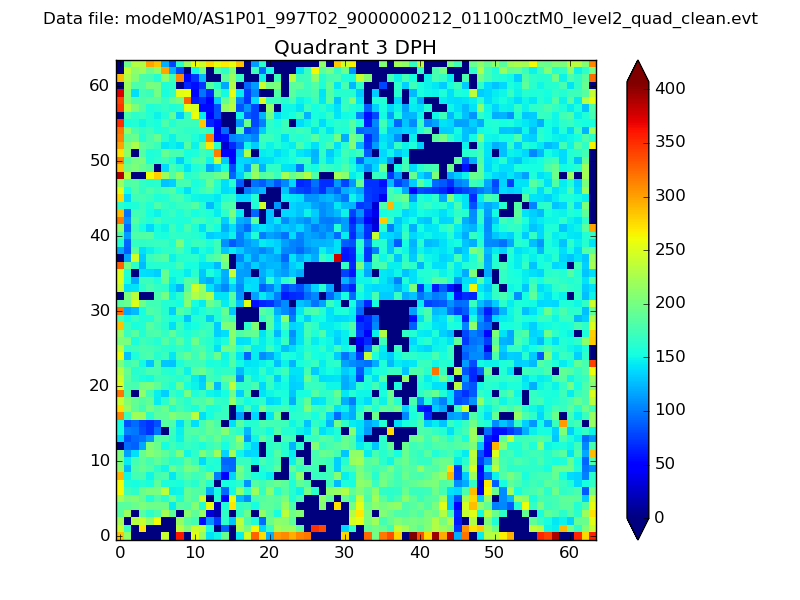 |
 |
Quadrant C |
| Plot type | Count rate plots | Images |
|---|---|---|
| Comparison with Poisson distribution Blue bars denote a histogram of data divided into 1 sec bins. Red curve is a Poisson curve with rate = median count rate of data. |
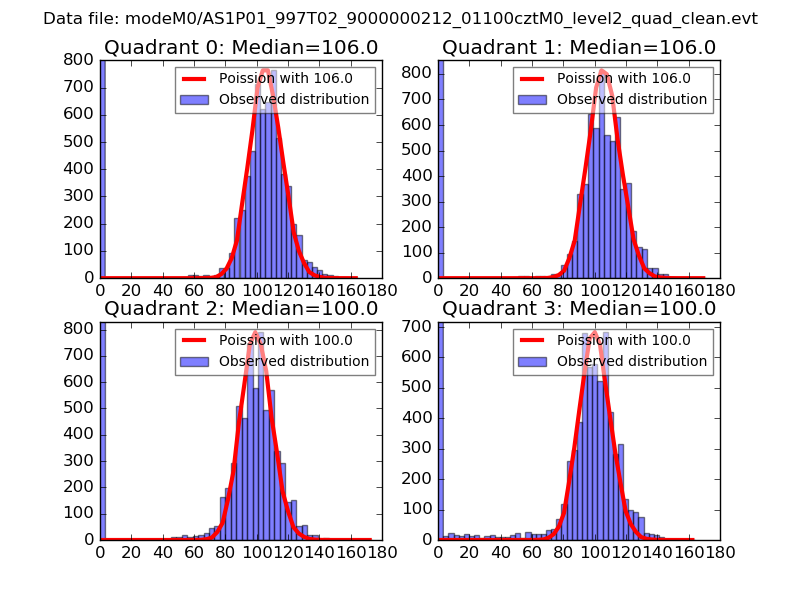 |
 |
| Quadrant-wise count rates Data is divided into 100 sec bins |
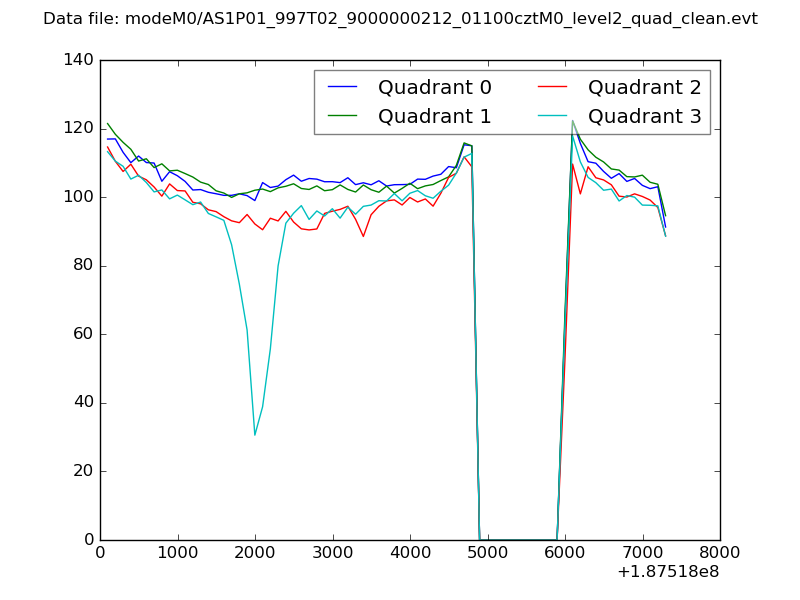 |
|
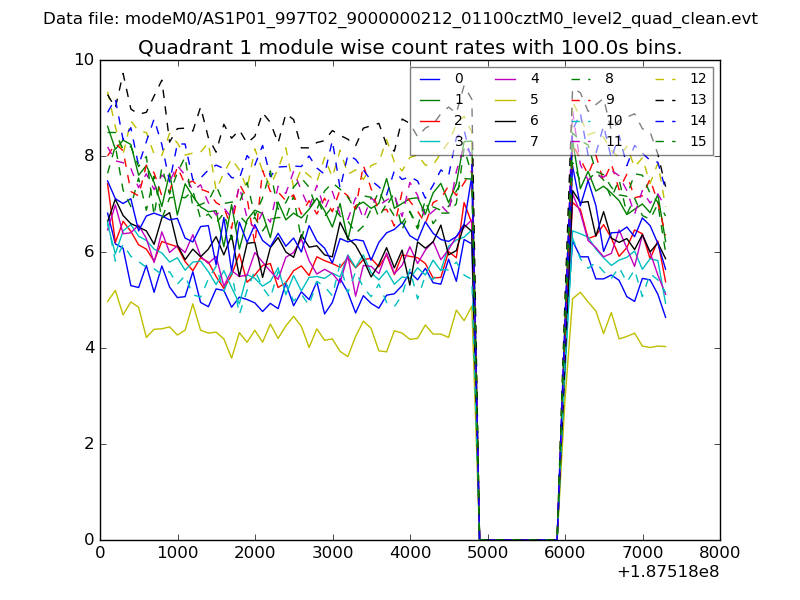
| Module-wise count rates for Quadrant A Data is divided into 100 sec bins |
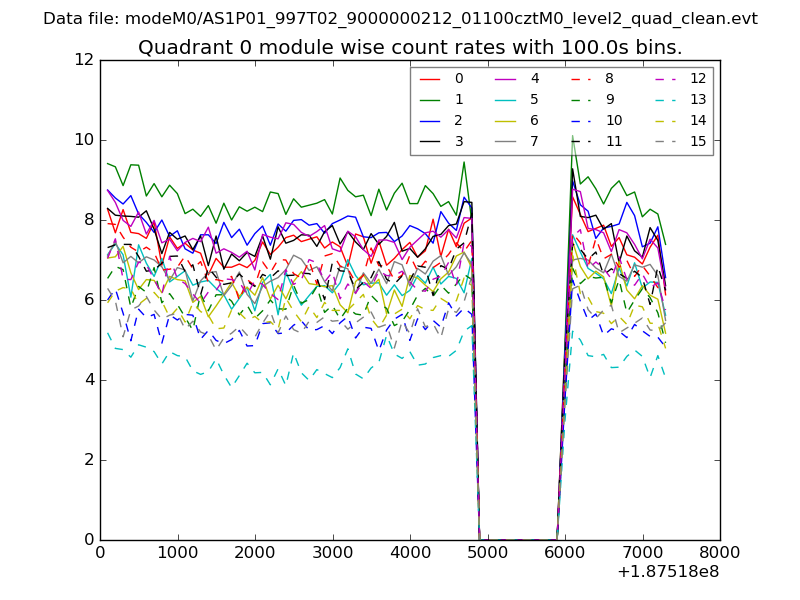 |
 |
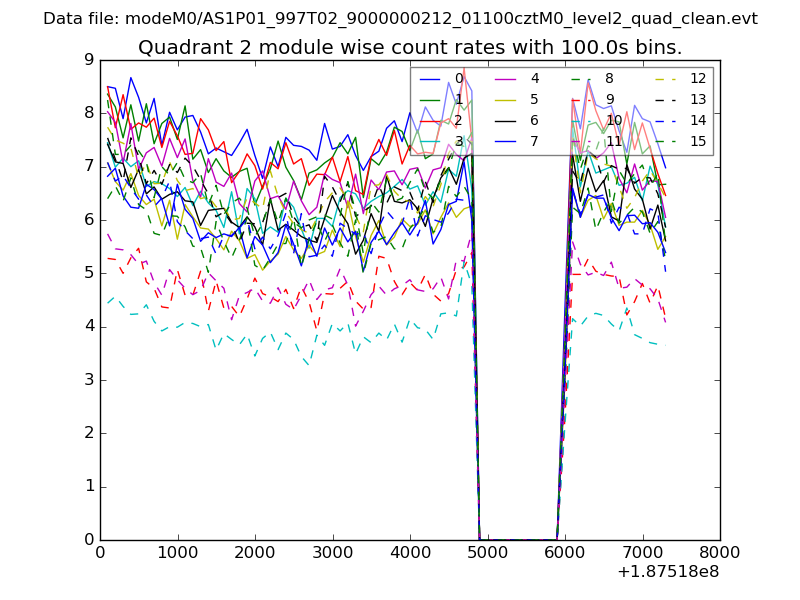
| Module-wise count rates for Quadrant B Data is divided into 100 sec bins |
 |
 |
| Module-wise count rates for Quadrant C Data is divided into 100 sec bins |
 |
 |
| Module-wise count rates for Quadrant D Data is divided into 100 sec bins |
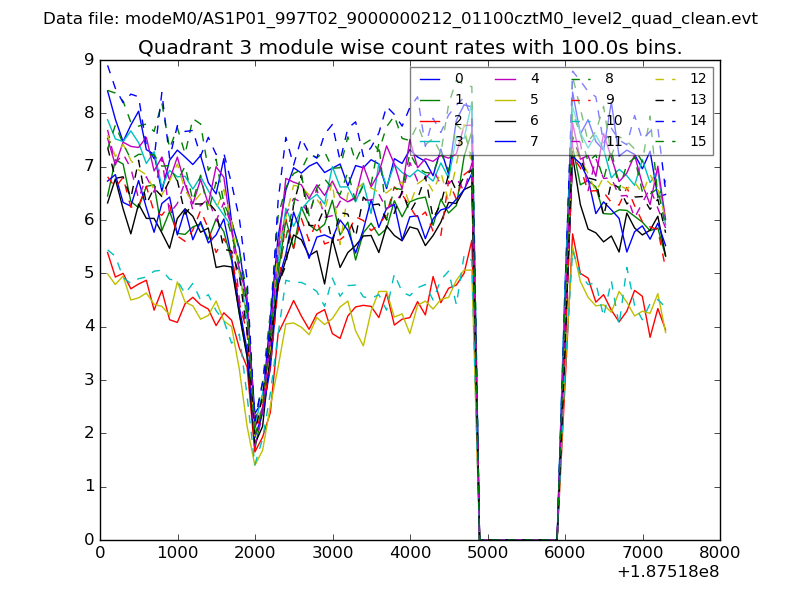 |
 |
| Parameter | Plot |
|---|---|
| CZT HV Monitor | 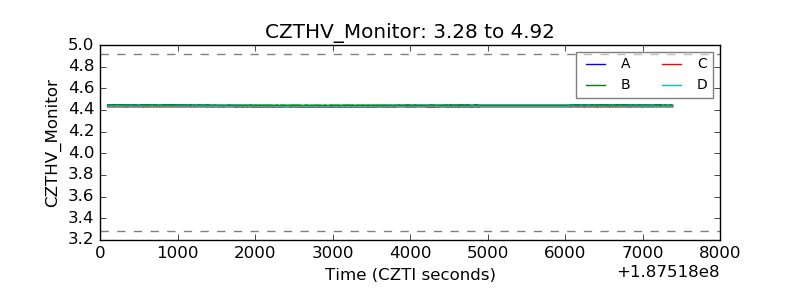 |
| D_VDD | 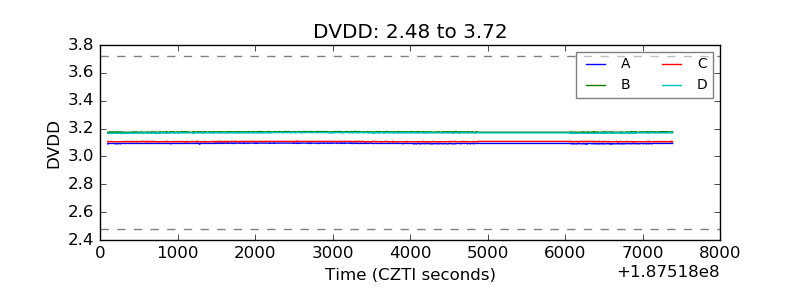 |
| Temperature 1 | 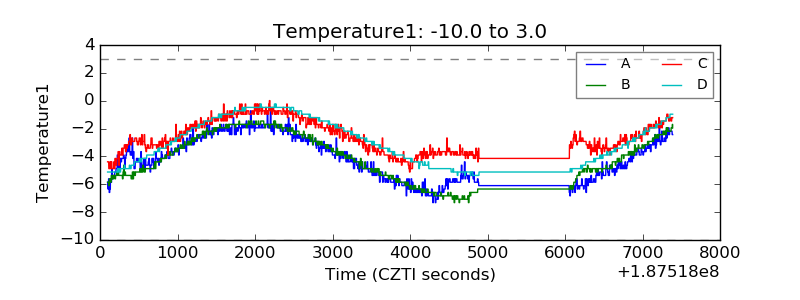 |
| Veto HV Monitor | 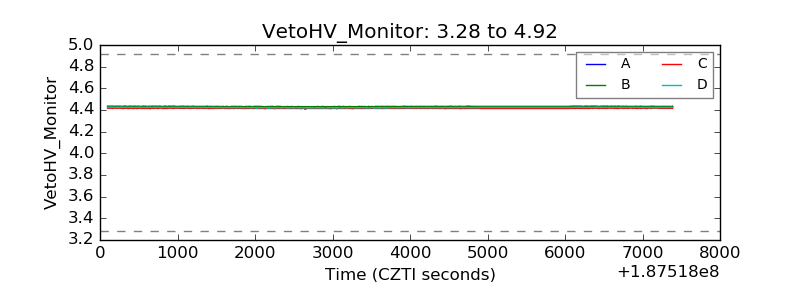 |
| Veto LLD | 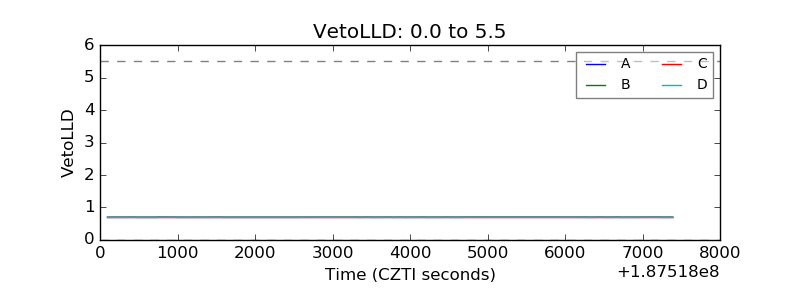 |
| Alpha Counter | 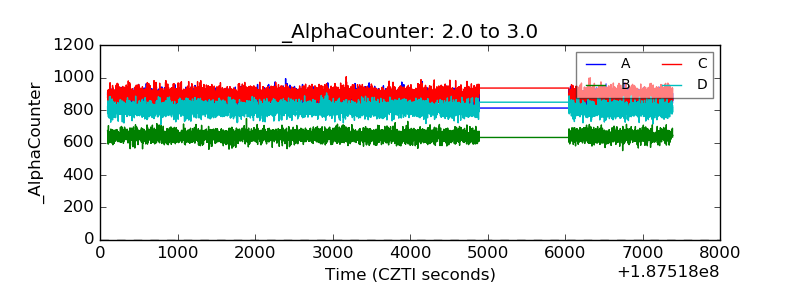 |
| _CPM_Rate | 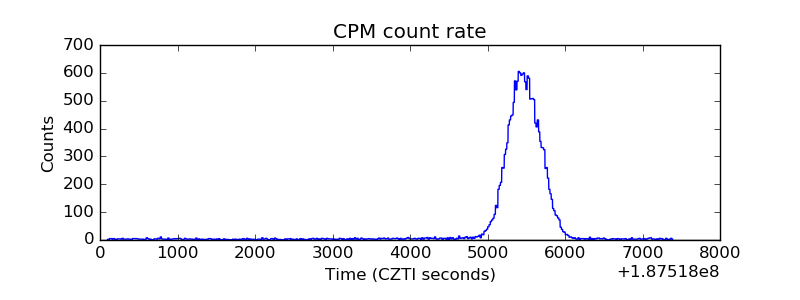 |
| CZT Counter | 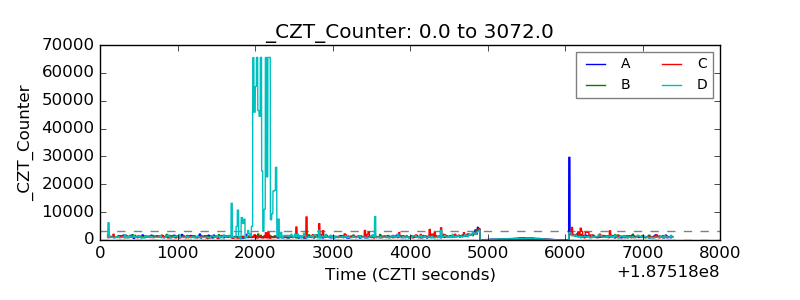 |
| +2.5 Volts monitor | 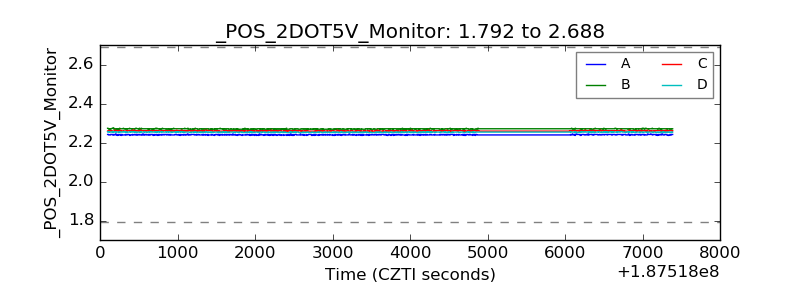 |
| +5 Volts monitor | 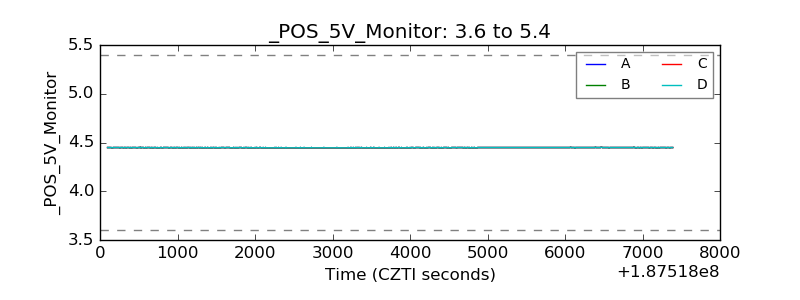 |
| _ROLL_ROT | 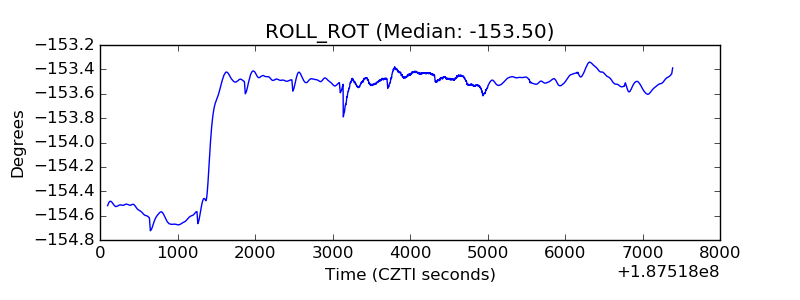 |
| _Roll_DEC | 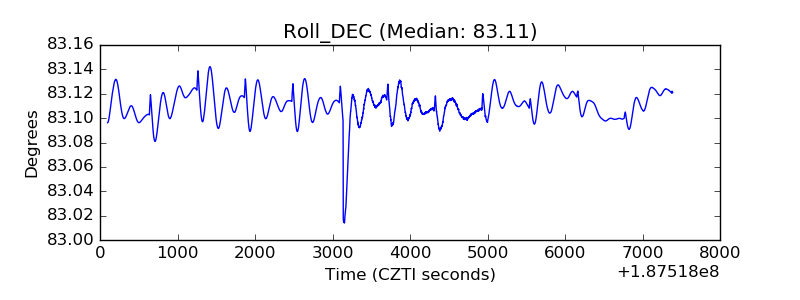 |
| _Roll_RA | 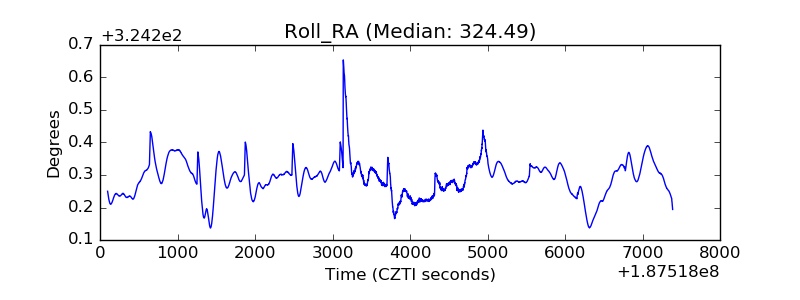 |
| Veto Counter | 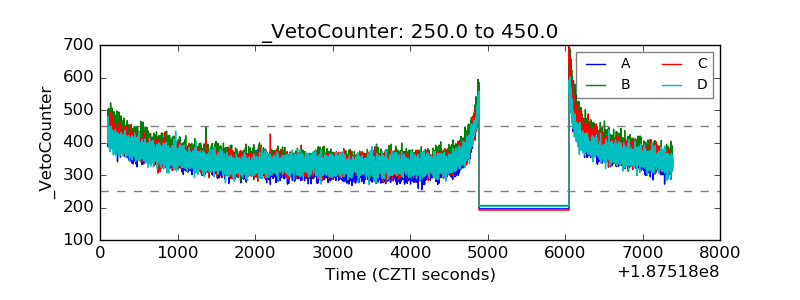 |