| Param | Original file | Final file |
|---|---|---|
| Filename | modeM0/AS1P01_997T02_9000000212_01103cztM0_level2.evt | modeM0/AS1P01_997T02_9000000212_01103cztM0_level2_quad_clean.evt |
| Size (bytes) | 1,055,900,160 | 97,436,160 |
| Size | 1007.0 MB | 92.9 MB |
| Events in quadrant A | 7,684,487 | 640,170 |
| Events in quadrant B | 8,236,934 | 635,587 |
| Events in quadrant C | 7,846,947 | 615,418 |
| Events in quadrant D | 7,779,219 | 606,715 |
| Mode M9 | |||
|---|---|---|---|
| Quadrant | BADHDUFLAG | Total packets | Discarded packets |
| A | 0 | 4 | 0 |
| B | 0 | 4 | 0 |
| C | 0 | 4 | 0 |
| D | 0 | 4 | 0 |
| Mode M0 | |||
|---|---|---|---|
| Quadrant | BADHDUFLAG | Total packets | Discarded packets |
| A | 0 | 27445 | 2 |
| B | 0 | 29071 | 1 |
| C | 0 | 27871 | 1 |
| D | 0 | 27759 | 1 |
| Mode SS | |||
|---|---|---|---|
| Quadrant | BADHDUFLAG | Total packets | Discarded packets |
| A | 0 | 132 | 0 |
| B | 0 | 132 | 0 |
| C | 0 | 132 | 0 |
| D | 0 | 132 | 0 |
| Quadrant | Total seconds | Saturated seconds | Saturation percentage |
|---|---|---|---|
| A | 6493 | 11 | 0.169413% |
| B | 6493 | 21 | 0.323425% |
| C | 6493 | 25 | 0.385030% |
| D | 6493 | 150 | 2.310180% |
Noise dominated data is calculated using 1-second bins in cleaned event files. If a bin has >2000 counts, and if more than 50% of those come from <1% of pixels, then it is considered to be noise-dominated and hence unusable.
| Quadrant | # 1 sec bins | Bins with >0 counts | Bins with >2000 counts | High rate bins dominated by noise | Noise dominated (total time) | Noise dominated (detector-on time) | Marked lightcurve |
|---|---|---|---|---|---|---|---|
| A | 6894 | 6494 | 277 | 277 | 4.02% | 4.27% | 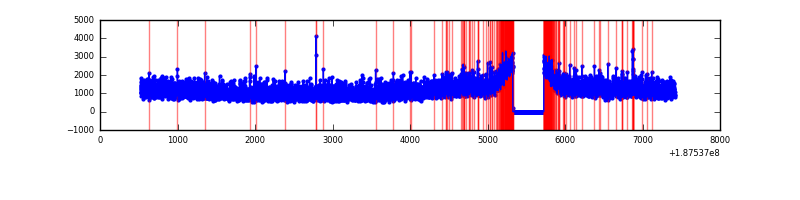 |
| B | 6894 | 6493 | 334 | 334 | 4.84% | 5.14% | 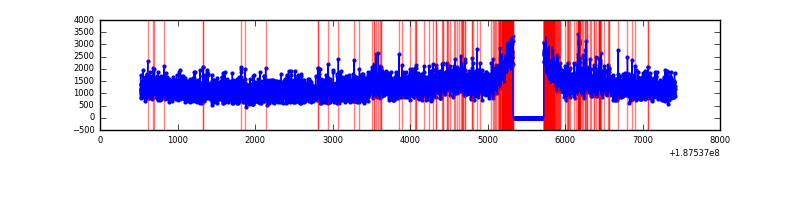 |
| C | 6894 | 6494 | 246 | 246 | 3.57% | 3.79% | 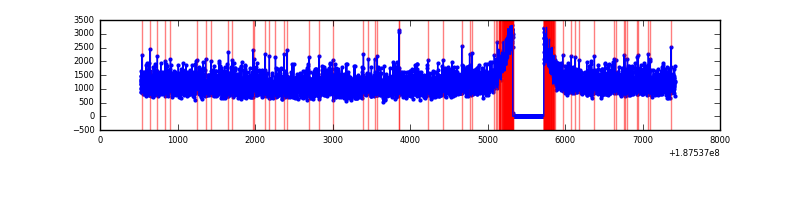 |
| D | 6894 | 6494 | 454 | 454 | 6.59% | 6.99% | 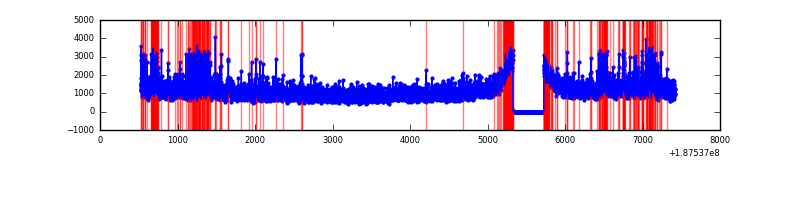 |
Top three noisy pixels from each quadrant. If the there are fewer than three noisy pixels in the level2.evt file, extra rows are filled as -1
| Pixel properties | Quadrant properties | ||||||
|---|---|---|---|---|---|---|---|
| Quadrant | DetID | PixID | Counts | Sigma | Mean | Median | Sigma |
| A | 12 | 243 | 39084 | 78.45 | 1991 | 2001 | 472.7 |
| A | 11 | 79 | 7964 | 12.61 | 1991 | 2001 | 472.7 |
| A | 0 | 253 | 6440 | 9.39 | 1991 | 2001 | 472.7 |
| B | 0 | 137 | 274493 | 561.34 | 2059 | 2069 | 485.3 |
| B | 5 | 191 | 41949 | 82.17 | 2059 | 2069 | 485.3 |
| B | 15 | 22 | 30024 | 57.6 | 2059 | 2069 | 485.3 |
| C | 15 | 241 | 314290 | 591.54 | 1898 | 1968 | 528.0 |
| C | 10 | 207 | 62150 | 113.99 | 1898 | 1968 | 528.0 |
| C | 3 | 79 | 34292 | 61.22 | 1898 | 1968 | 528.0 |
| D | 2 | 216 | 200226 | 324.57 | 1948 | 1954 | 610.9 |
| D | 10 | 125 | 24130 | 36.3 | 1948 | 1954 | 610.9 |
| D | 2 | 16 | 16308 | 23.5 | 1948 | 1954 | 610.9 |
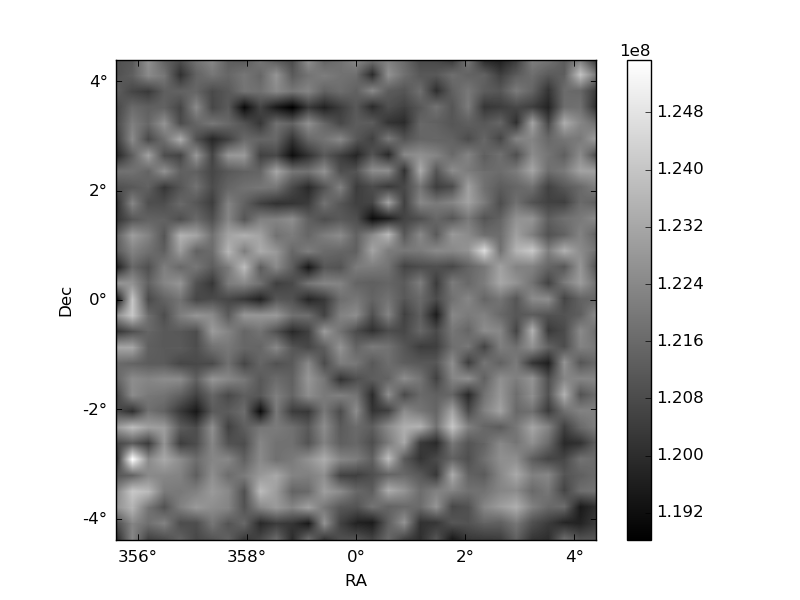
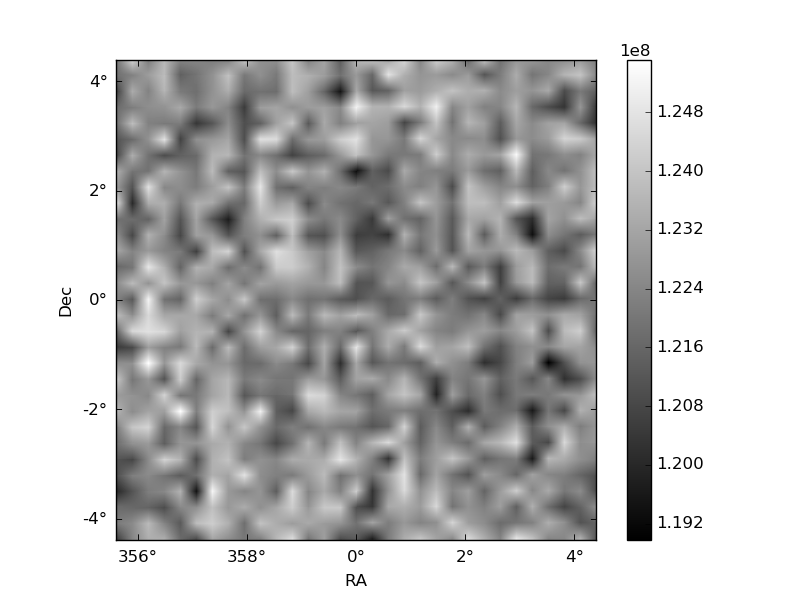
Histogram calculated using DETX and DETY for each event in the final _common_clean file
| Quadrant A | 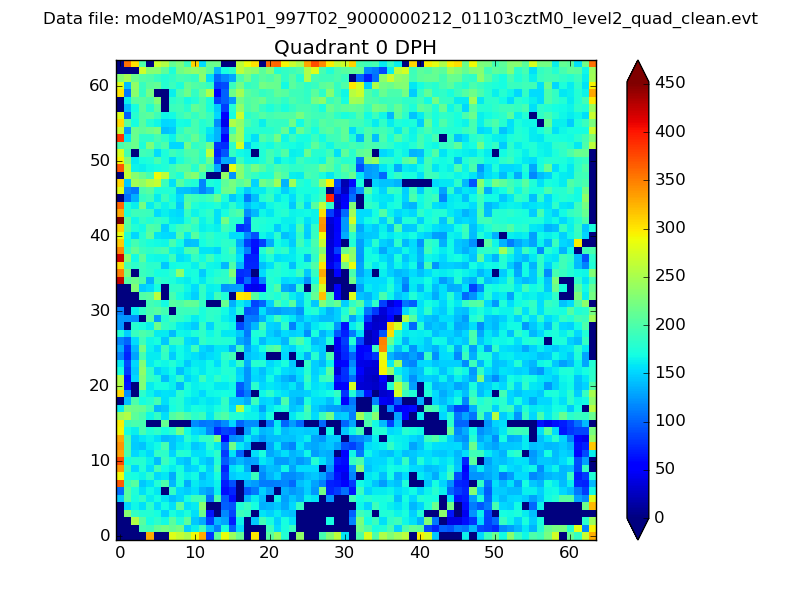 |
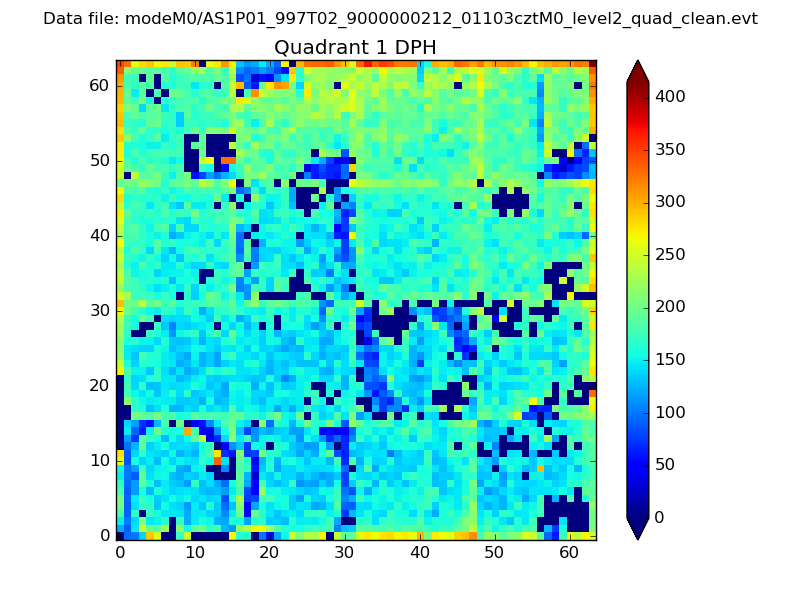 |
Quadrant B |
|---|---|---|---|
| Quadrant D | 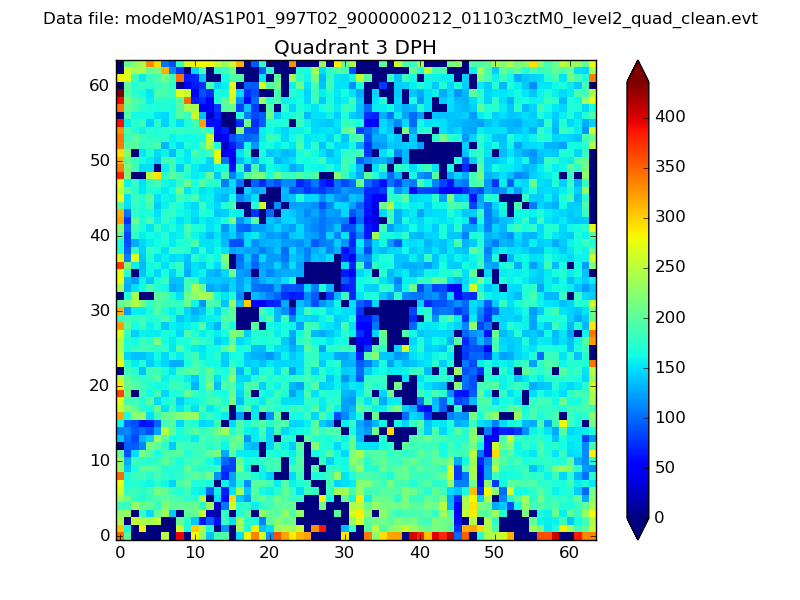 |
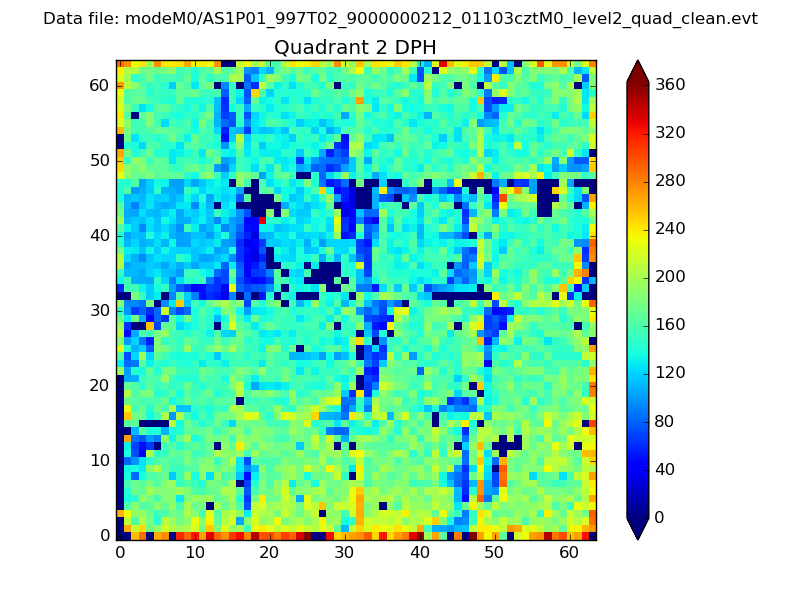 |
Quadrant C |
| Plot type | Count rate plots | Images |
|---|---|---|
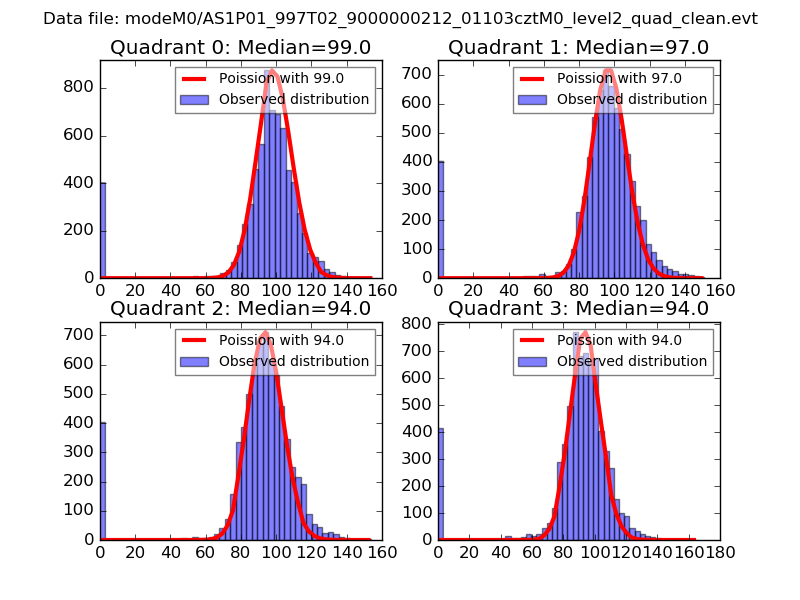
| Comparison with Poisson distribution Blue bars denote a histogram of data divided into 1 sec bins. Red curve is a Poisson curve with rate = median count rate of data. |
 |
 |
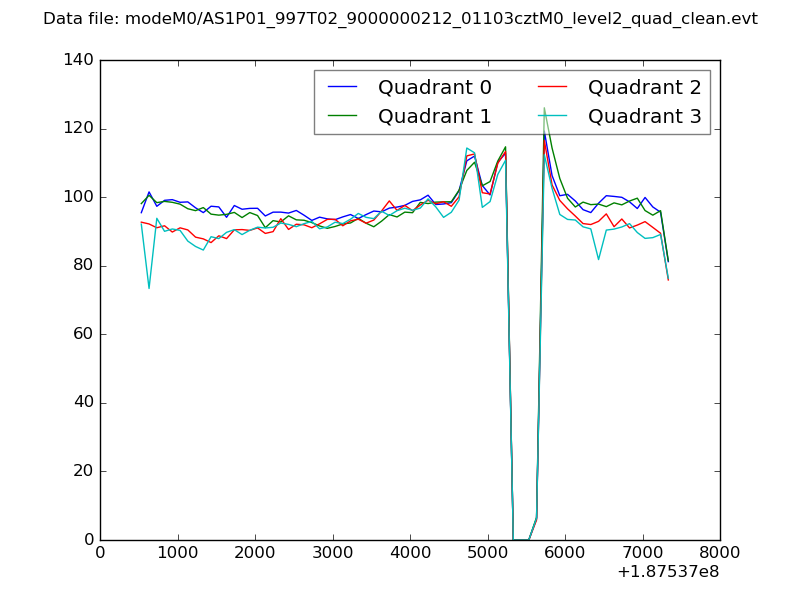
| Quadrant-wise count rates Data is divided into 100 sec bins |
 |
|
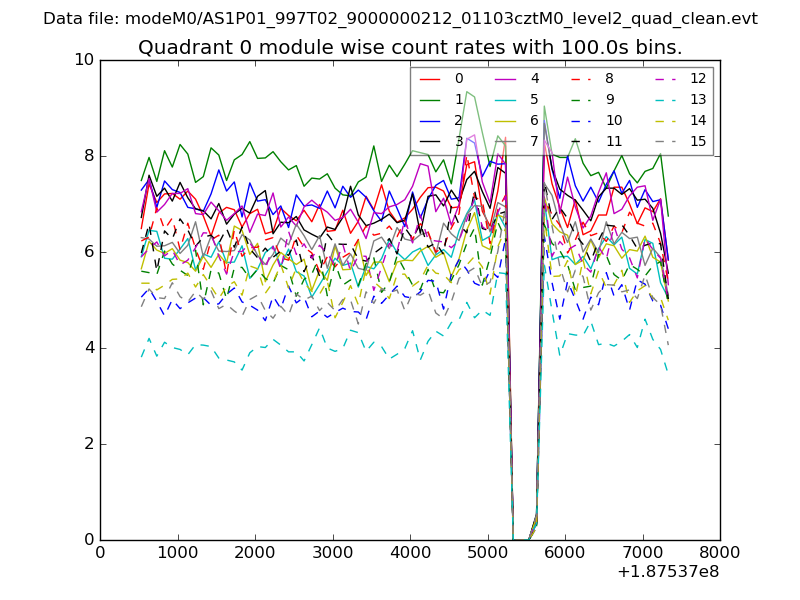
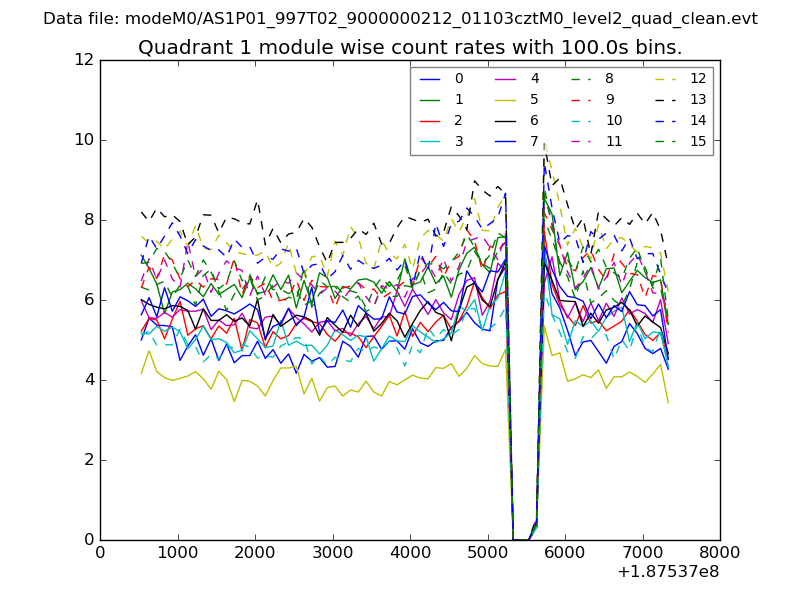
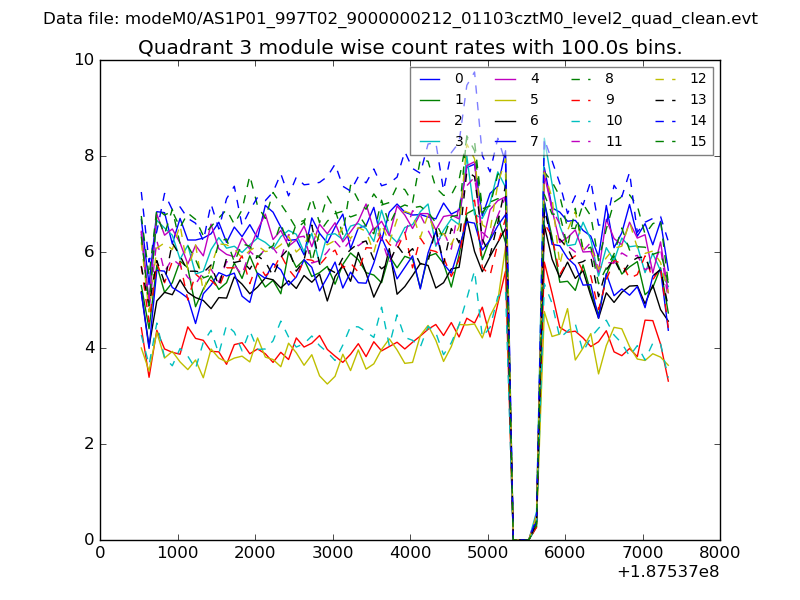
| Module-wise count rates for Quadrant A Data is divided into 100 sec bins |
 |
 |
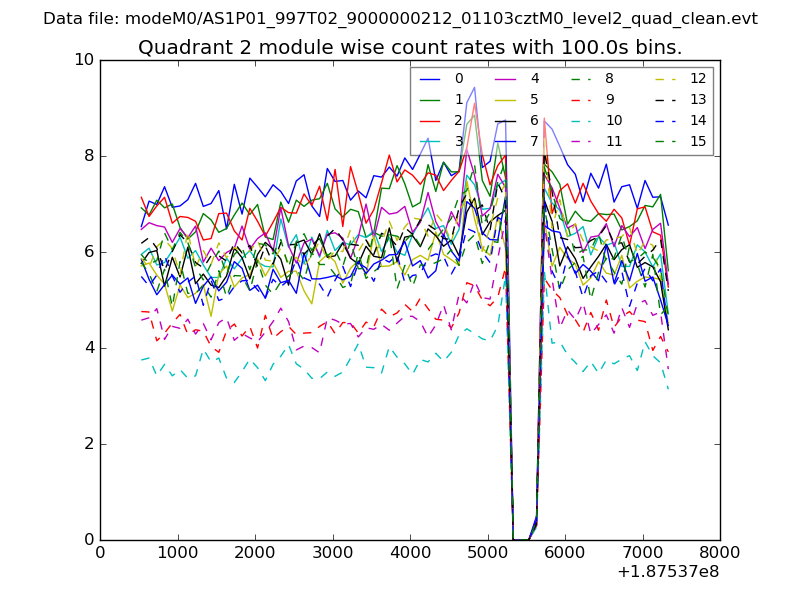
| Module-wise count rates for Quadrant B Data is divided into 100 sec bins |
 |
 |
| Module-wise count rates for Quadrant C Data is divided into 100 sec bins |
 |
 |
| Module-wise count rates for Quadrant D Data is divided into 100 sec bins |
 |
 |
| Parameter | Plot |
|---|---|
| CZT HV Monitor | 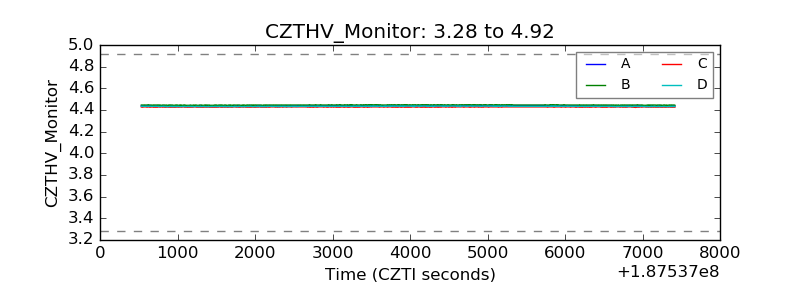 |
| D_VDD | 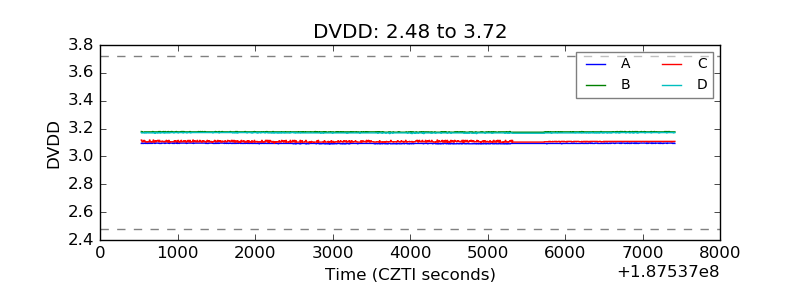 |
| Temperature 1 | 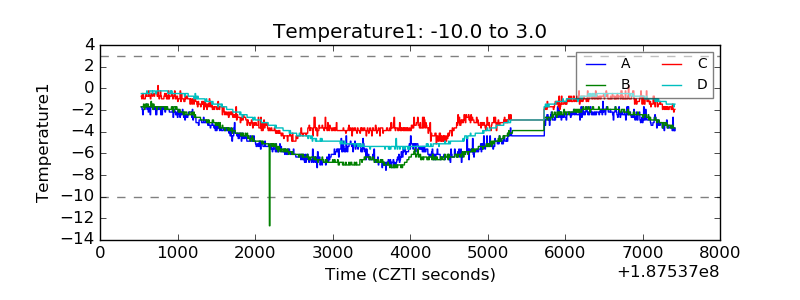 |
| Veto HV Monitor | 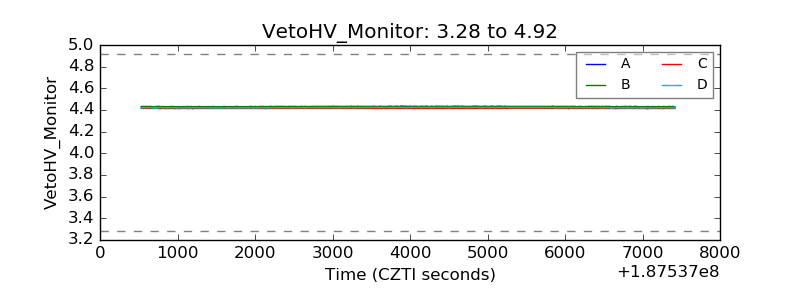 |
| Veto LLD | 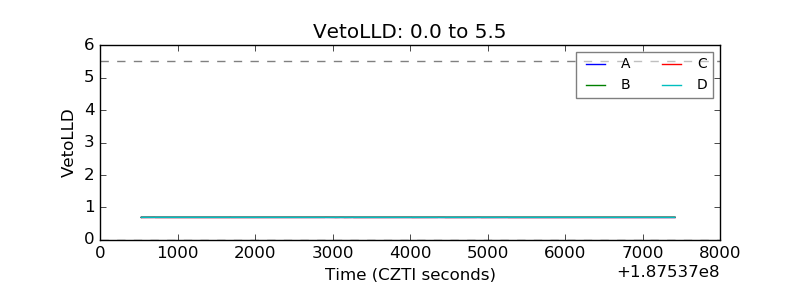 |
| Alpha Counter | 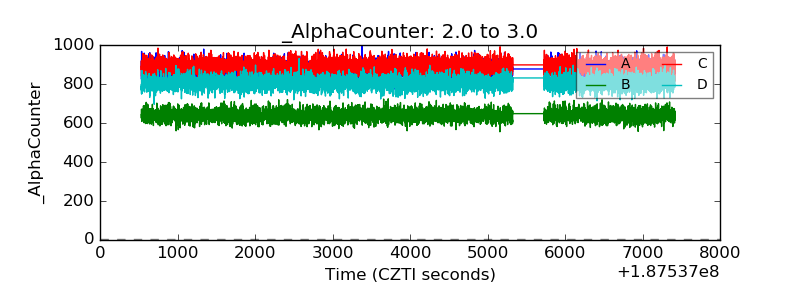 |
| _CPM_Rate | 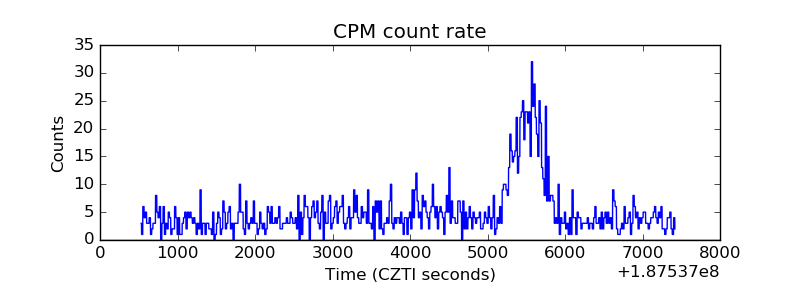 |
| CZT Counter | 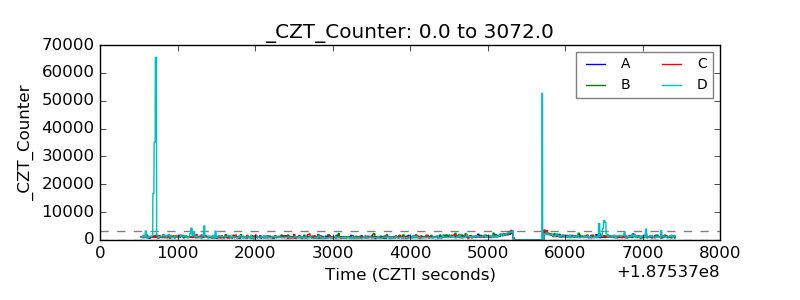 |
| +2.5 Volts monitor | 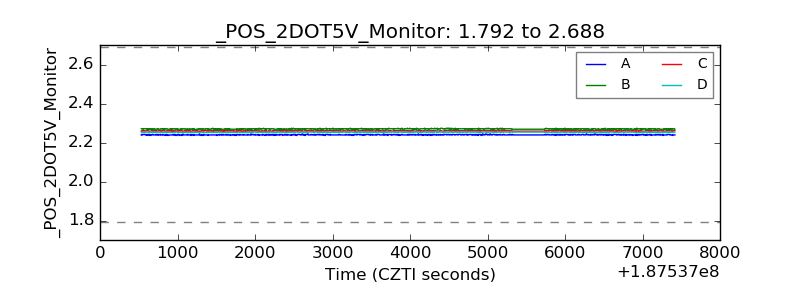 |
| +5 Volts monitor | 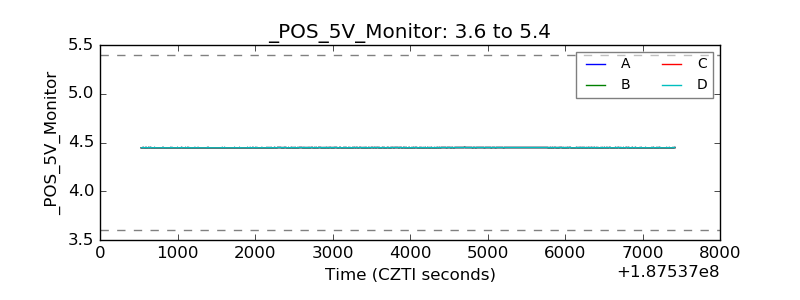 |
| _ROLL_ROT | 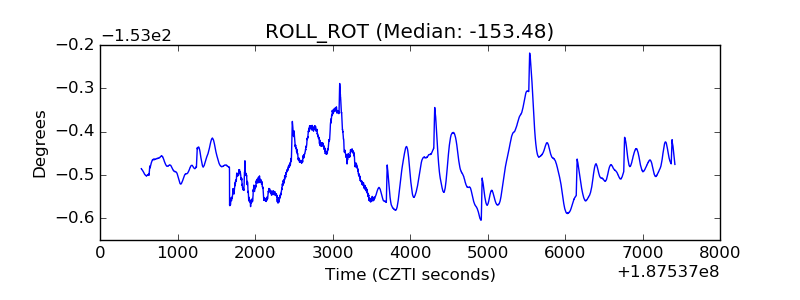 |
| _Roll_DEC | 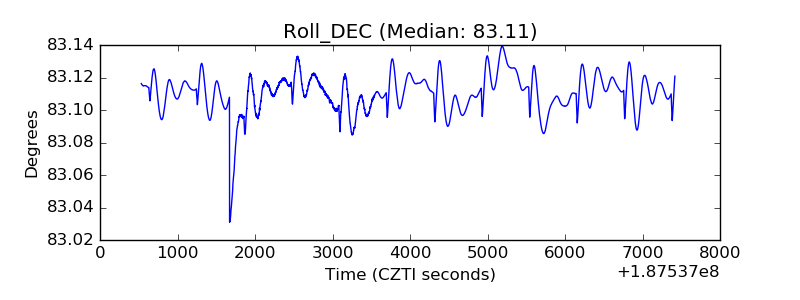 |
| _Roll_RA | 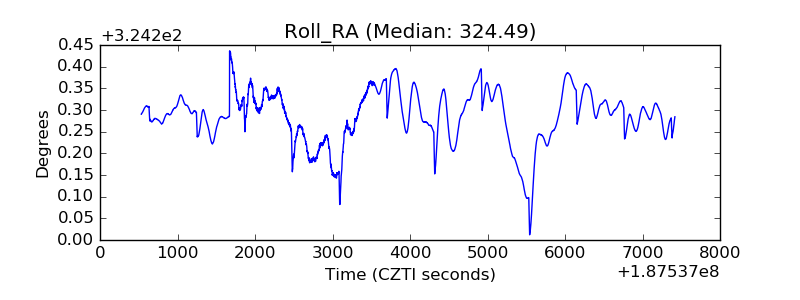 |
| Veto Counter | 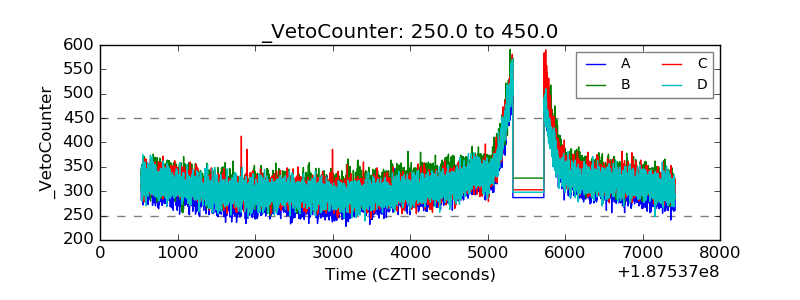 |