| Param | Original file | Final file |
|---|---|---|
| Filename | modeM0/AS1P01_997T02_9000000212_01104cztM0_level2.evt | modeM0/AS1P01_997T02_9000000212_01104cztM0_level2_quad_clean.evt |
| Size (bytes) | 1,187,516,160 | 105,978,240 |
| Size | 1.1 GB | 101.1 MB |
| Events in quadrant A | 8,553,656 | 696,650 |
| Events in quadrant B | 9,006,211 | 694,480 |
| Events in quadrant C | 8,707,270 | 671,826 |
| Events in quadrant D | 9,227,138 | 652,119 |
| Mode M9 | |||
|---|---|---|---|
| Quadrant | BADHDUFLAG | Total packets | Discarded packets |
| A | 0 | 2 | 0 |
| B | 0 | 2 | 0 |
| C | 0 | 2 | 0 |
| D | 0 | 2 | 0 |
| Mode M0 | |||
|---|---|---|---|
| Quadrant | BADHDUFLAG | Total packets | Discarded packets |
| A | 0 | 30431 | 2 |
| B | 0 | 31779 | 1 |
| C | 0 | 30899 | 1 |
| D | 0 | 32540 | 1 |
| Mode SS | |||
|---|---|---|---|
| Quadrant | BADHDUFLAG | Total packets | Discarded packets |
| A | 0 | 144 | 0 |
| B | 0 | 144 | 0 |
| C | 0 | 144 | 0 |
| D | 0 | 144 | 0 |
| Quadrant | Total seconds | Saturated seconds | Saturation percentage |
|---|---|---|---|
| A | 7106 | 17 | 0.239234% |
| B | 7106 | 25 | 0.351815% |
| C | 7106 | 14 | 0.197017% |
| D | 7106 | 363 | 5.108359% |
Noise dominated data is calculated using 1-second bins in cleaned event files. If a bin has >2000 counts, and if more than 50% of those come from <1% of pixels, then it is considered to be noise-dominated and hence unusable.
| Quadrant | # 1 sec bins | Bins with >0 counts | Bins with >2000 counts | High rate bins dominated by noise | Noise dominated (total time) | Noise dominated (detector-on time) | Marked lightcurve |
|---|---|---|---|---|---|---|---|
| A | 7196 | 7109 | 311 | 311 | 4.32% | 4.37% | 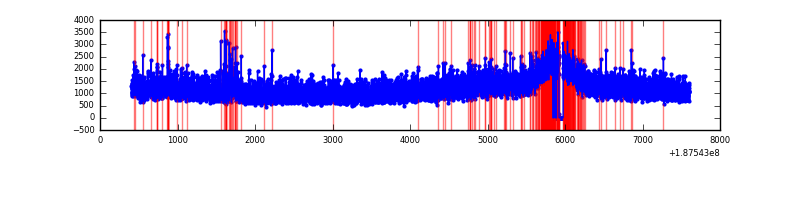 |
| B | 7196 | 7109 | 373 | 373 | 5.18% | 5.25% | 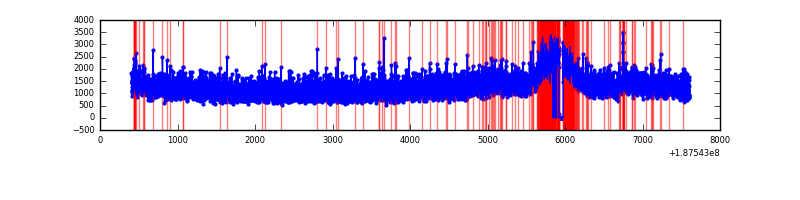 |
| C | 7196 | 7109 | 332 | 332 | 4.61% | 4.67% | 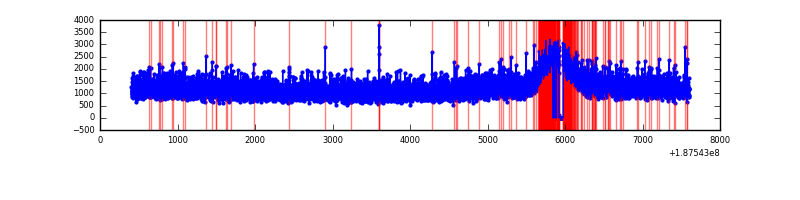 |
| D | 7196 | 7109 | 891 | 891 | 12.38% | 12.53% | 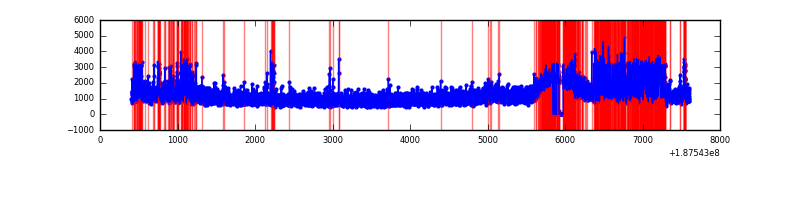 |
Top three noisy pixels from each quadrant. If the there are fewer than three noisy pixels in the level2.evt file, extra rows are filled as -1
| Pixel properties | Quadrant properties | ||||||
|---|---|---|---|---|---|---|---|
| Quadrant | DetID | PixID | Counts | Sigma | Mean | Median | Sigma |
| A | 12 | 243 | 112842 | 209.56 | 2197 | 2216 | 527.9 |
| A | 11 | 79 | 10846 | 16.35 | 2197 | 2216 | 527.9 |
| A | 13 | 9 | 9016 | 12.88 | 2197 | 2216 | 527.9 |
| B | 0 | 137 | 167390 | 304.97 | 2285 | 2291 | 541.4 |
| B | 15 | 22 | 44559 | 78.08 | 2285 | 2291 | 541.4 |
| B | 5 | 249 | 35356 | 61.08 | 2285 | 2291 | 541.4 |
| C | 15 | 241 | 336899 | 568.67 | 2109 | 2184 | 588.6 |
| C | 9 | 85 | 47021 | 76.18 | 2109 | 2184 | 588.6 |
| C | 3 | 79 | 34848 | 55.49 | 2109 | 2184 | 588.6 |
| D | 2 | 216 | 207349 | 323.13 | 2105 | 2143 | 635.1 |
| D | 10 | 215 | 30722 | 45.0 | 2105 | 2143 | 635.1 |
| D | 2 | 14 | 27197 | 39.45 | 2105 | 2143 | 635.1 |
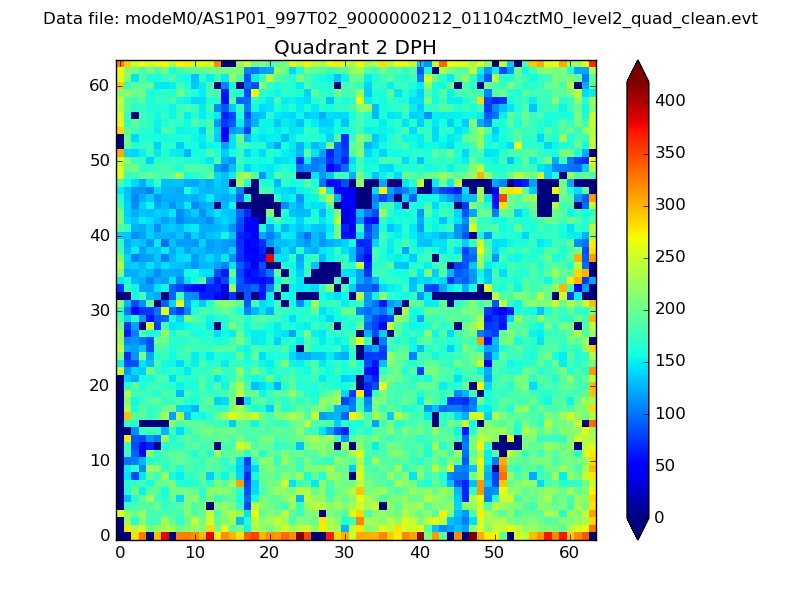
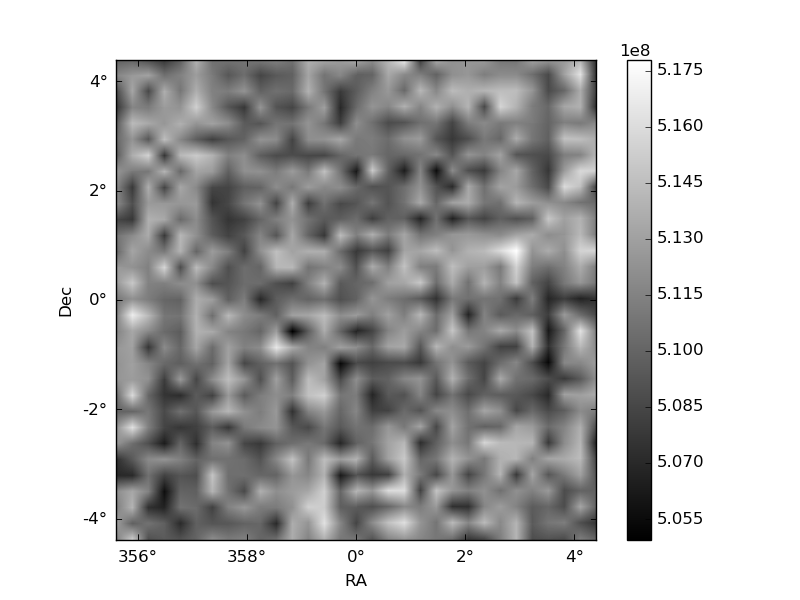
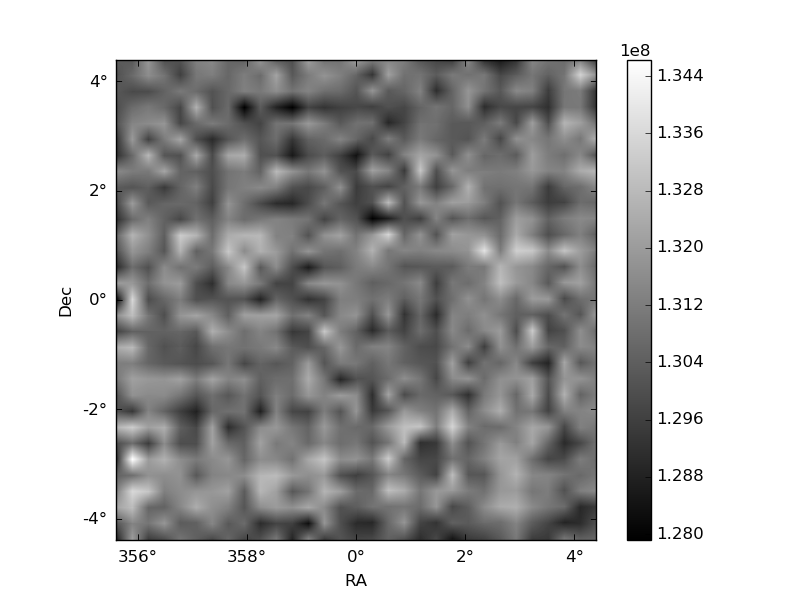
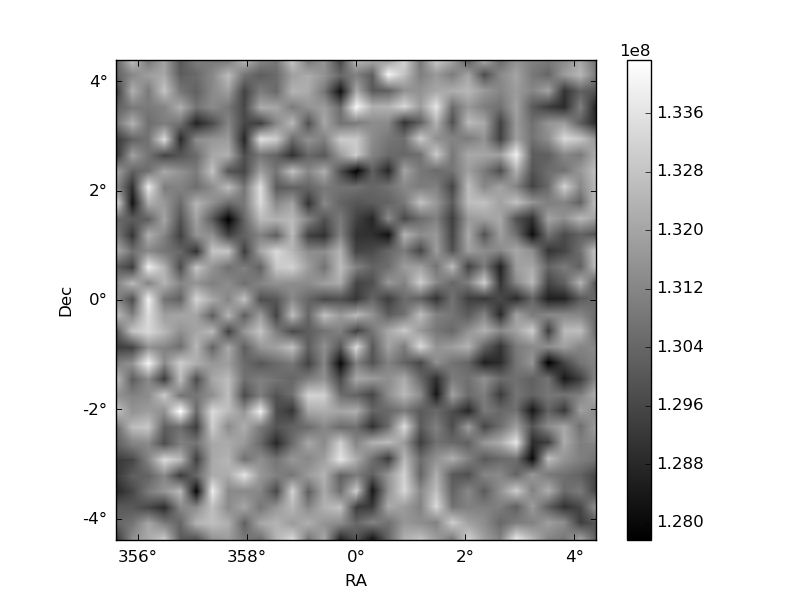
Histogram calculated using DETX and DETY for each event in the final _common_clean file
| Quadrant A | 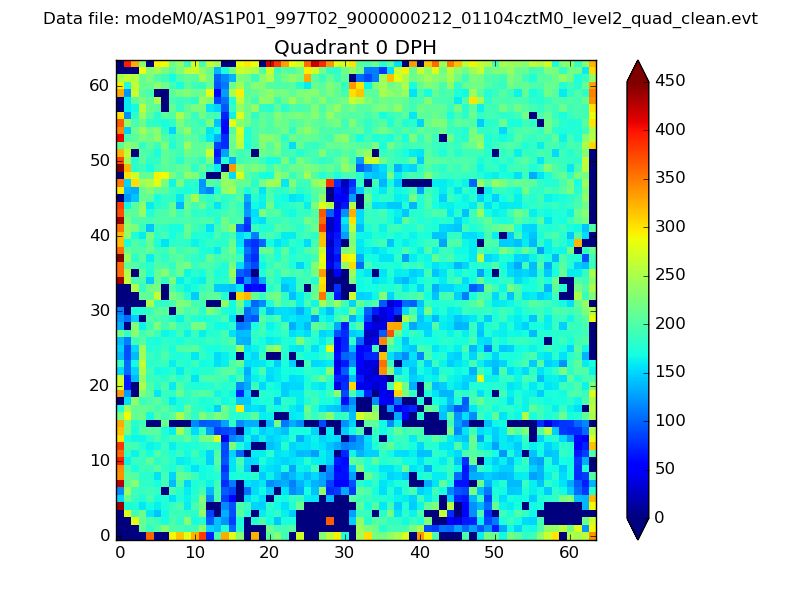 |
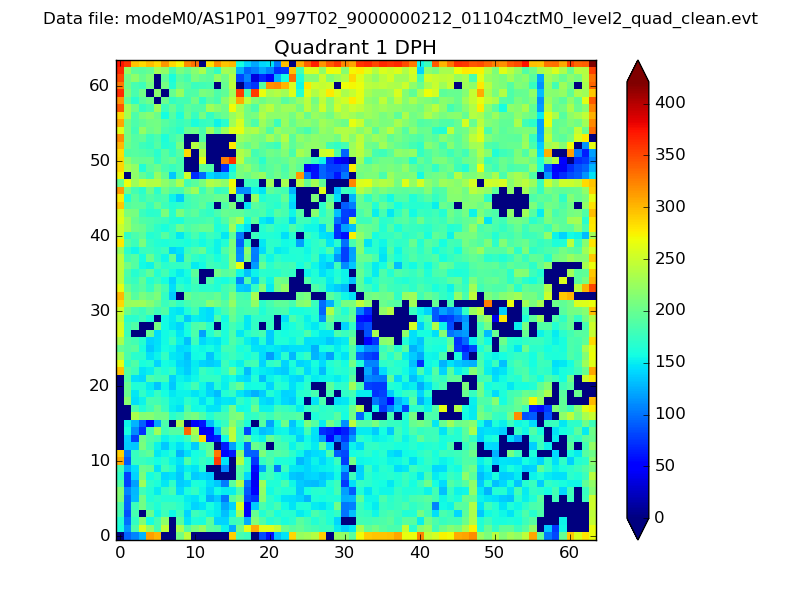 |
Quadrant B |
|---|---|---|---|
| Quadrant D | 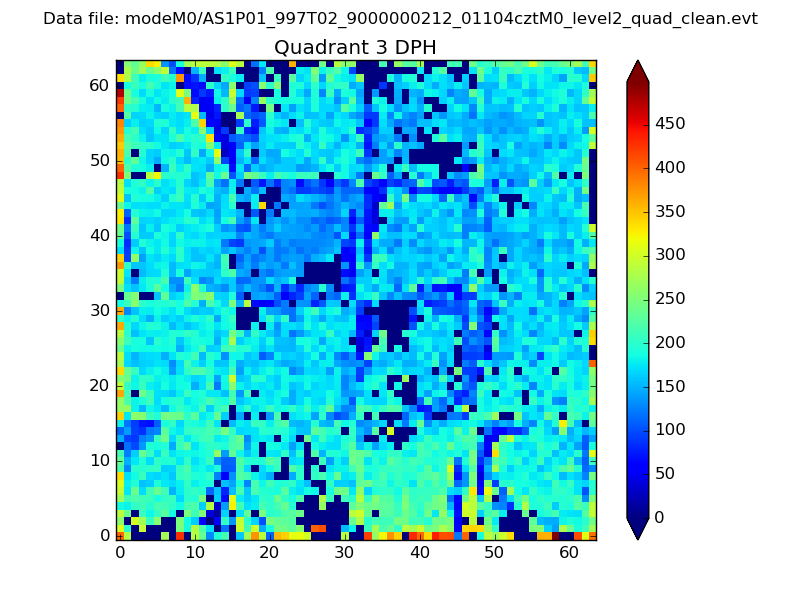 |
 |
Quadrant C |
| Plot type | Count rate plots | Images |
|---|---|---|
| Comparison with Poisson distribution Blue bars denote a histogram of data divided into 1 sec bins. Red curve is a Poisson curve with rate = median count rate of data. |
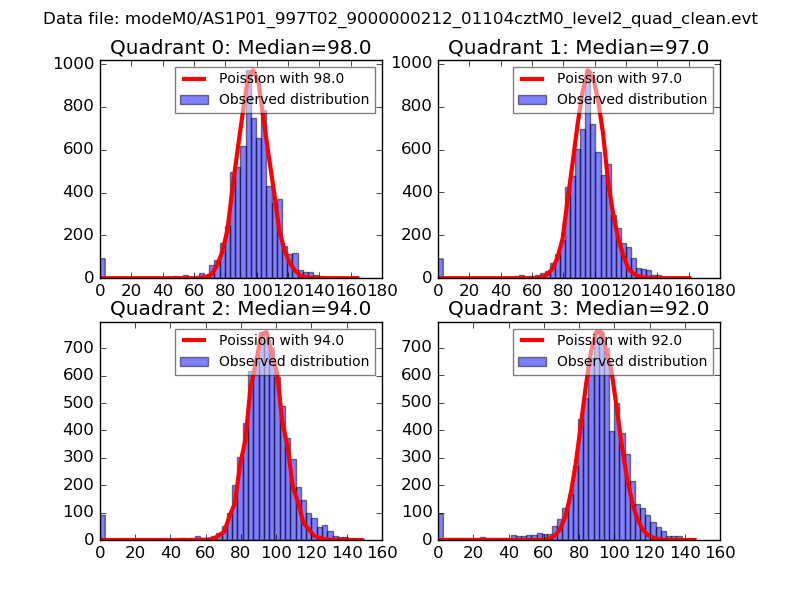 |
 |
| Quadrant-wise count rates Data is divided into 100 sec bins |
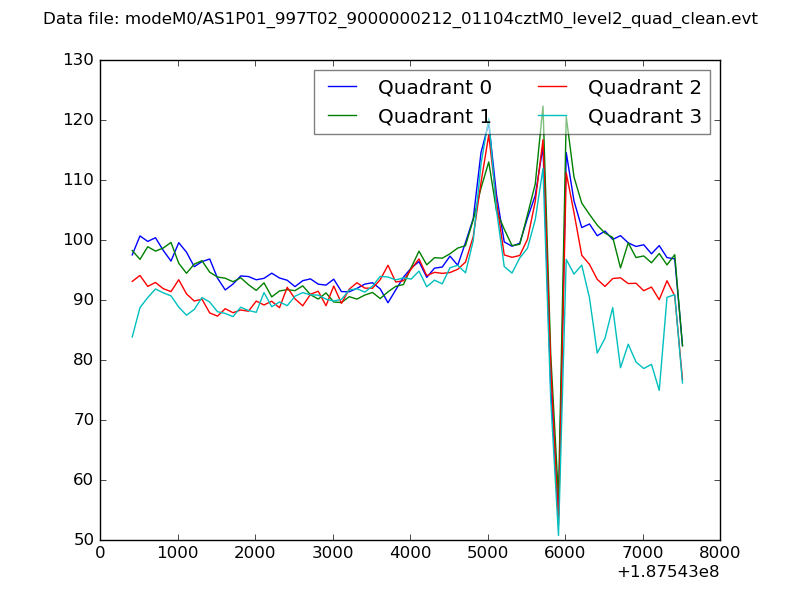 |
|
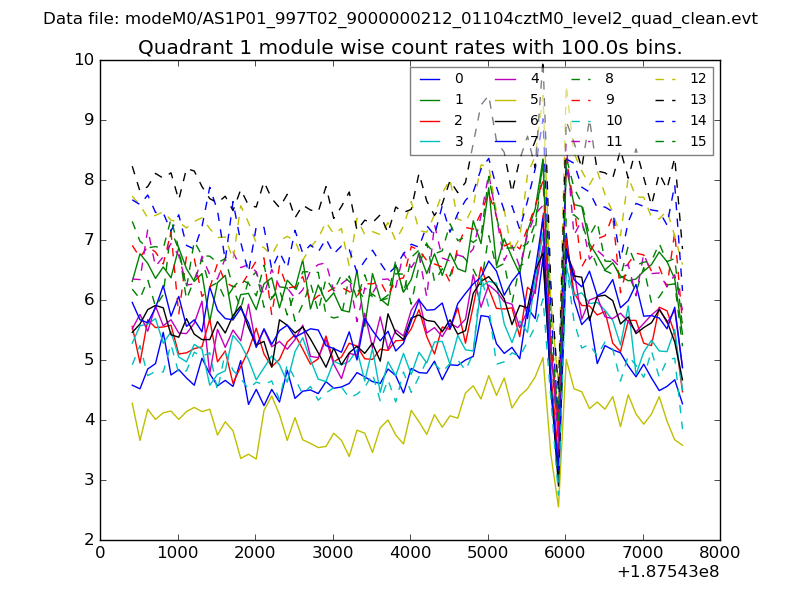
| Module-wise count rates for Quadrant A Data is divided into 100 sec bins |
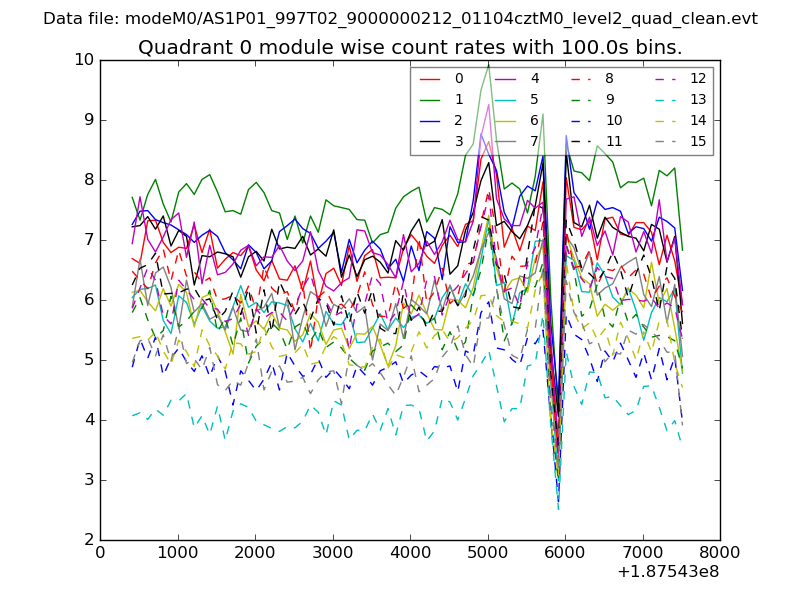 |
 |
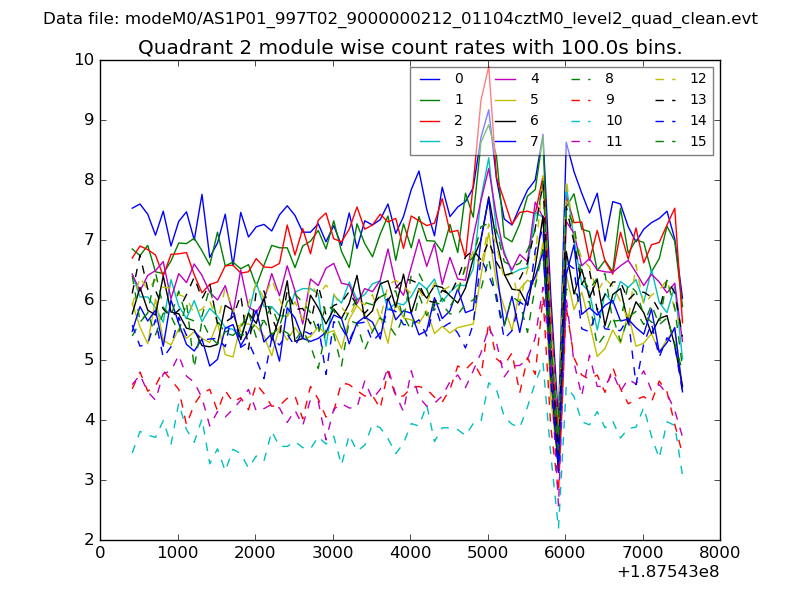
| Module-wise count rates for Quadrant B Data is divided into 100 sec bins |
 |
 |
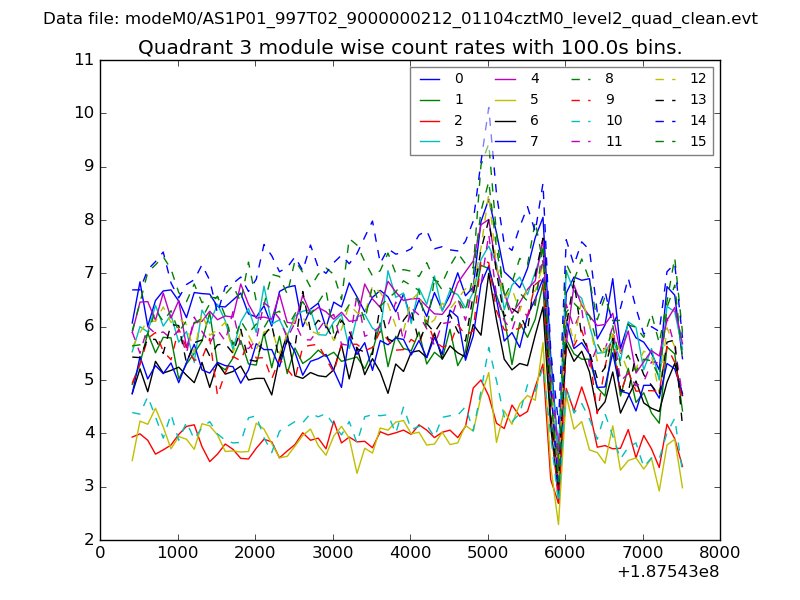
| Module-wise count rates for Quadrant C Data is divided into 100 sec bins |
 |
 |
| Module-wise count rates for Quadrant D Data is divided into 100 sec bins |
 |
 |
| Parameter | Plot |
|---|---|
| CZT HV Monitor | 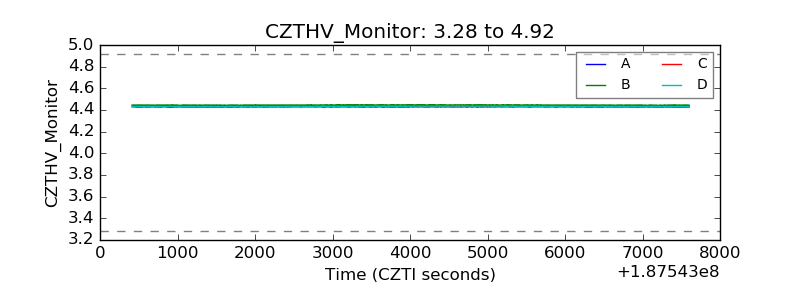 |
| D_VDD | 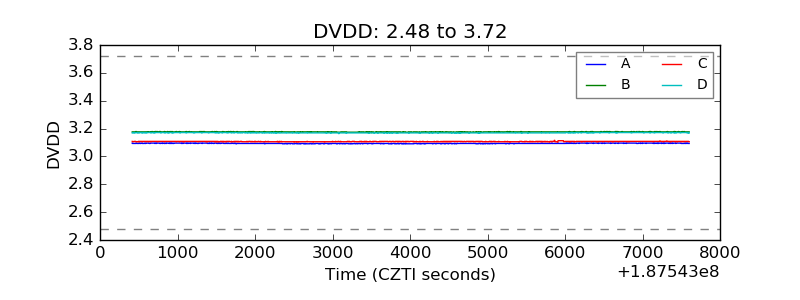 |
| Temperature 1 | 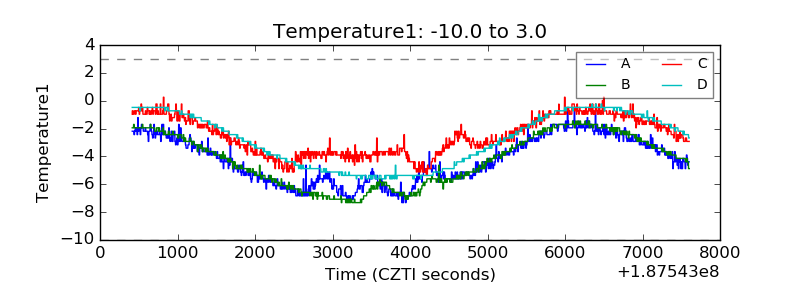 |
| Veto HV Monitor | 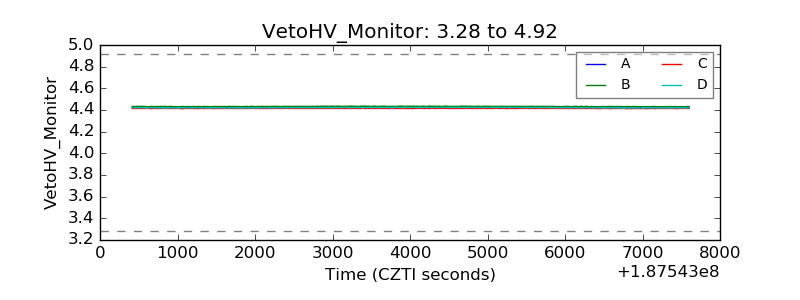 |
| Veto LLD | 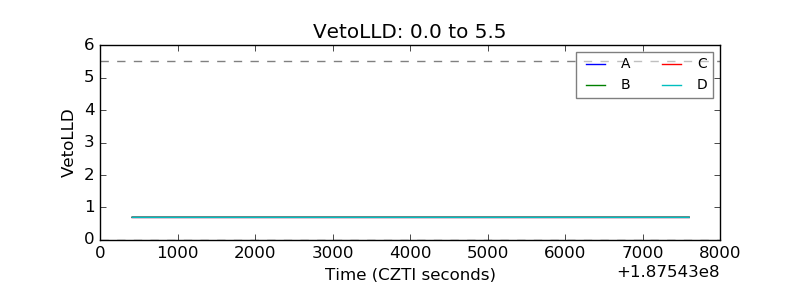 |
| Alpha Counter | 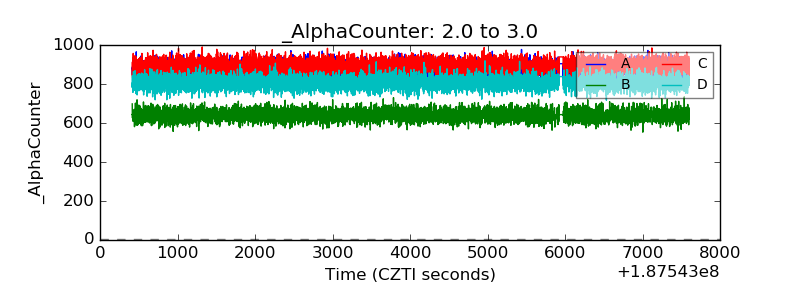 |
| _CPM_Rate | 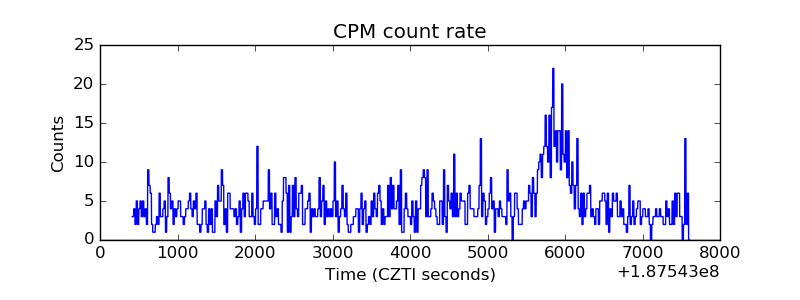 |
| CZT Counter | 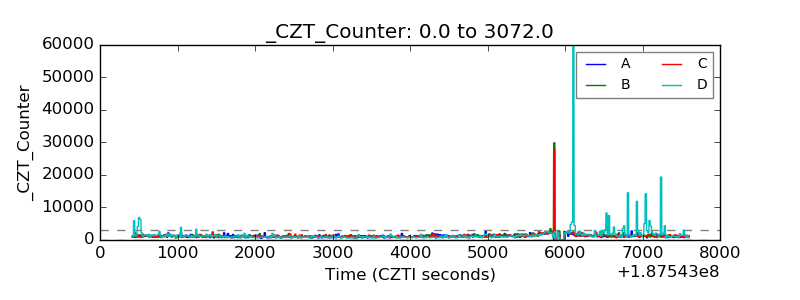 |
| +2.5 Volts monitor |  |
| +5 Volts monitor |  |
| _ROLL_ROT | 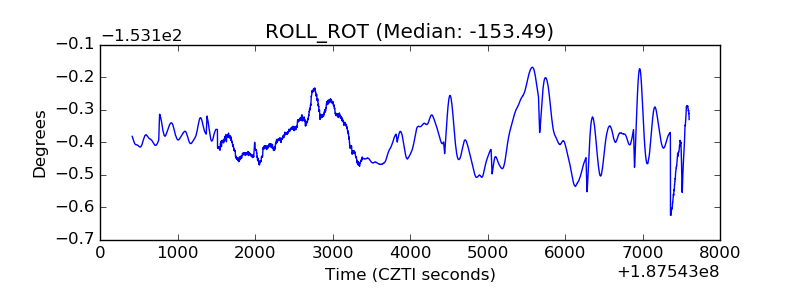 |
| _Roll_DEC | 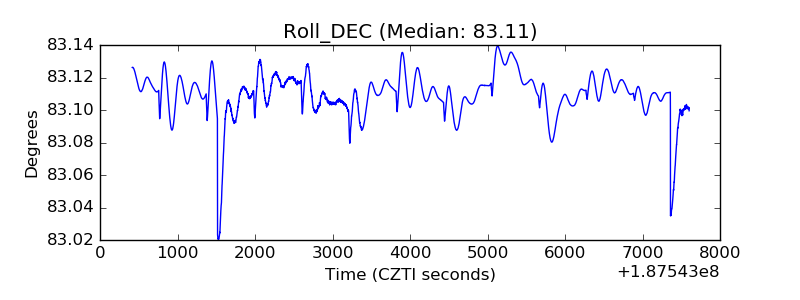 |
| _Roll_RA | 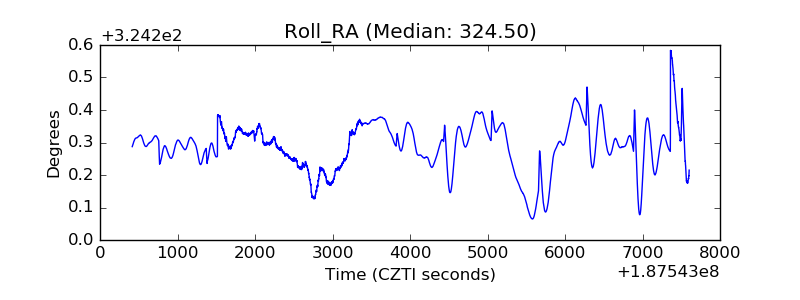 |
| Veto Counter | 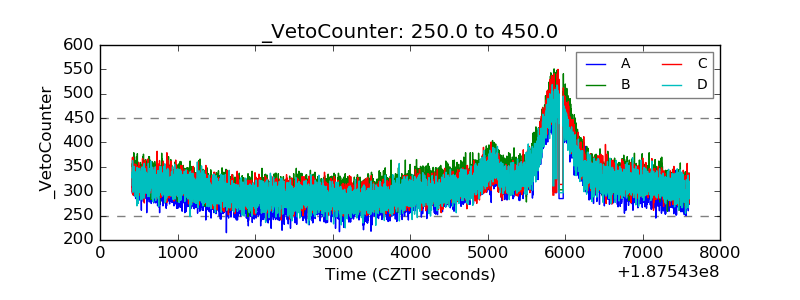 |