| Param | Original file | Final file |
|---|---|---|
| Filename | modeM0/AS1P01_997T02_9000000212_01105cztM0_level2.evt | modeM0/AS1P01_997T02_9000000212_01105cztM0_level2_quad_clean.evt |
| Size (bytes) | 1,239,163,200 | 110,741,760 |
| Size | 1.2 GB | 105.6 MB |
| Events in quadrant A | 8,969,675 | 727,493 |
| Events in quadrant B | 9,364,641 | 727,544 |
| Events in quadrant C | 9,073,943 | 702,398 |
| Events in quadrant D | 9,624,280 | 675,414 |
| Mode M9 | |||
|---|---|---|---|
| Quadrant | BADHDUFLAG | Total packets | Discarded packets |
| A | 0 | 2 | 0 |
| B | 0 | 2 | 0 |
| C | 0 | 2 | 0 |
| D | 0 | 2 | 0 |
| Mode M0 | |||
|---|---|---|---|
| Quadrant | BADHDUFLAG | Total packets | Discarded packets |
| A | 0 | 31925 | 2 |
| B | 0 | 33144 | 1 |
| C | 0 | 32276 | 1 |
| D | 0 | 33937 | 1 |
| Mode SS | |||
|---|---|---|---|
| Quadrant | BADHDUFLAG | Total packets | Discarded packets |
| A | 0 | 152 | 0 |
| B | 0 | 152 | 0 |
| C | 0 | 152 | 0 |
| D | 0 | 152 | 0 |
| Quadrant | Total seconds | Saturated seconds | Saturation percentage |
|---|---|---|---|
| A | 7485 | 37 | 0.494322% |
| B | 7485 | 15 | 0.200401% |
| C | 7485 | 2 | 0.026720% |
| D | 7485 | 436 | 5.824983% |
Noise dominated data is calculated using 1-second bins in cleaned event files. If a bin has >2000 counts, and if more than 50% of those come from <1% of pixels, then it is considered to be noise-dominated and hence unusable.
| Quadrant | # 1 sec bins | Bins with >0 counts | Bins with >2000 counts | High rate bins dominated by noise | Noise dominated (total time) | Noise dominated (detector-on time) | Marked lightcurve |
|---|---|---|---|---|---|---|---|
| A | 7715 | 7486 | 279 | 279 | 3.62% | 3.73% | 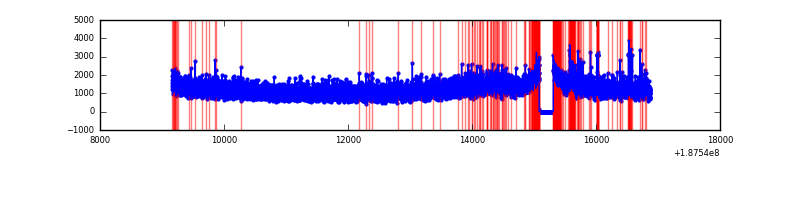 |
| B | 7715 | 7486 | 293 | 293 | 3.80% | 3.91% | 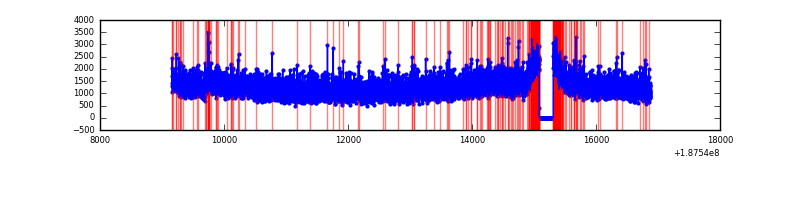 |
| C | 7715 | 7486 | 240 | 240 | 3.11% | 3.21% | 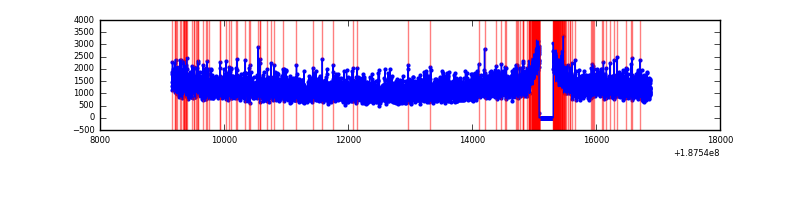 |
| D | 7715 | 7485 | 828 | 828 | 10.73% | 11.06% | 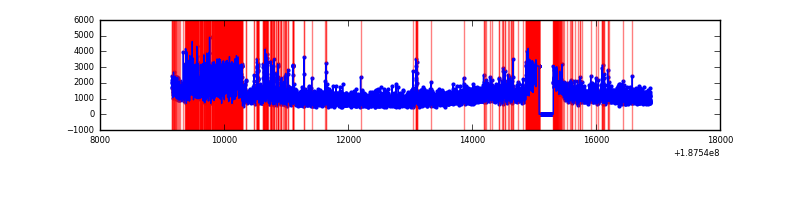 |
Top three noisy pixels from each quadrant. If the there are fewer than three noisy pixels in the level2.evt file, extra rows are filled as -1
| Pixel properties | Quadrant properties | ||||||
|---|---|---|---|---|---|---|---|
| Quadrant | DetID | PixID | Counts | Sigma | Mean | Median | Sigma |
| A | 4 | 32 | 201601 | 362.38 | 2280 | 2298 | 550.0 |
| A | 12 | 243 | 23958 | 39.38 | 2280 | 2298 | 550.0 |
| A | 11 | 79 | 8746 | 11.72 | 2280 | 2298 | 550.0 |
| B | 0 | 137 | 106185 | 183.0 | 2394 | 2405 | 567.1 |
| B | 5 | 249 | 43576 | 72.6 | 2394 | 2405 | 567.1 |
| B | 2 | 32 | 30689 | 49.87 | 2394 | 2405 | 567.1 |
| C | 15 | 241 | 359361 | 585.08 | 2187 | 2262 | 610.3 |
| C | 10 | 207 | 63541 | 100.4 | 2187 | 2262 | 610.3 |
| C | 9 | 85 | 39602 | 61.18 | 2187 | 2262 | 610.3 |
| D | 2 | 216 | 210518 | 328.56 | 2156 | 2203 | 634.0 |
| D | 2 | 14 | 29853 | 43.61 | 2156 | 2203 | 634.0 |
| D | 2 | 25 | 27836 | 40.43 | 2156 | 2203 | 634.0 |
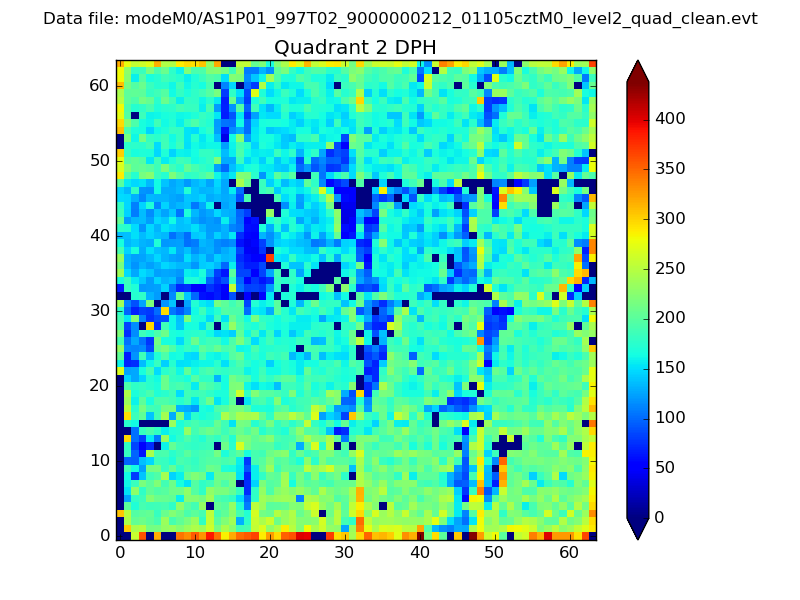
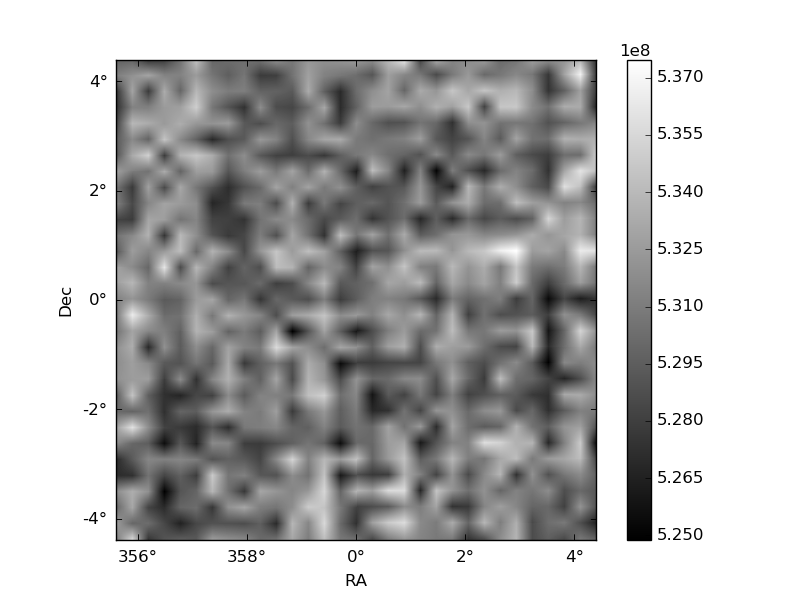
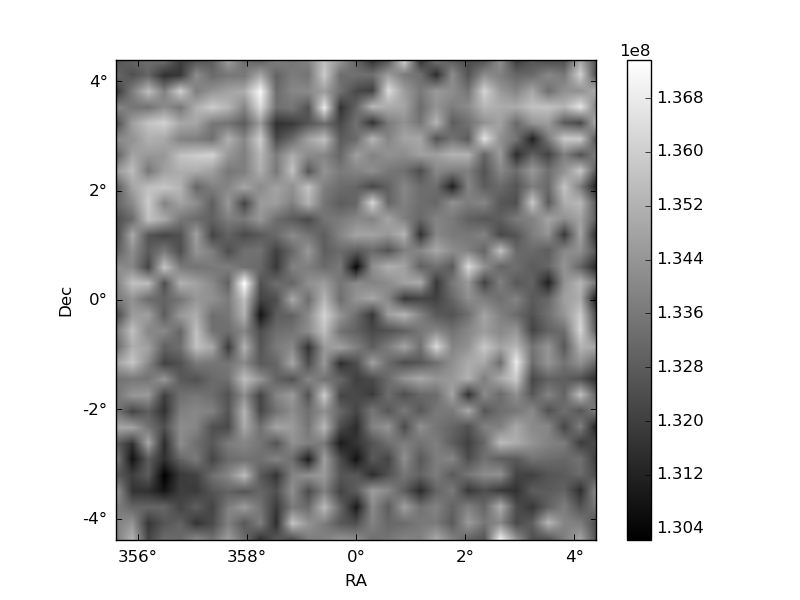
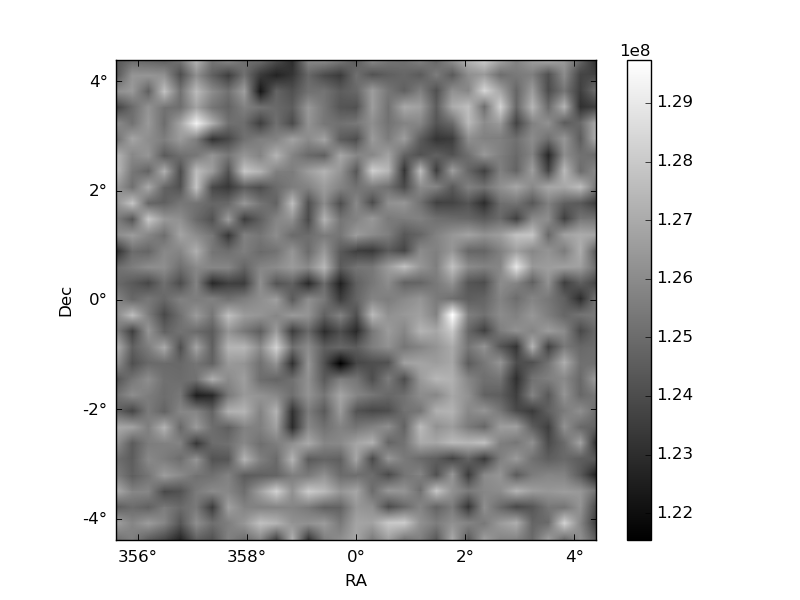
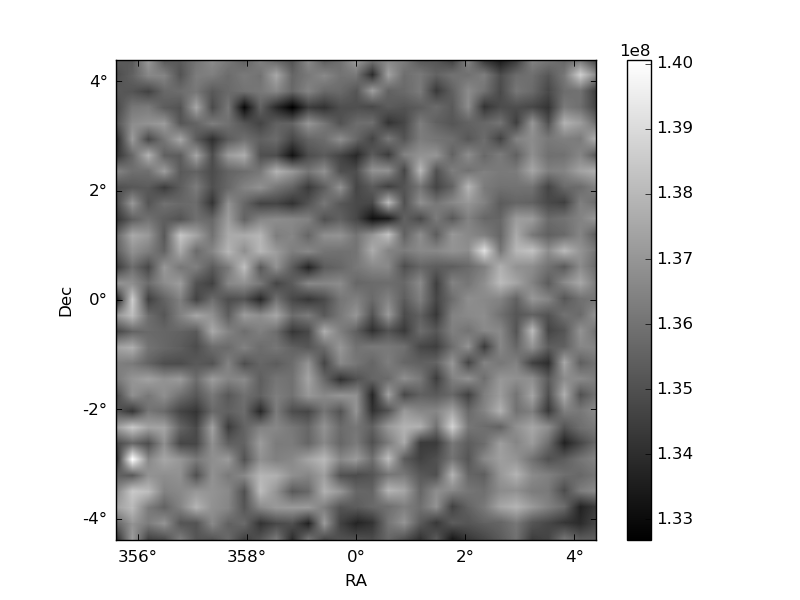
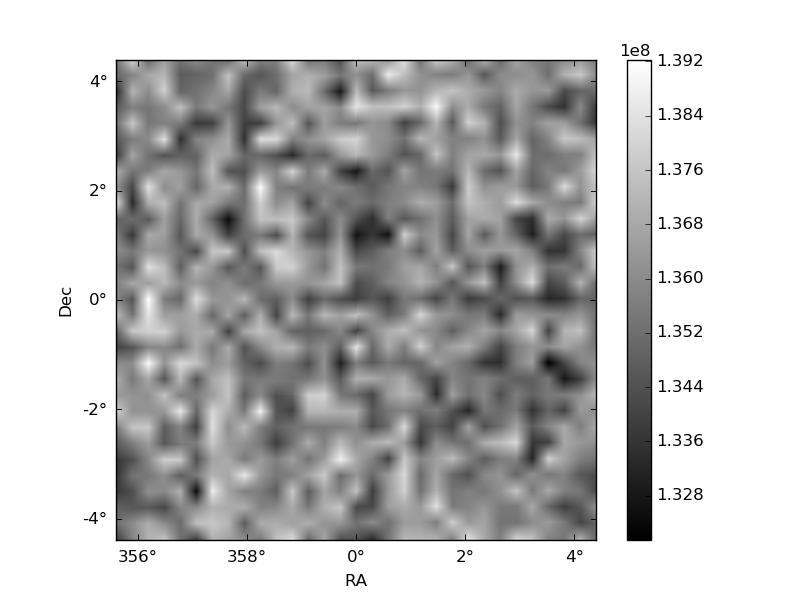
Histogram calculated using DETX and DETY for each event in the final _common_clean file
| Quadrant A | 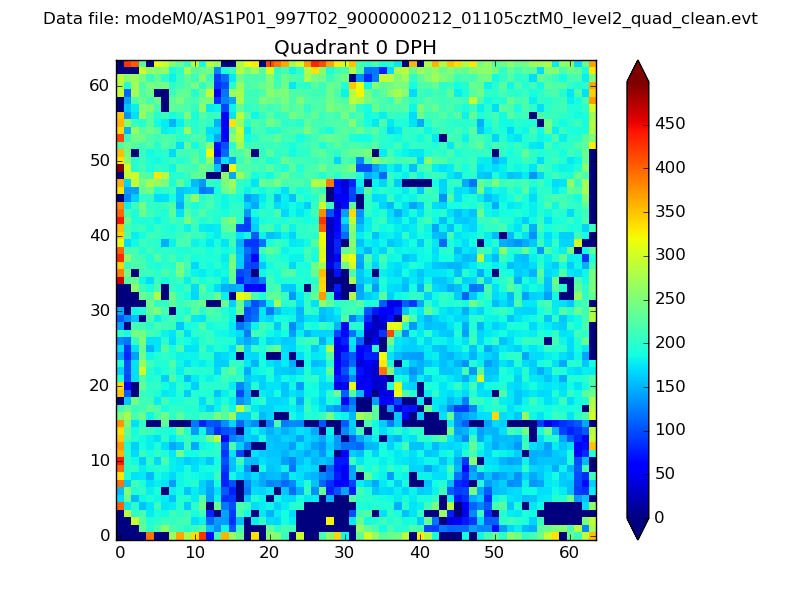 |
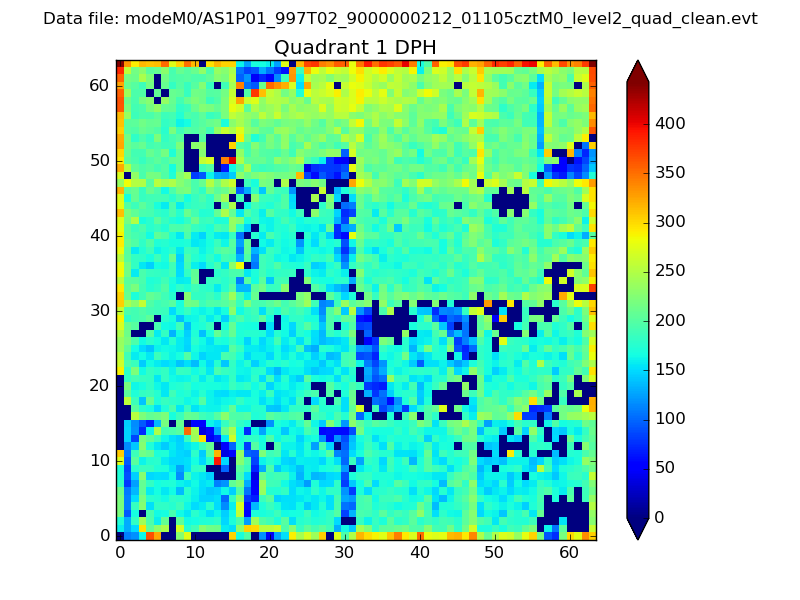 |
Quadrant B |
|---|---|---|---|
| Quadrant D | 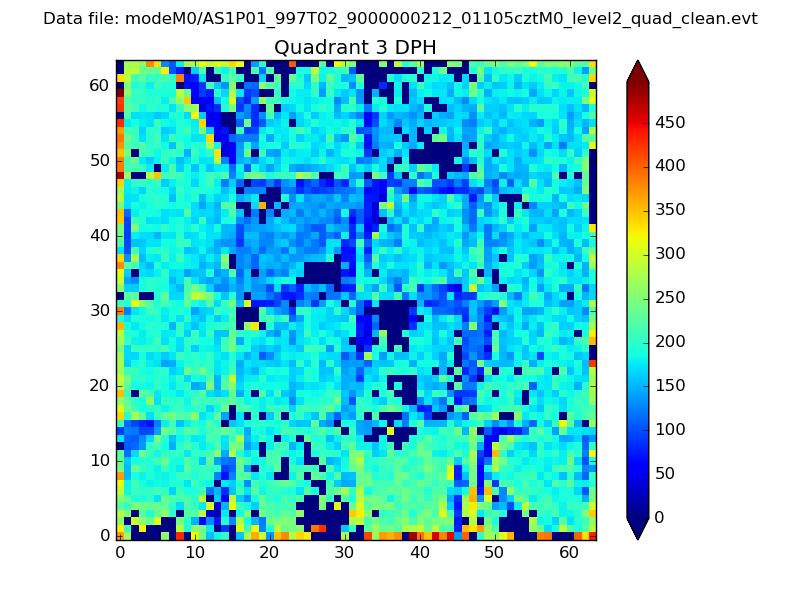 |
 |
Quadrant C |
| Plot type | Count rate plots | Images |
|---|---|---|
| Comparison with Poisson distribution Blue bars denote a histogram of data divided into 1 sec bins. Red curve is a Poisson curve with rate = median count rate of data. |
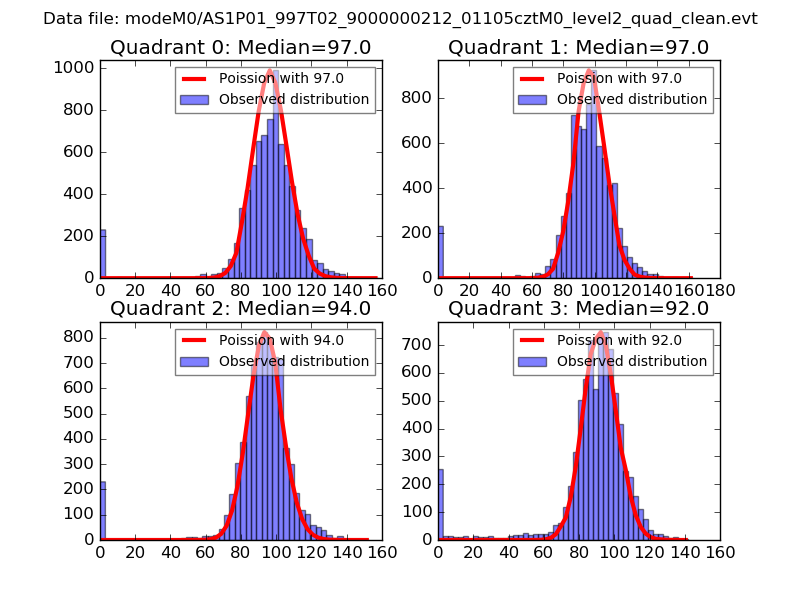 |
 |
| Quadrant-wise count rates Data is divided into 100 sec bins |
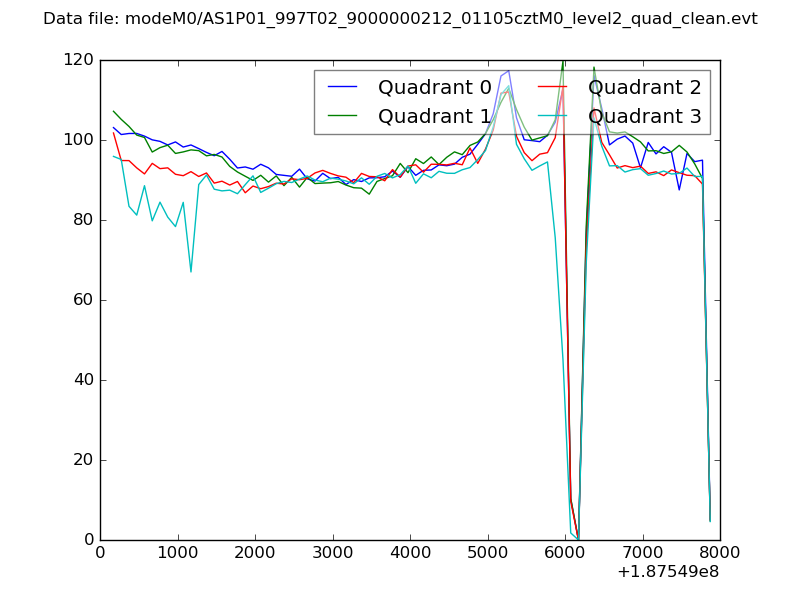 |
|
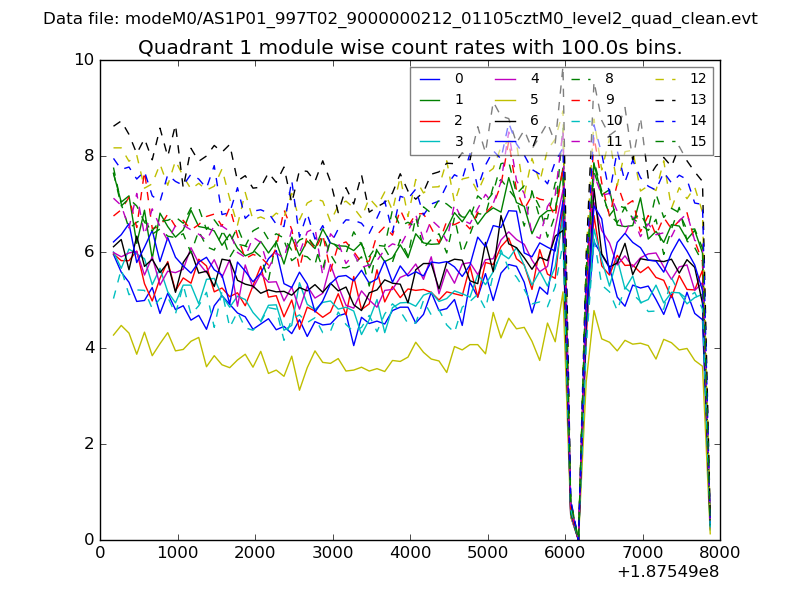
| Module-wise count rates for Quadrant A Data is divided into 100 sec bins |
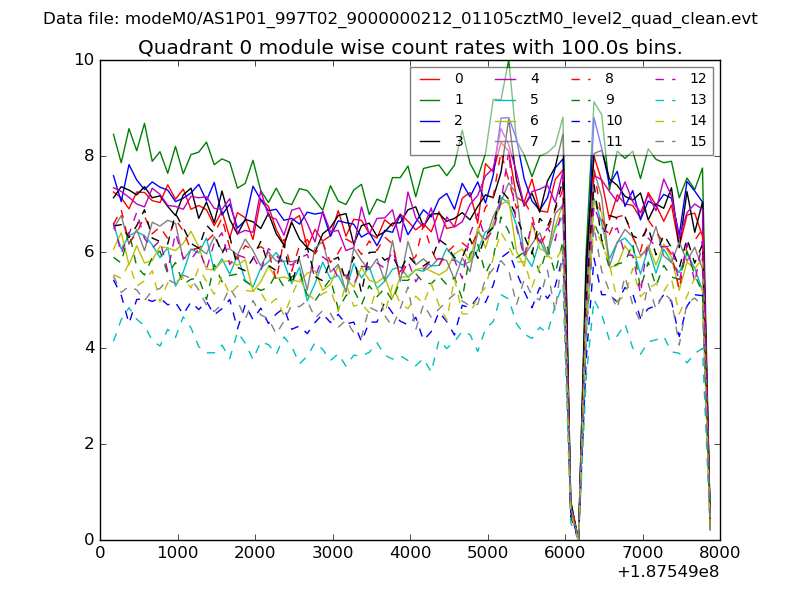 |
 |
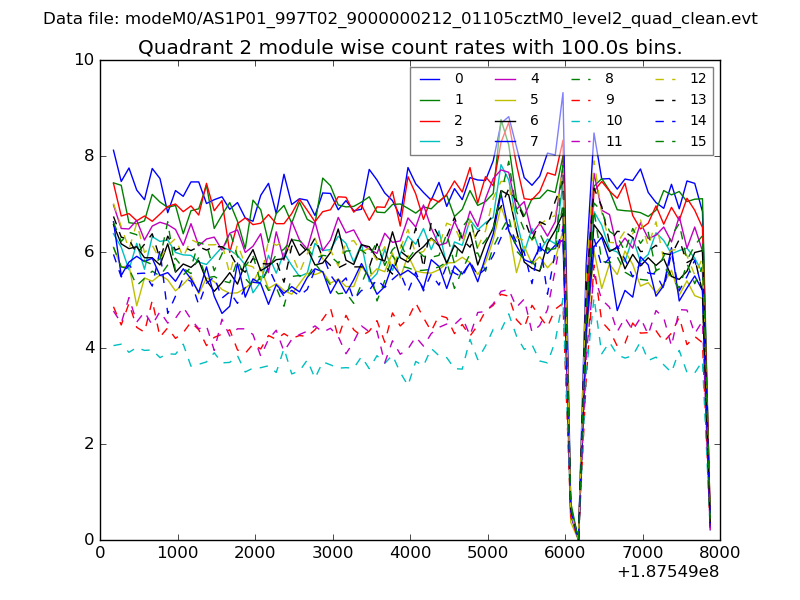
| Module-wise count rates for Quadrant B Data is divided into 100 sec bins |
 |
 |
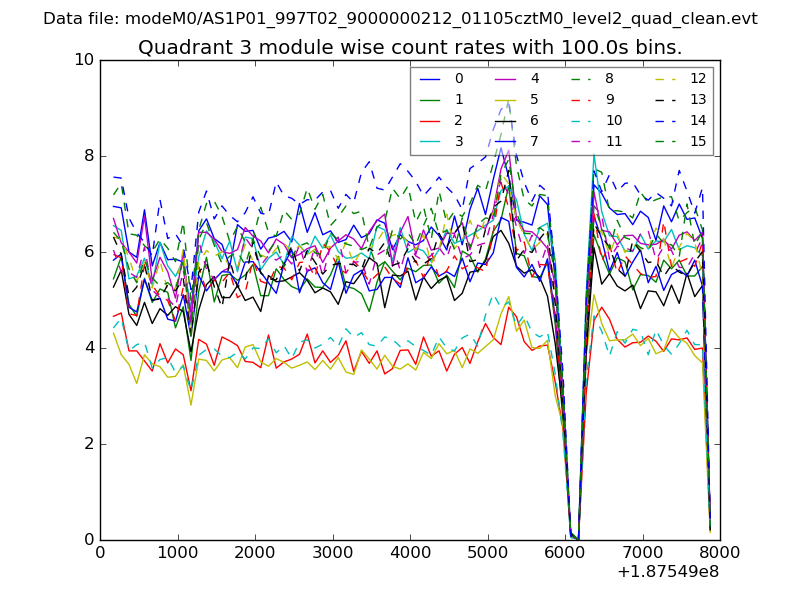
| Module-wise count rates for Quadrant C Data is divided into 100 sec bins |
 |
 |
| Module-wise count rates for Quadrant D Data is divided into 100 sec bins |
 |
 |
| Parameter | Plot |
|---|---|
| CZT HV Monitor | 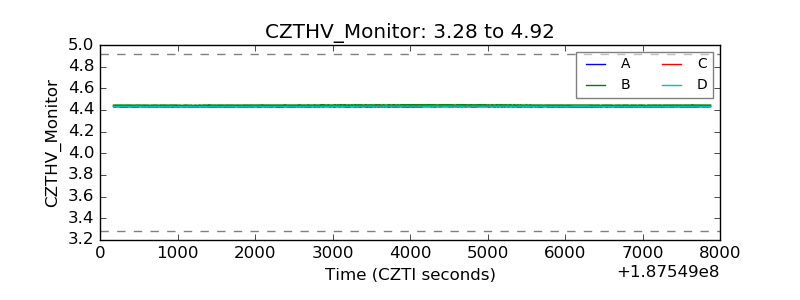 |
| D_VDD | 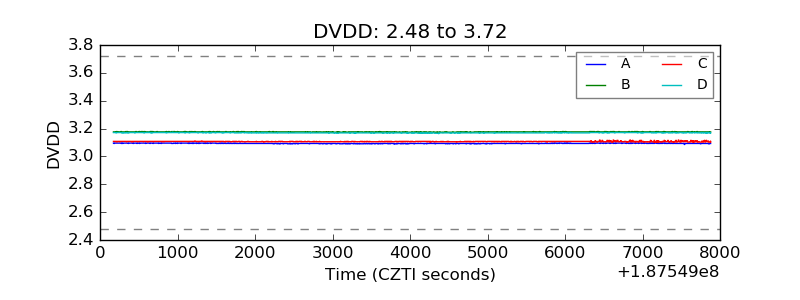 |
| Temperature 1 |  |
| Veto HV Monitor | 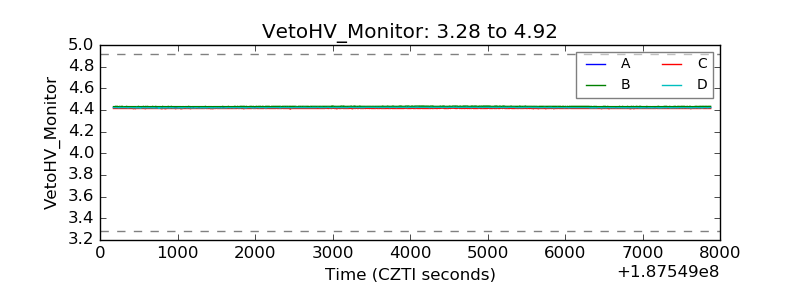 |
| Veto LLD | 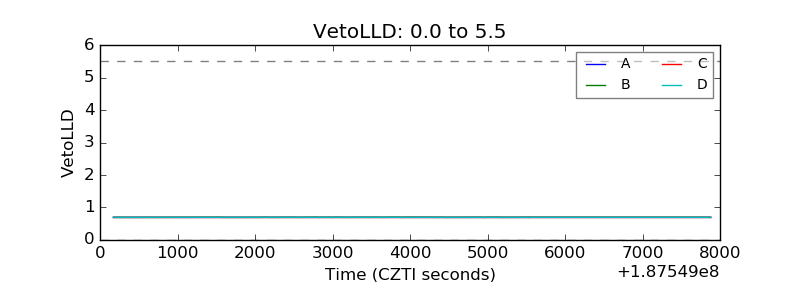 |
| Alpha Counter | 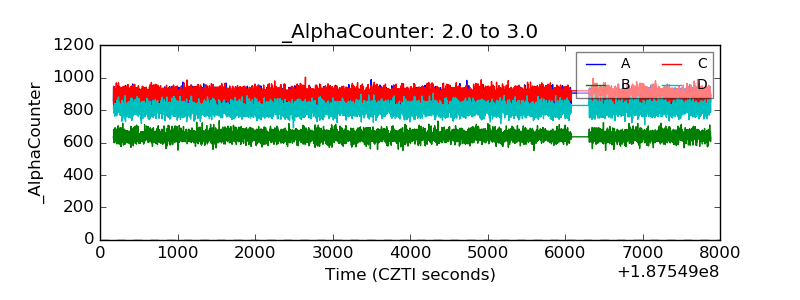 |
| _CPM_Rate | 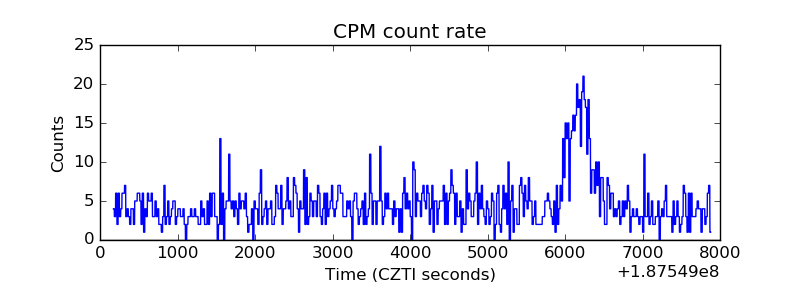 |
| CZT Counter | 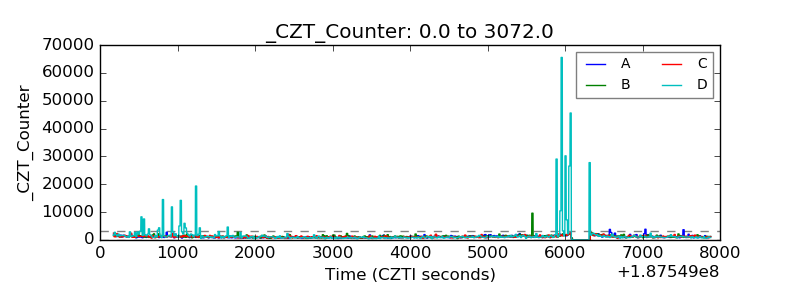 |
| +2.5 Volts monitor |  |
| +5 Volts monitor | 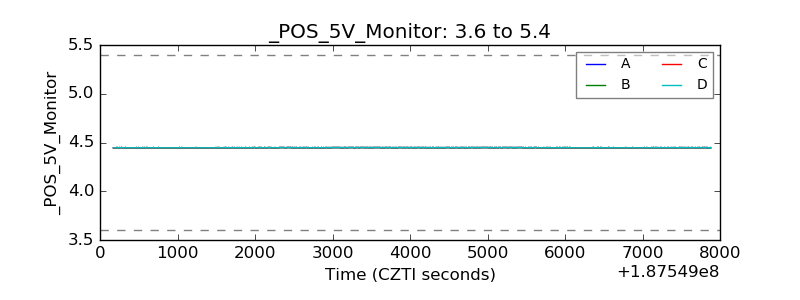 |
| _ROLL_ROT | 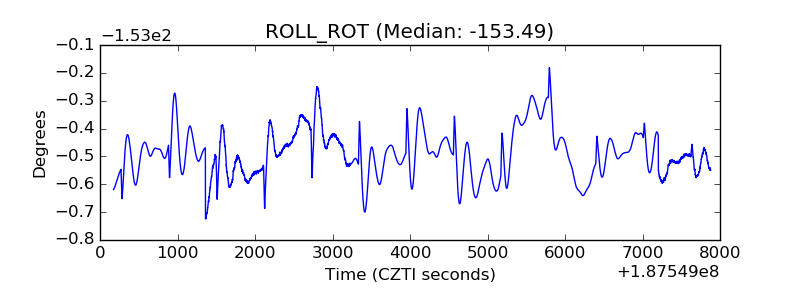 |
| _Roll_DEC | 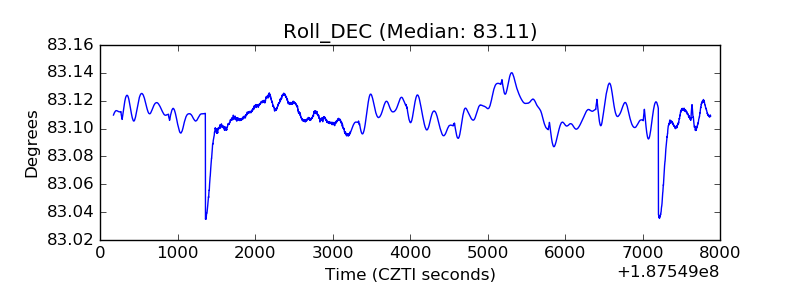 |
| _Roll_RA | 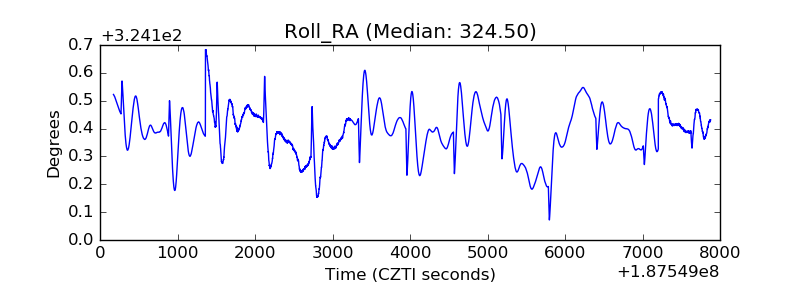 |
| Veto Counter | 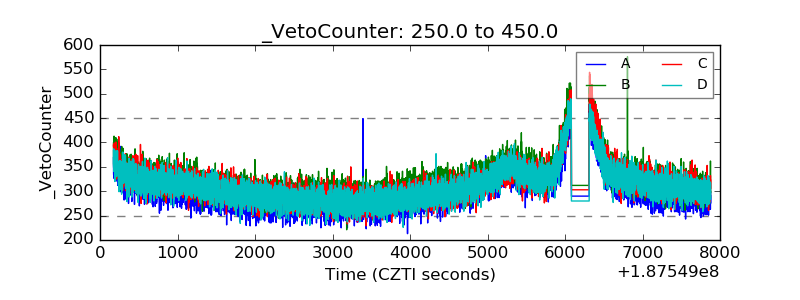 |