| Param | Original file | Final file |
|---|---|---|
| Filename | modeM0/AS1P01_997T02_9000000212_01107cztM0_level2.evt | modeM0/AS1P01_997T02_9000000212_01107cztM0_level2_quad_clean.evt |
| Size (bytes) | 1,130,247,360 | 107,190,720 |
| Size | 1.1 GB | 102.2 MB |
| Events in quadrant A | 8,349,340 | 696,331 |
| Events in quadrant B | 8,775,835 | 695,325 |
| Events in quadrant C | 8,634,685 | 678,999 |
| Events in quadrant D | 7,990,714 | 672,856 |
| Mode M9 | |||
|---|---|---|---|
| Quadrant | BADHDUFLAG | Total packets | Discarded packets |
| A | 0 | 8 | 0 |
| B | 0 | 8 | 0 |
| C | 0 | 8 | 0 |
| D | 0 | 9 | 0 |
| Mode M0 | |||
|---|---|---|---|
| Quadrant | BADHDUFLAG | Total packets | Discarded packets |
| A | 0 | 29888 | 3 |
| B | 0 | 31158 | 2 |
| C | 0 | 30770 | 2 |
| D | 0 | 28897 | 2 |
| Mode SS | |||
|---|---|---|---|
| Quadrant | BADHDUFLAG | Total packets | Discarded packets |
| A | 0 | 148 | 0 |
| B | 0 | 148 | 0 |
| C | 0 | 148 | 0 |
| D | 0 | 148 | 0 |
| Quadrant | Total seconds | Saturated seconds | Saturation percentage |
|---|---|---|---|
| A | 7217 | 5 | 0.069281% |
| B | 7217 | 11 | 0.152418% |
| C | 7217 | 3 | 0.041569% |
| D | 7217 | 34 | 0.471110% |
Noise dominated data is calculated using 1-second bins in cleaned event files. If a bin has >2000 counts, and if more than 50% of those come from <1% of pixels, then it is considered to be noise-dominated and hence unusable.
| Quadrant | # 1 sec bins | Bins with >0 counts | Bins with >2000 counts | High rate bins dominated by noise | Noise dominated (total time) | Noise dominated (detector-on time) | Marked lightcurve |
|---|---|---|---|---|---|---|---|
| A | 7882 | 7218 | 141 | 141 | 1.79% | 1.95% | 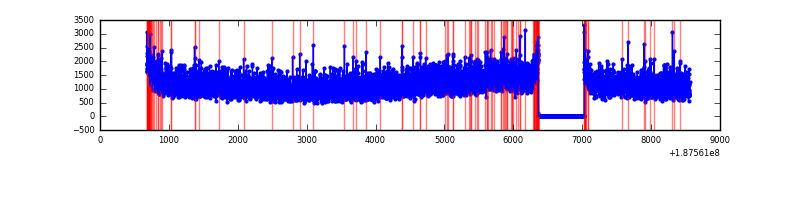 |
| B | 7882 | 7218 | 194 | 194 | 2.46% | 2.69% | 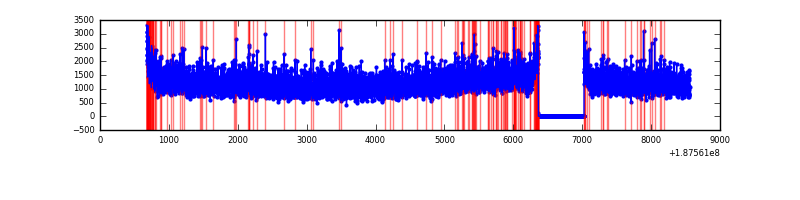 |
| C | 7882 | 7218 | 161 | 161 | 2.04% | 2.23% | 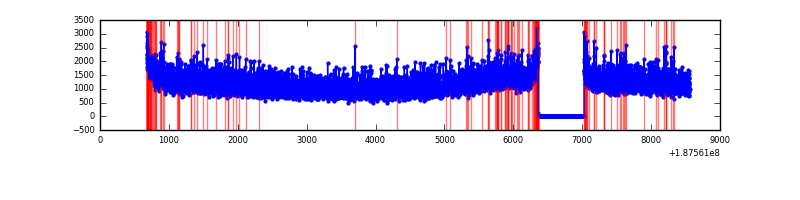 |
| D | 7882 | 7218 | 207 | 207 | 2.63% | 2.87% | 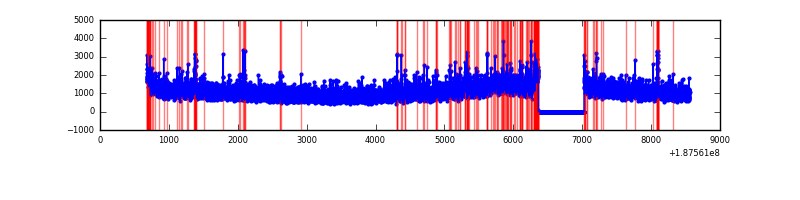 |
Top three noisy pixels from each quadrant. If the there are fewer than three noisy pixels in the level2.evt file, extra rows are filled as -1
| Pixel properties | Quadrant properties | ||||||
|---|---|---|---|---|---|---|---|
| Quadrant | DetID | PixID | Counts | Sigma | Mean | Median | Sigma |
| A | 13 | 147 | 17491 | 29.32 | 2171 | 2184 | 522.2 |
| A | 11 | 79 | 9444 | 13.9 | 2171 | 2184 | 522.2 |
| A | 3 | 111 | 6880 | 8.99 | 2171 | 2184 | 522.2 |
| B | 2 | 32 | 75136 | 136.65 | 2266 | 2277 | 533.2 |
| B | 5 | 249 | 42962 | 76.31 | 2266 | 2277 | 533.2 |
| B | 15 | 85 | 15640 | 25.06 | 2266 | 2277 | 533.2 |
| C | 15 | 241 | 346626 | 593.95 | 2078 | 2153 | 580.0 |
| C | 10 | 207 | 126685 | 214.72 | 2078 | 2153 | 580.0 |
| C | 3 | 111 | 25600 | 40.43 | 2078 | 2153 | 580.0 |
| D | 2 | 216 | 279003 | 444.69 | 2011 | 2081 | 622.7 |
| D | 10 | 215 | 83908 | 131.4 | 2011 | 2081 | 622.7 |
| D | 10 | 125 | 41099 | 62.66 | 2011 | 2081 | 622.7 |
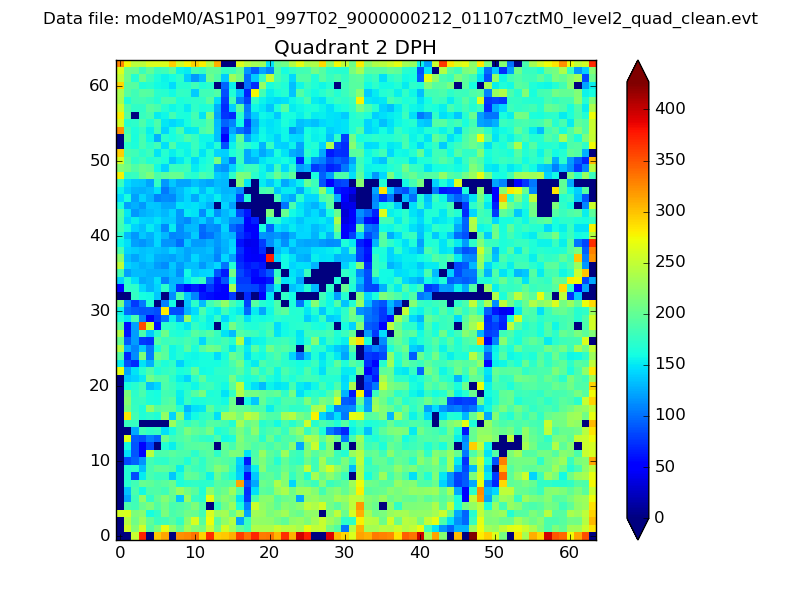
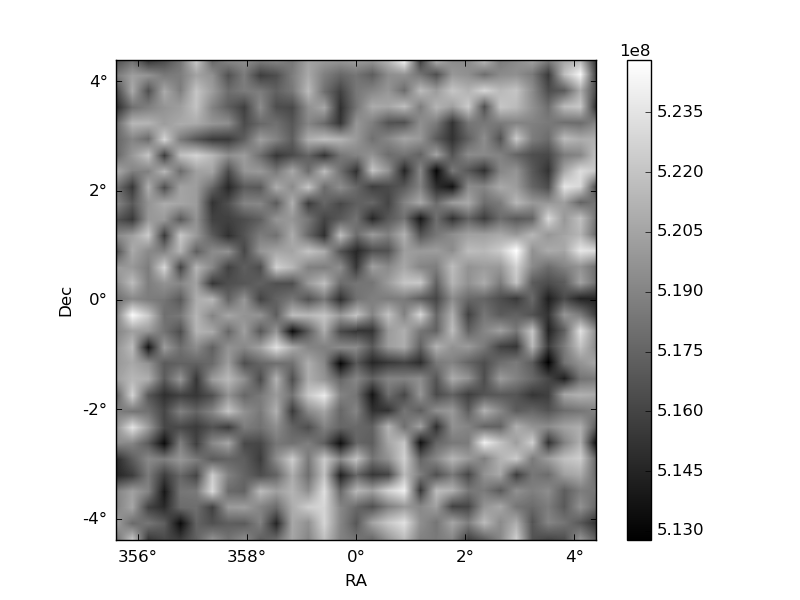
Histogram calculated using DETX and DETY for each event in the final _common_clean file
| Quadrant A | 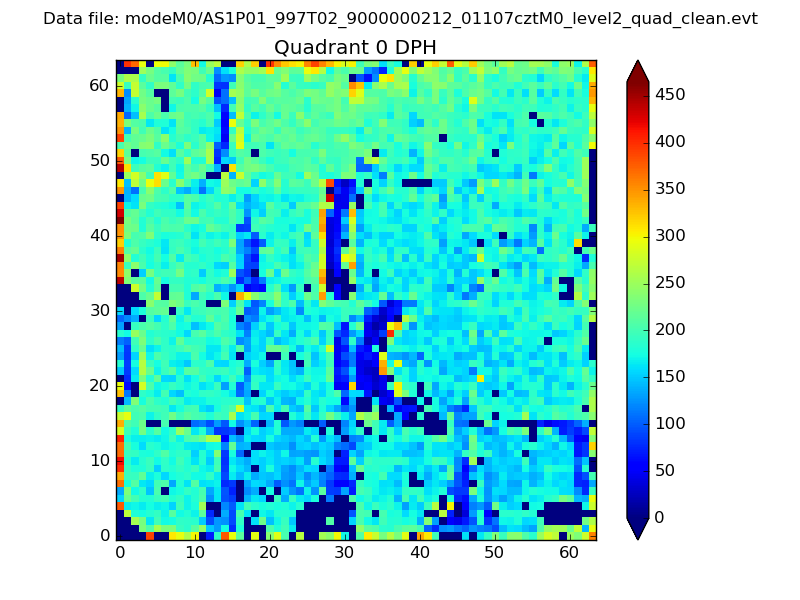 |
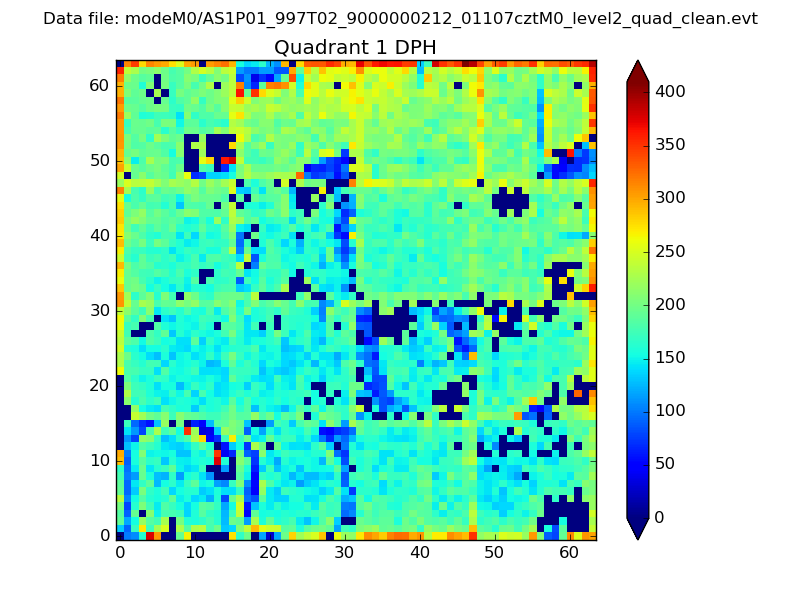 |
Quadrant B |
|---|---|---|---|
| Quadrant D | 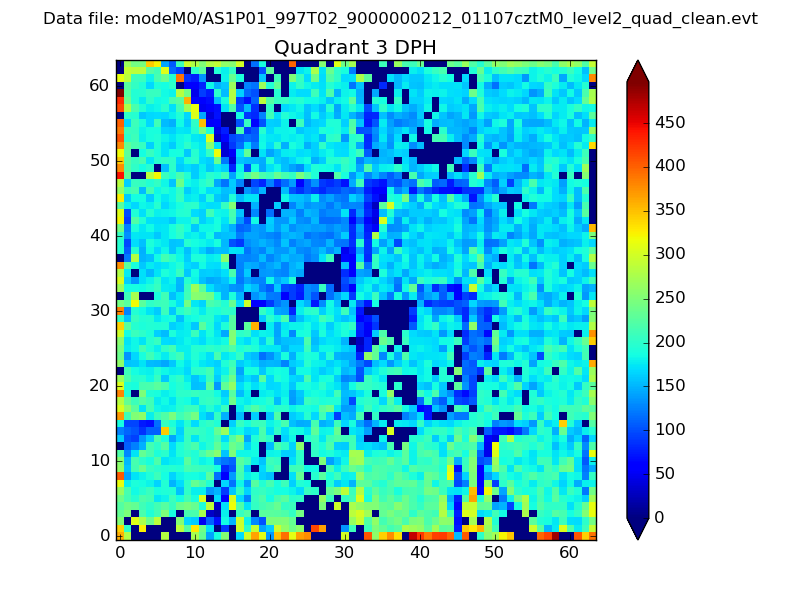 |
 |
Quadrant C |
| Plot type | Count rate plots | Images |
|---|---|---|
| Comparison with Poisson distribution Blue bars denote a histogram of data divided into 1 sec bins. Red curve is a Poisson curve with rate = median count rate of data. |
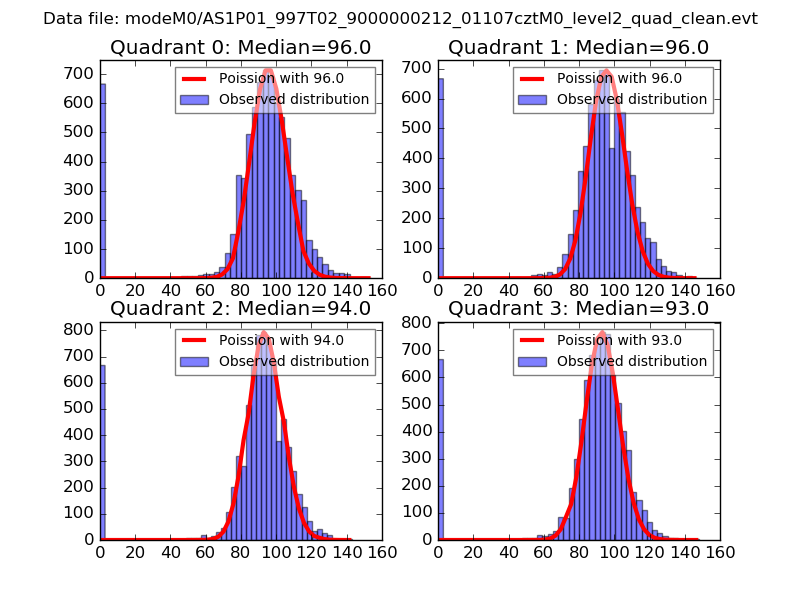 |
 |
| Quadrant-wise count rates Data is divided into 100 sec bins |
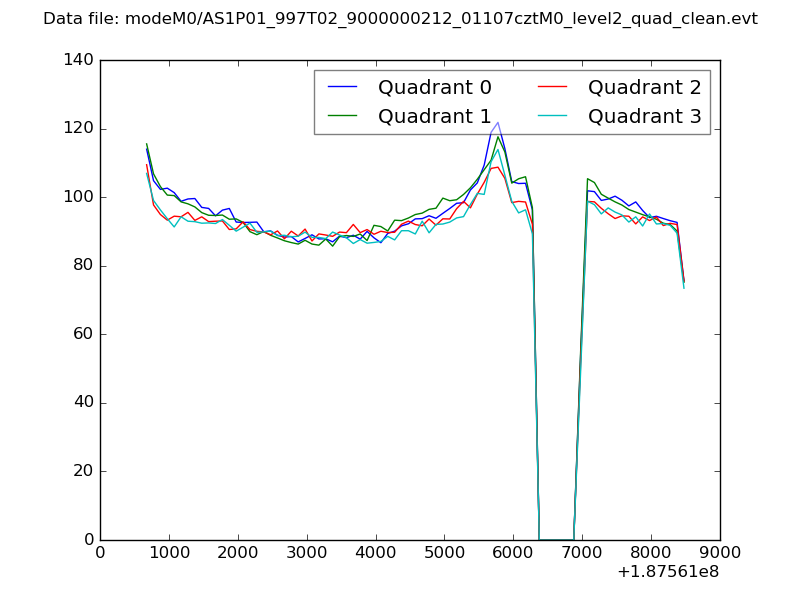 |
|
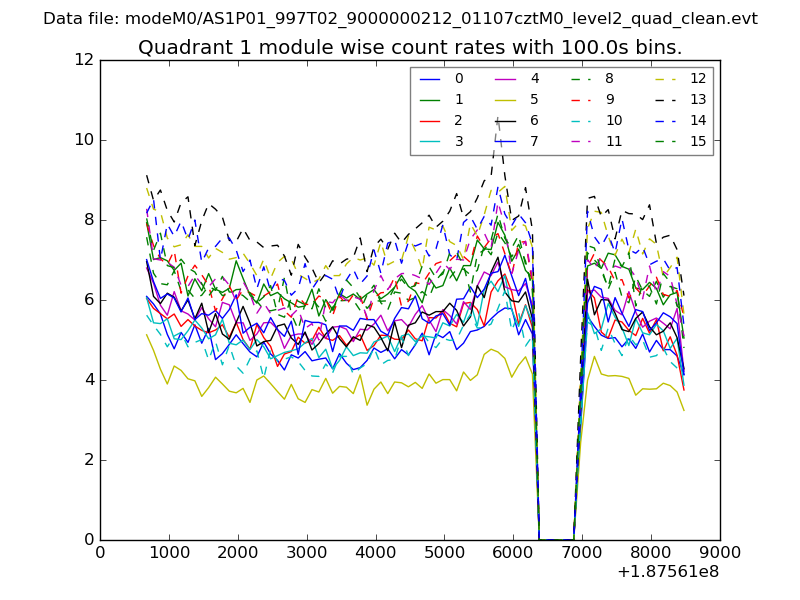
| Module-wise count rates for Quadrant A Data is divided into 100 sec bins |
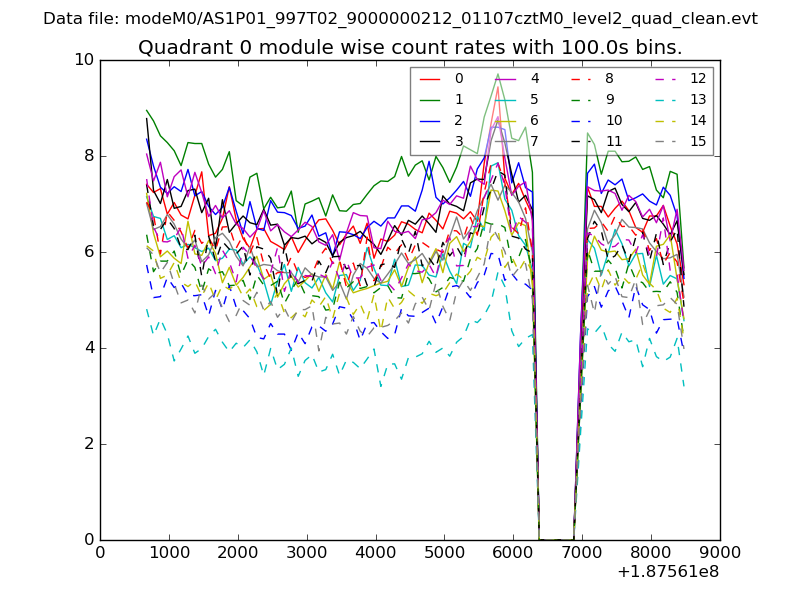 |
 |
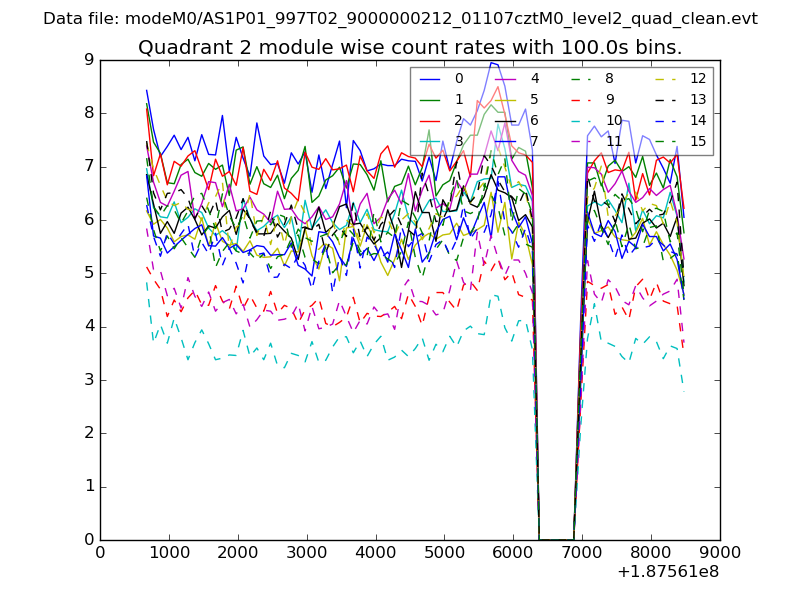
| Module-wise count rates for Quadrant B Data is divided into 100 sec bins |
 |
 |
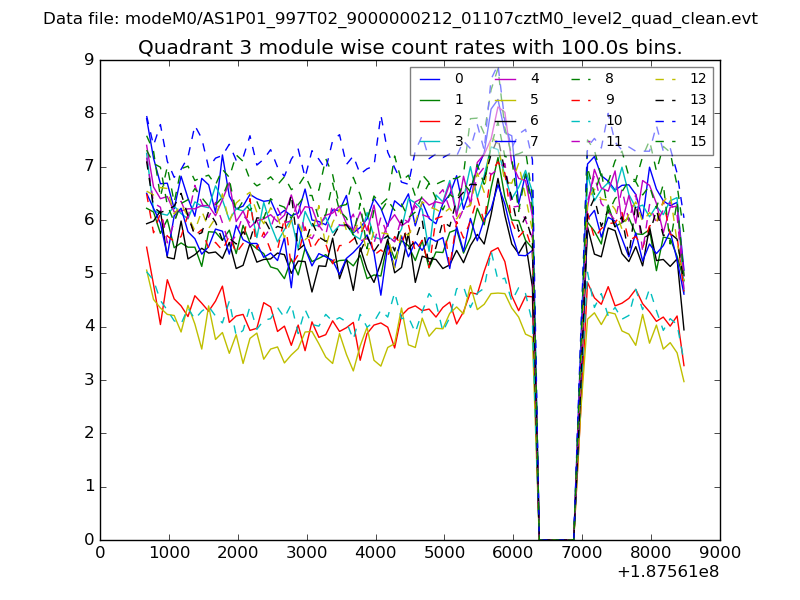
| Module-wise count rates for Quadrant C Data is divided into 100 sec bins |
 |
 |
| Module-wise count rates for Quadrant D Data is divided into 100 sec bins |
 |
 |
| Parameter | Plot |
|---|---|
| CZT HV Monitor | 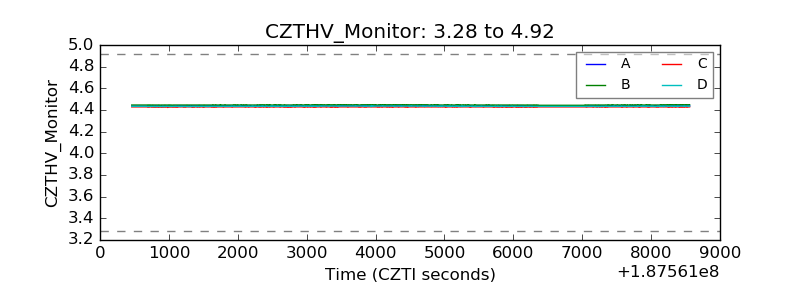 |
| D_VDD | 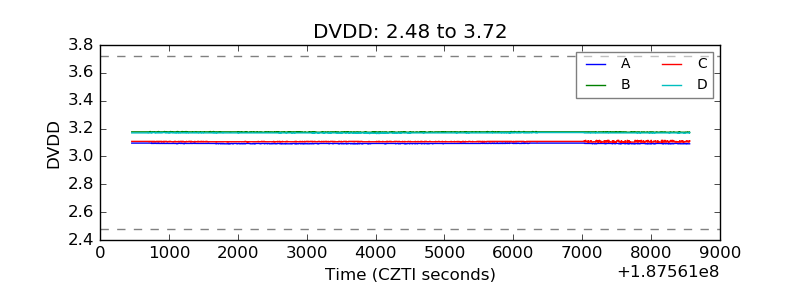 |
| Temperature 1 | 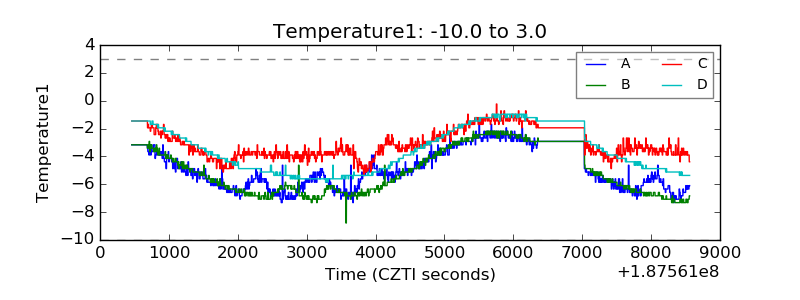 |
| Veto HV Monitor | 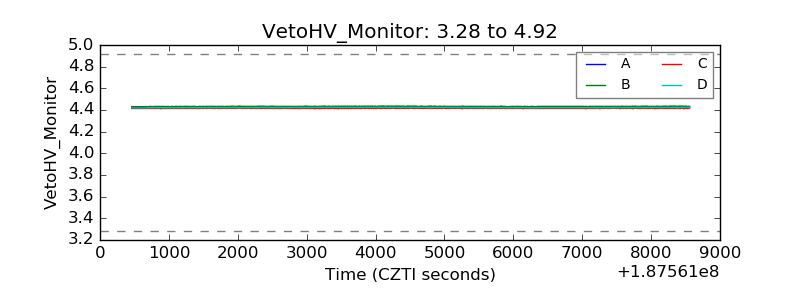 |
| Veto LLD | 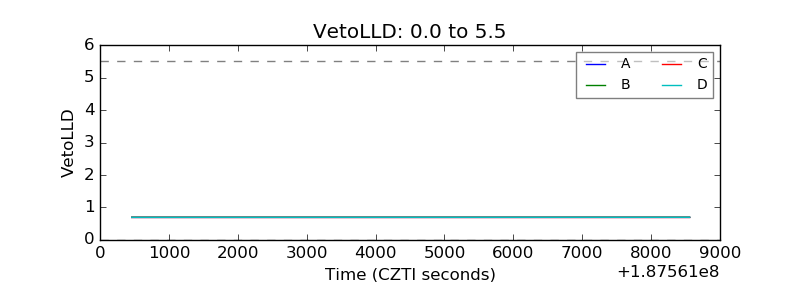 |
| Alpha Counter | 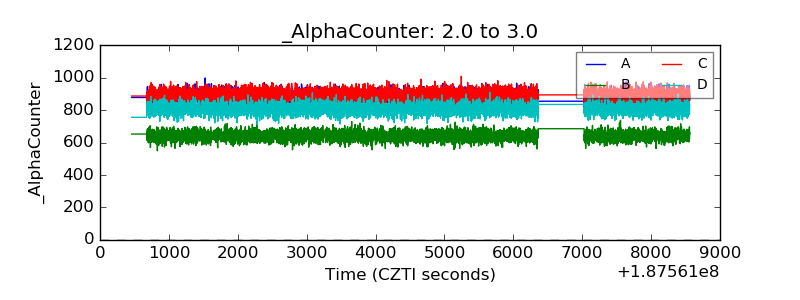 |
| _CPM_Rate | 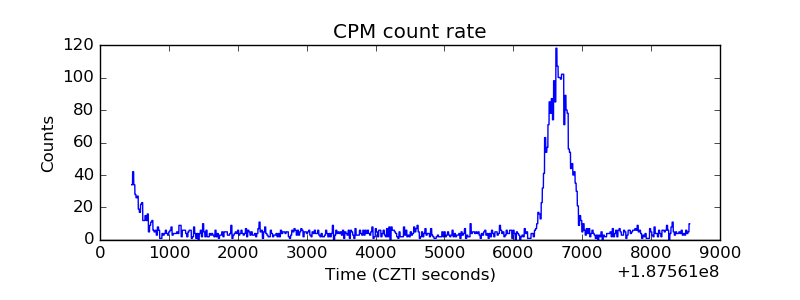 |
| CZT Counter | 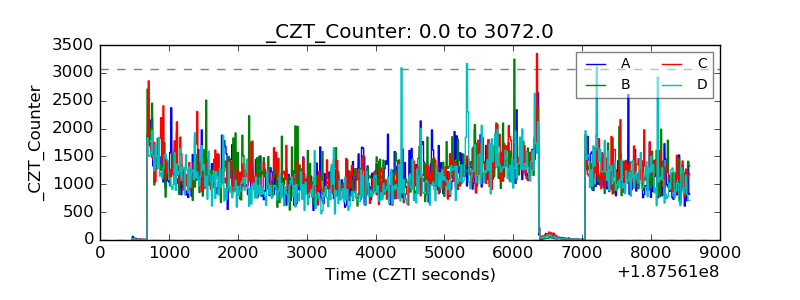 |
| +2.5 Volts monitor |  |
| +5 Volts monitor |  |
| _ROLL_ROT | 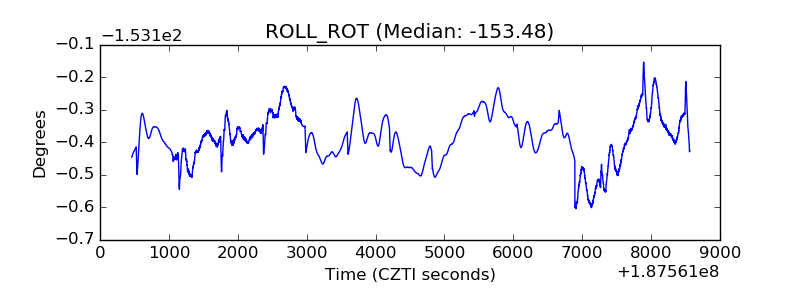 |
| _Roll_DEC | 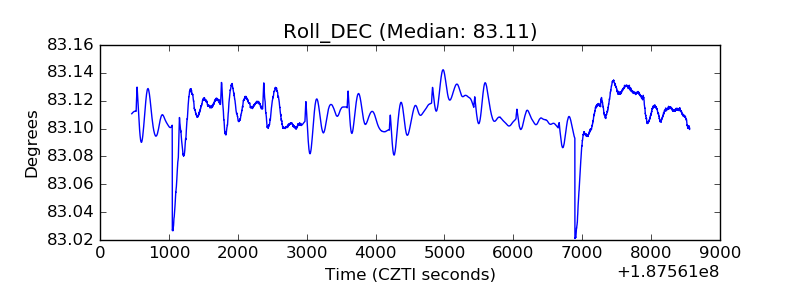 |
| _Roll_RA | 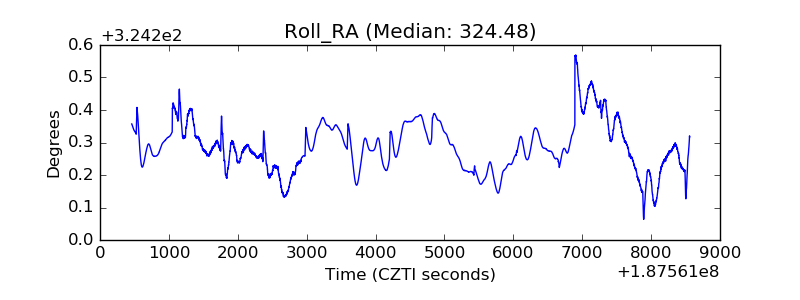 |
| Veto Counter | 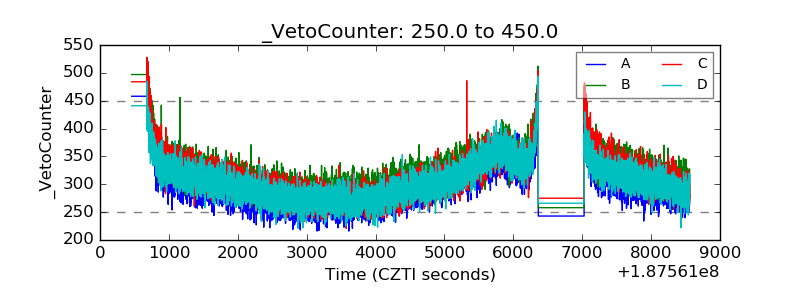 |