| Param | Original file | Final file |
|---|---|---|
| Filename | modeM0/AS1P01_997T02_9000000212_01109cztM0_level2.evt | modeM0/AS1P01_997T02_9000000212_01109cztM0_level2_quad_clean.evt |
| Size (bytes) | 1,071,892,800 | 103,201,920 |
| Size | 1022.2 MB | 98.4 MB |
| Events in quadrant A | 7,981,128 | 669,044 |
| Events in quadrant B | 8,409,726 | 669,231 |
| Events in quadrant C | 8,373,501 | 657,515 |
| Events in quadrant D | 7,241,095 | 649,840 |
| Mode M9 | |||
|---|---|---|---|
| Quadrant | BADHDUFLAG | Total packets | Discarded packets |
| A | 0 | 18 | 0 |
| B | 0 | 18 | 0 |
| C | 0 | 18 | 0 |
| D | 0 | 18 | 0 |
| Mode M0 | |||
|---|---|---|---|
| Quadrant | BADHDUFLAG | Total packets | Discarded packets |
| A | 0 | 28592 | 3 |
| B | 0 | 29860 | 2 |
| C | 0 | 29778 | 2 |
| D | 0 | 26397 | 2 |
| Mode SS | |||
|---|---|---|---|
| Quadrant | BADHDUFLAG | Total packets | Discarded packets |
| A | 0 | 142 | 0 |
| B | 0 | 142 | 0 |
| C | 0 | 142 | 0 |
| D | 0 | 142 | 0 |
| Quadrant | Total seconds | Saturated seconds | Saturation percentage |
|---|---|---|---|
| A | 6885 | 10 | 0.145243% |
| B | 6885 | 9 | 0.130719% |
| C | 6885 | 17 | 0.246914% |
| D | 6885 | 15 | 0.217865% |
Noise dominated data is calculated using 1-second bins in cleaned event files. If a bin has >2000 counts, and if more than 50% of those come from <1% of pixels, then it is considered to be noise-dominated and hence unusable.
| Quadrant | # 1 sec bins | Bins with >0 counts | Bins with >2000 counts | High rate bins dominated by noise | Noise dominated (total time) | Noise dominated (detector-on time) | Marked lightcurve |
|---|---|---|---|---|---|---|---|
| A | 8675 | 6887 | 129 | 129 | 1.49% | 1.87% | 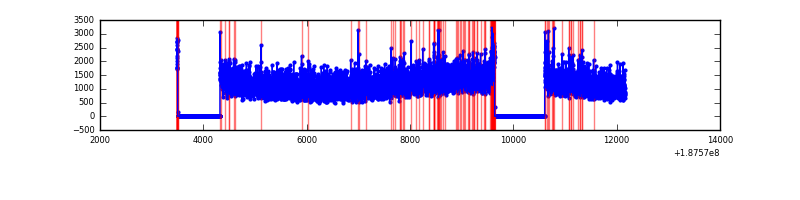 |
| B | 8675 | 6887 | 137 | 137 | 1.58% | 1.99% | 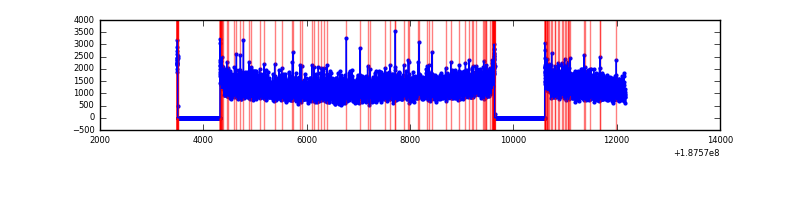 |
| C | 8675 | 6887 | 203 | 203 | 2.34% | 2.95% | 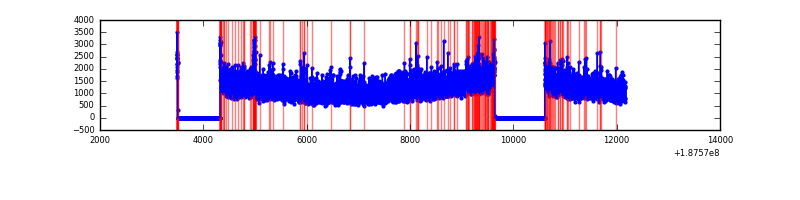 |
| D | 8675 | 6887 | 94 | 94 | 1.08% | 1.36% | 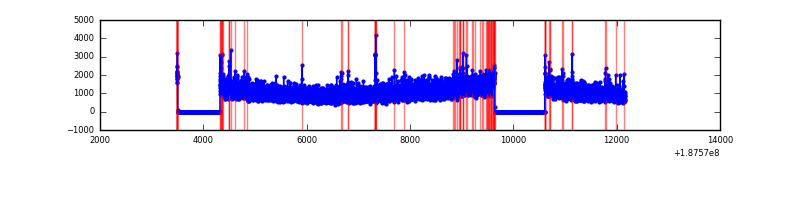 |
Top three noisy pixels from each quadrant. If the there are fewer than three noisy pixels in the level2.evt file, extra rows are filled as -1
| Pixel properties | Quadrant properties | ||||||
|---|---|---|---|---|---|---|---|
| Quadrant | DetID | PixID | Counts | Sigma | Mean | Median | Sigma |
| A | 15 | 233 | 56891 | 111.32 | 2046 | 2060 | 492.6 |
| A | 4 | 32 | 42089 | 81.27 | 2046 | 2060 | 492.6 |
| A | 0 | 253 | 15746 | 27.79 | 2046 | 2060 | 492.6 |
| B | 2 | 32 | 119770 | 230.86 | 2152 | 2160 | 509.4 |
| B | 4 | 187 | 38974 | 72.26 | 2152 | 2160 | 509.4 |
| B | 15 | 22 | 36459 | 67.33 | 2152 | 2160 | 509.4 |
| C | 15 | 241 | 339383 | 619.0 | 1959 | 2031 | 545.0 |
| C | 10 | 207 | 315687 | 575.53 | 1959 | 2031 | 545.0 |
| C | 3 | 111 | 25796 | 43.61 | 1959 | 2031 | 545.0 |
| D | 2 | 216 | 116109 | 200.6 | 1878 | 1936 | 569.2 |
| D | 10 | 125 | 61086 | 103.92 | 1878 | 1936 | 569.2 |
| D | 10 | 215 | 29671 | 48.73 | 1878 | 1936 | 569.2 |
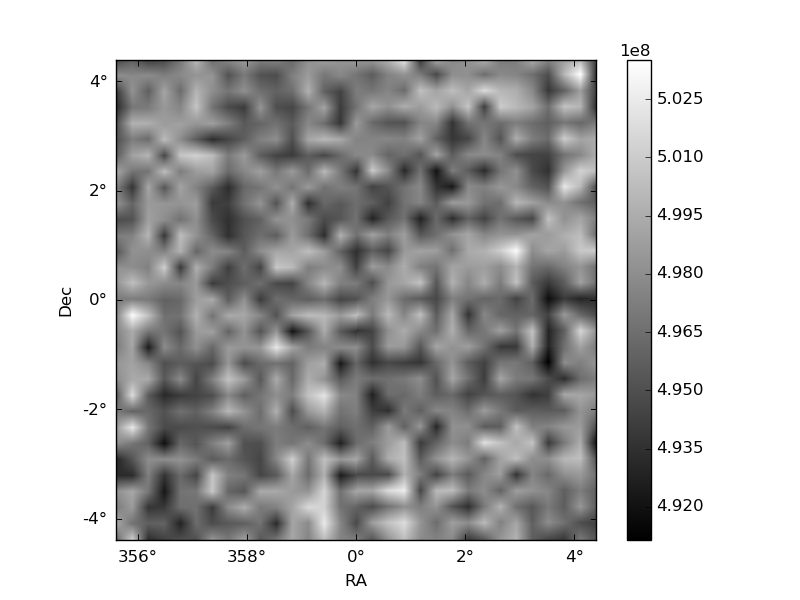
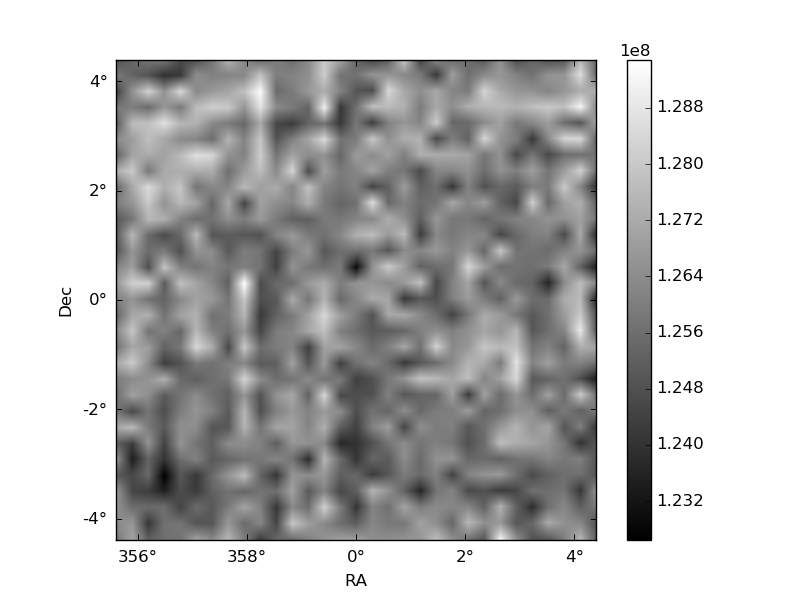
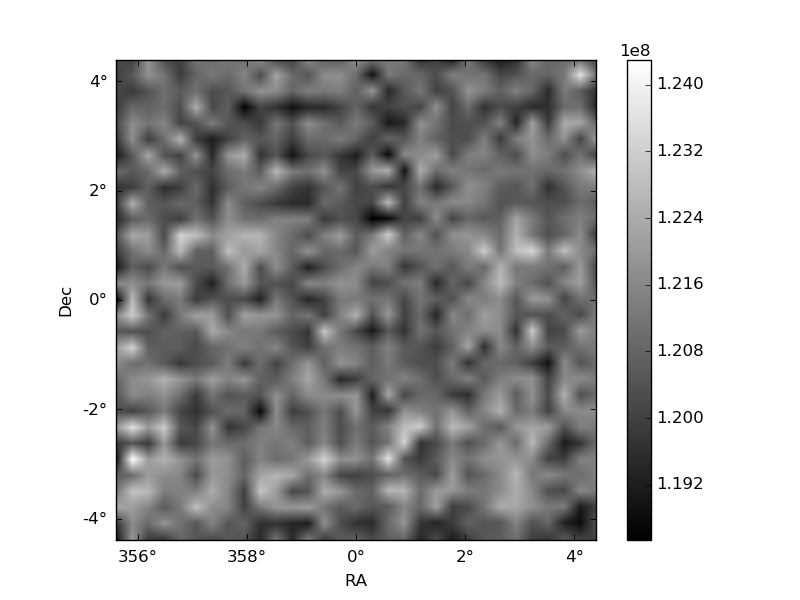
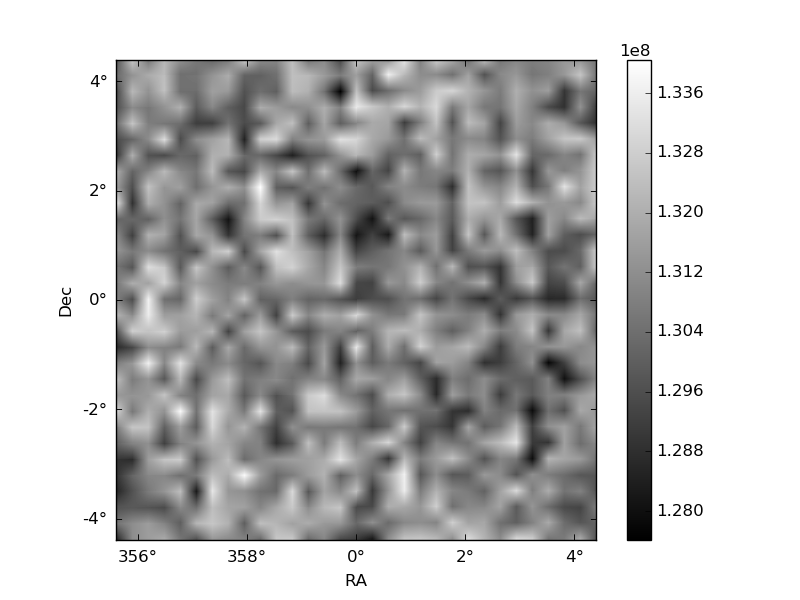
Histogram calculated using DETX and DETY for each event in the final _common_clean file
| Quadrant A | 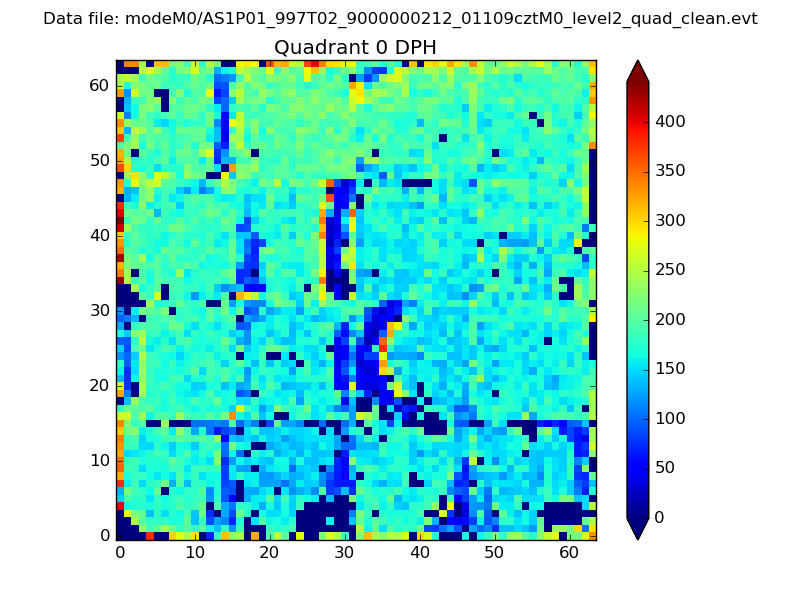 |
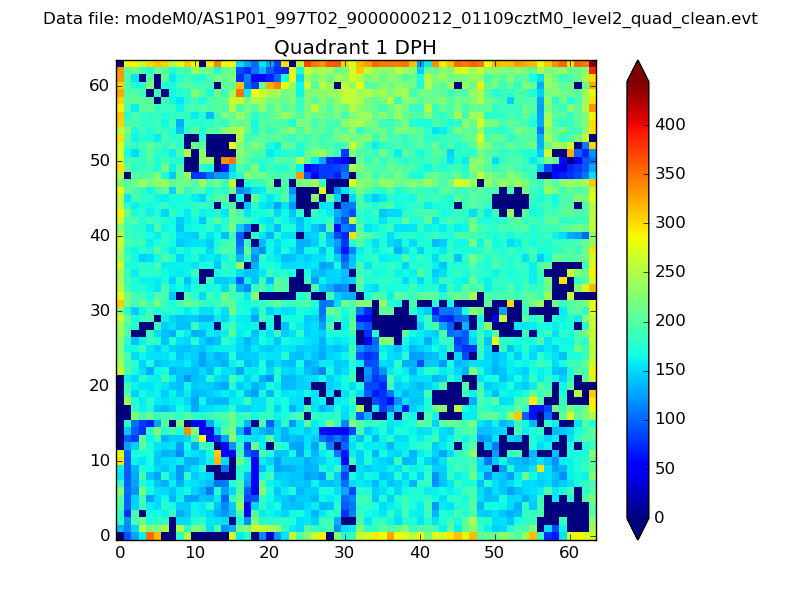 |
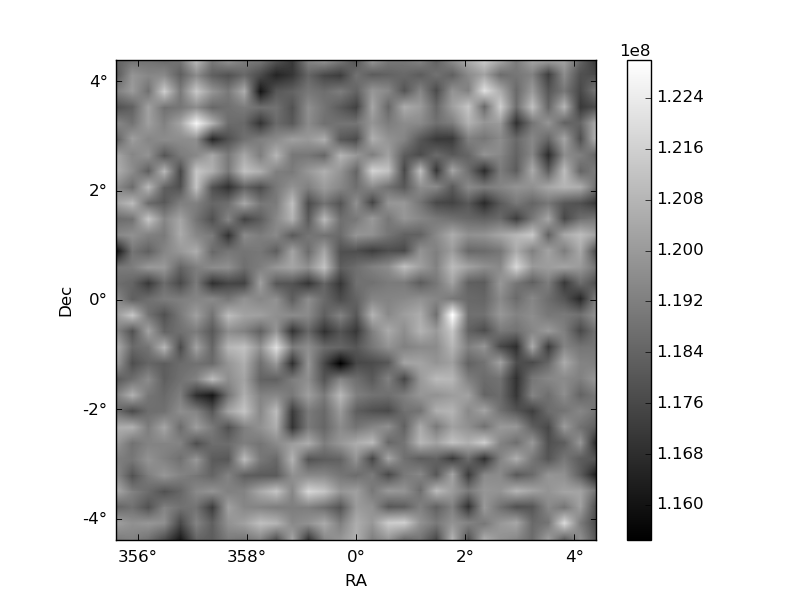
Quadrant B |
|---|---|---|---|
| Quadrant D | 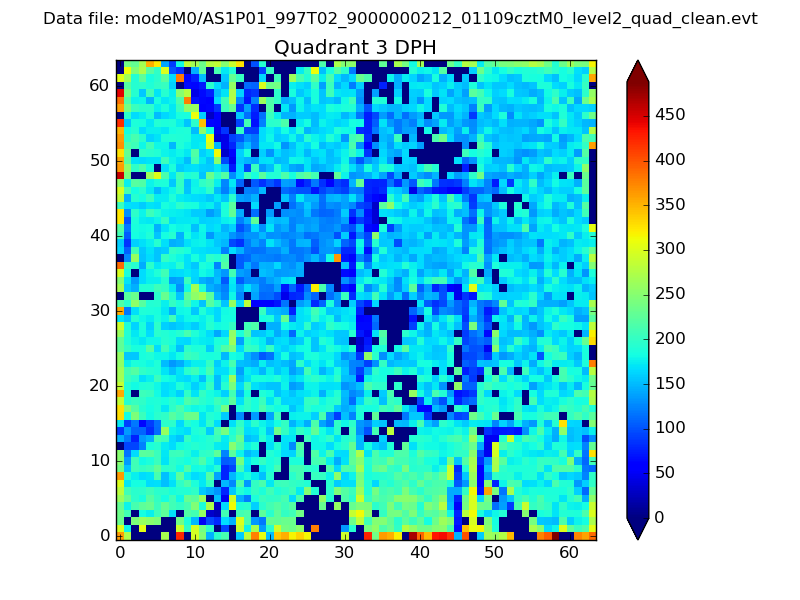 |
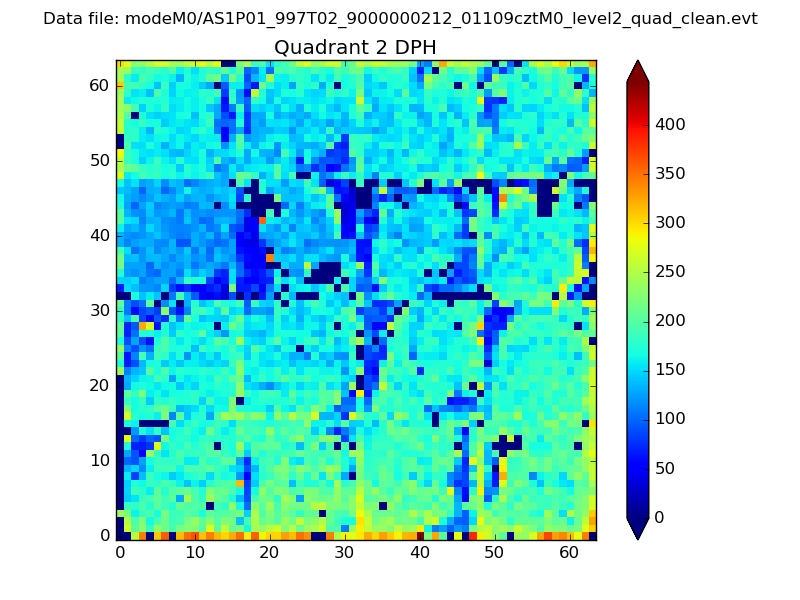 |
Quadrant C |
| Plot type | Count rate plots | Images |
|---|---|---|
| Comparison with Poisson distribution Blue bars denote a histogram of data divided into 1 sec bins. Red curve is a Poisson curve with rate = median count rate of data. |
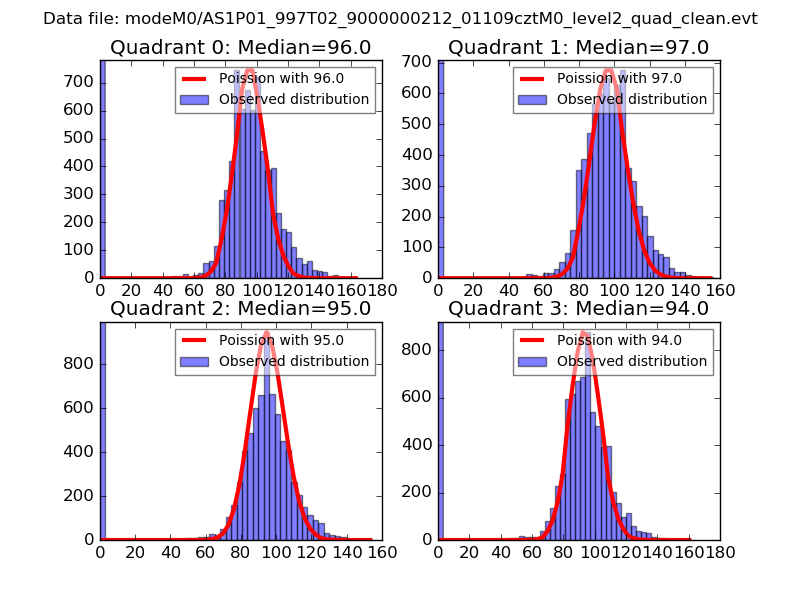 |
 |
| Quadrant-wise count rates Data is divided into 100 sec bins |
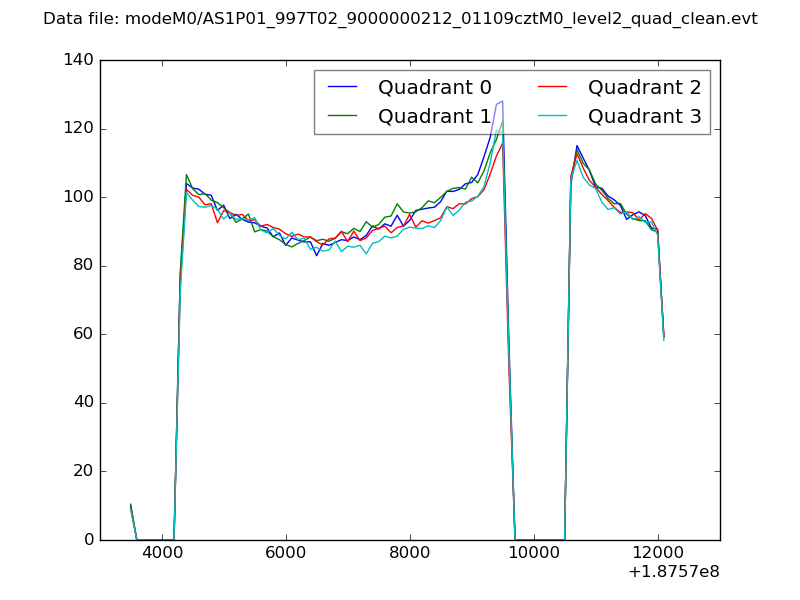 |
|
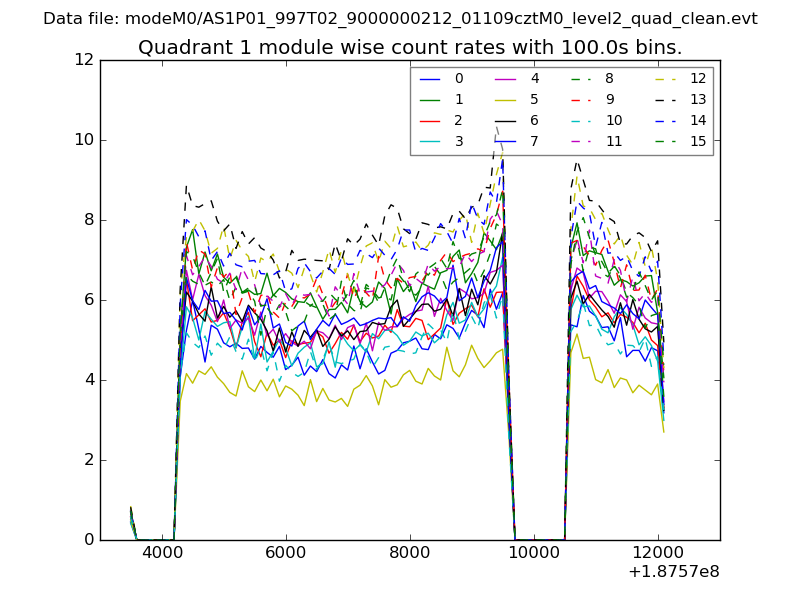
| Module-wise count rates for Quadrant A Data is divided into 100 sec bins |
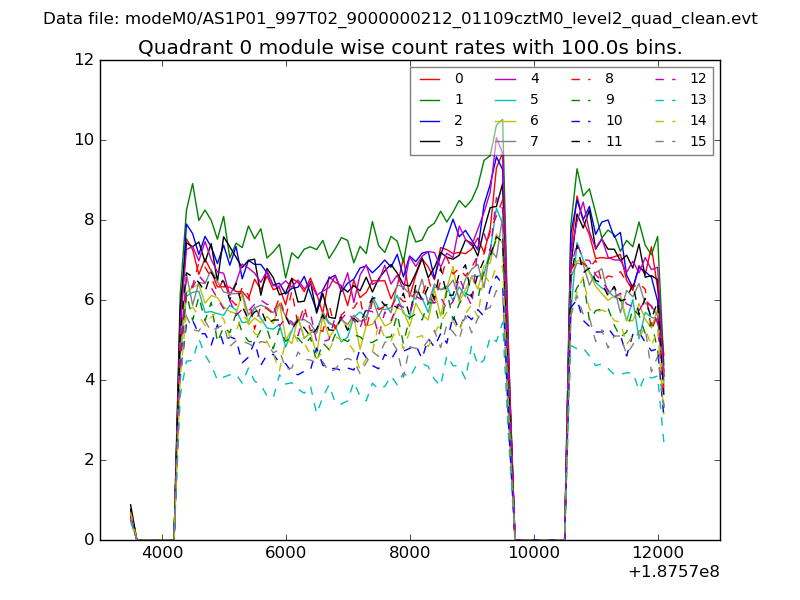 |
 |
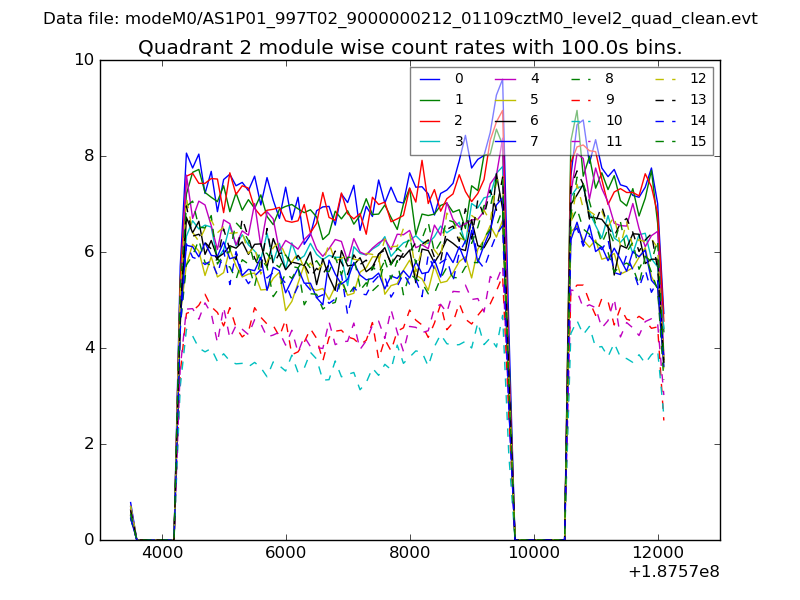
| Module-wise count rates for Quadrant B Data is divided into 100 sec bins |
 |
 |
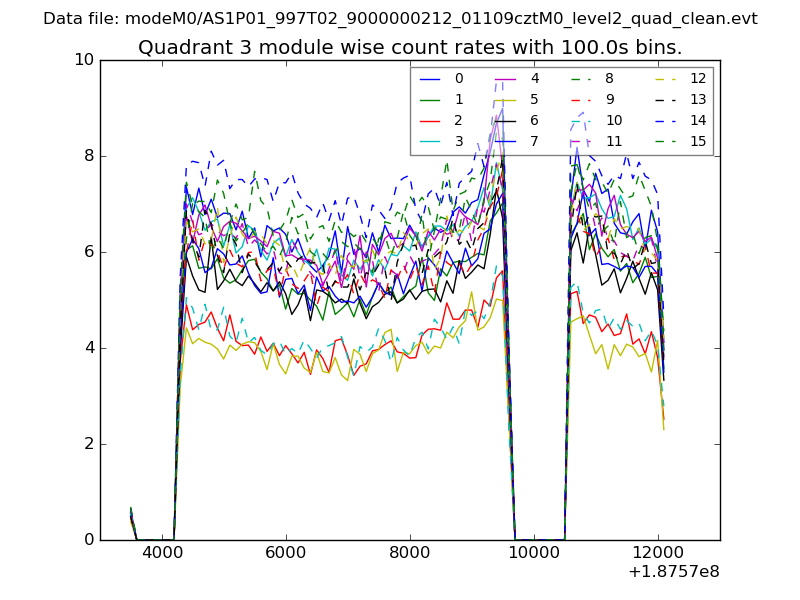
| Module-wise count rates for Quadrant C Data is divided into 100 sec bins |
 |
 |
| Module-wise count rates for Quadrant D Data is divided into 100 sec bins |
 |
 |
| Parameter | Plot |
|---|---|
| CZT HV Monitor | 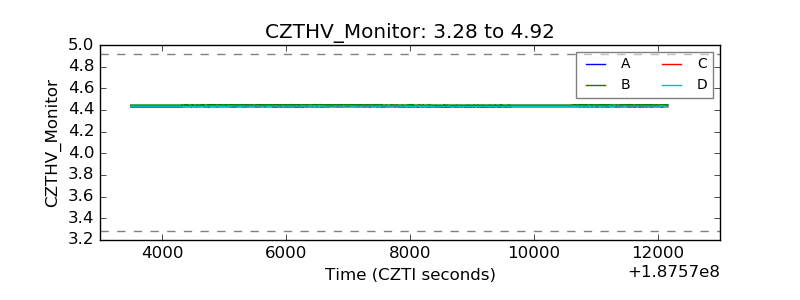 |
| D_VDD | 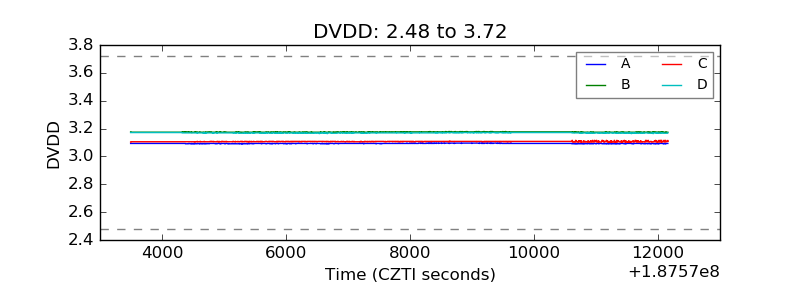 |
| Temperature 1 | 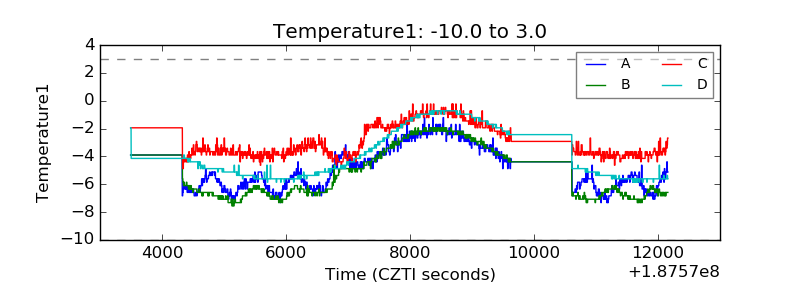 |
| Veto HV Monitor | 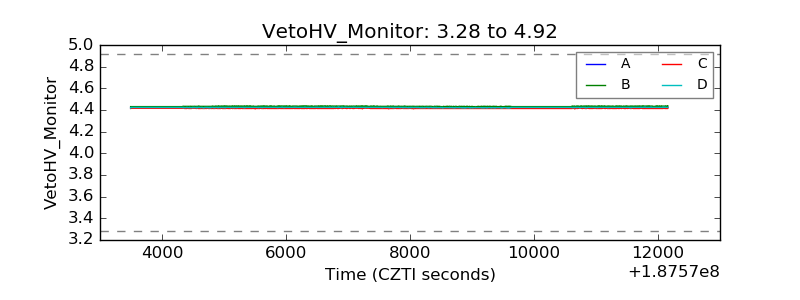 |
| Veto LLD | 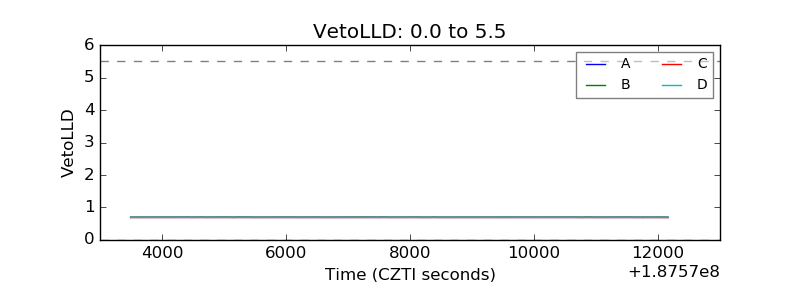 |
| Alpha Counter | 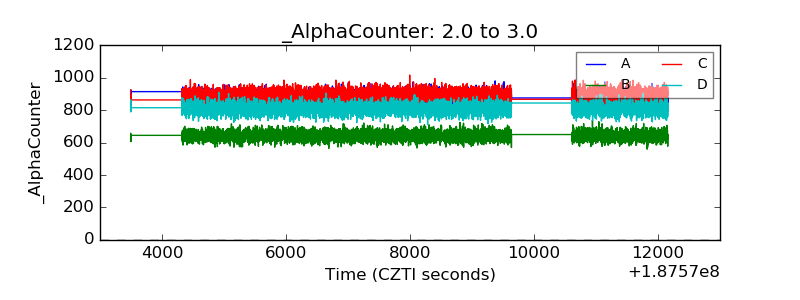 |
| _CPM_Rate | 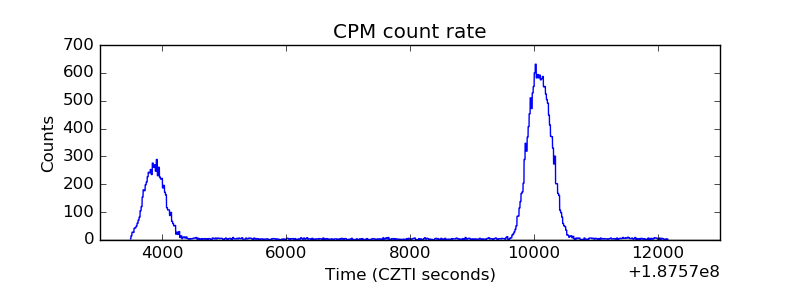 |
| CZT Counter | 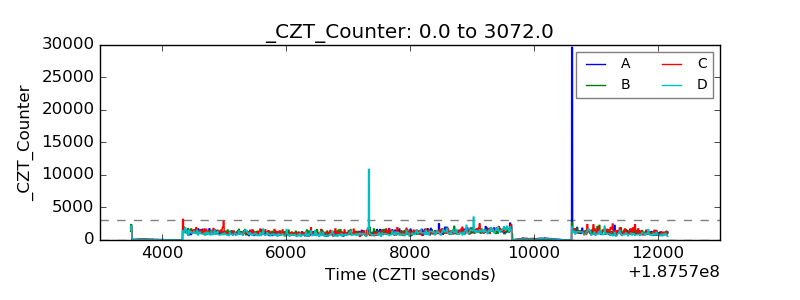 |
| +2.5 Volts monitor |  |
| +5 Volts monitor |  |
| _ROLL_ROT | 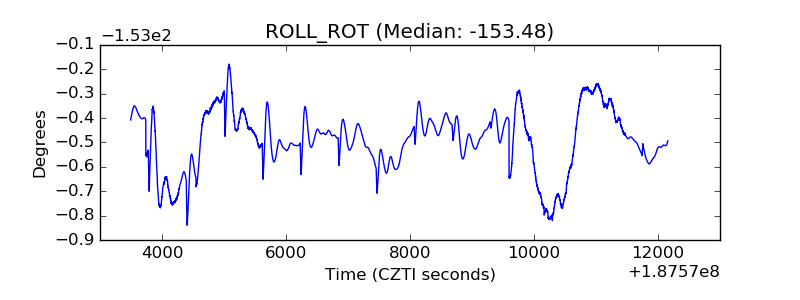 |
| _Roll_DEC | 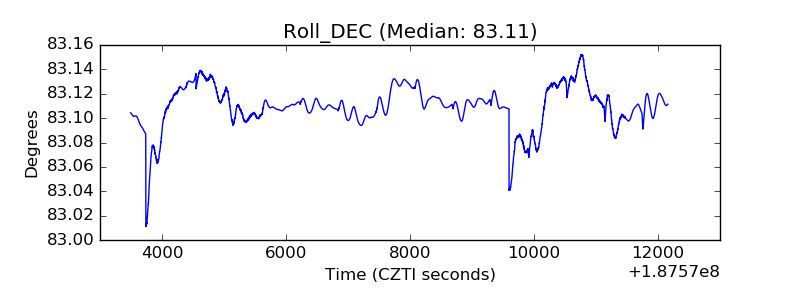 |
| _Roll_RA | 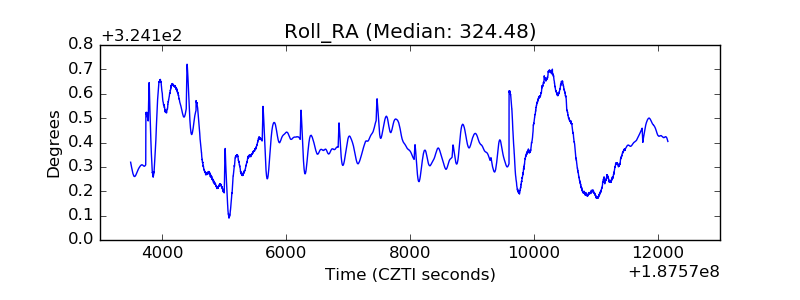 |
| Veto Counter | 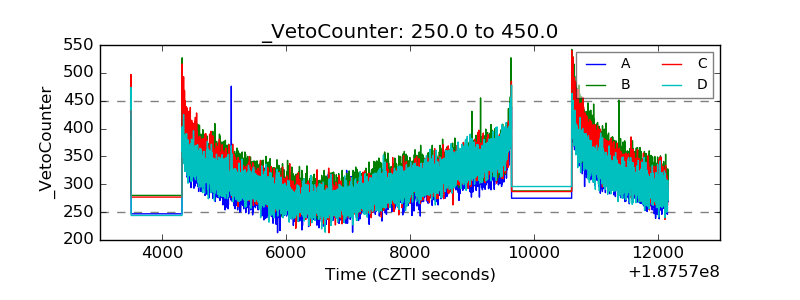 |