| Param | Original file | Final file |
|---|---|---|
| Filename | modeM0/AS1P01_997T02_9000000212_01111cztM0_level2.evt | modeM0/AS1P01_997T02_9000000212_01111cztM0_level2_quad_clean.evt |
| Size (bytes) | 1,156,345,920 | 113,184,000 |
| Size | 1.1 GB | 107.9 MB |
| Events in quadrant A | 8,743,153 | 734,167 |
| Events in quadrant B | 8,929,343 | 746,974 |
| Events in quadrant C | 8,581,970 | 716,314 |
| Events in quadrant D | 8,263,352 | 704,022 |
| Mode M9 | |||
|---|---|---|---|
| Quadrant | BADHDUFLAG | Total packets | Discarded packets |
| A | 0 | 10 | 0 |
| B | 0 | 10 | 0 |
| C | 0 | 10 | 0 |
| D | 0 | 10 | 0 |
| Mode M0 | |||
|---|---|---|---|
| Quadrant | BADHDUFLAG | Total packets | Discarded packets |
| A | 0 | 35085 | 3750 |
| B | 0 | 35681 | 3805 |
| C | 0 | 34504 | 3624 |
| D | 0 | 33316 | 3355 |
| Mode SS | |||
|---|---|---|---|
| Quadrant | BADHDUFLAG | Total packets | Discarded packets |
| A | 0 | 172 | 18 |
| B | 0 | 172 | 18 |
| C | 0 | 172 | 18 |
| D | 0 | 172 | 18 |
| Quadrant | Total seconds | Saturated seconds | Saturation percentage |
|---|---|---|---|
| A | 7565 | 35 | 0.462657% |
| B | 7565 | 19 | 0.251157% |
| C | 7565 | 10 | 0.132188% |
| D | 7565 | 45 | 0.594845% |
Noise dominated data is calculated using 1-second bins in cleaned event files. If a bin has >2000 counts, and if more than 50% of those come from <1% of pixels, then it is considered to be noise-dominated and hence unusable.
| Quadrant | # 1 sec bins | Bins with >0 counts | Bins with >2000 counts | High rate bins dominated by noise | Noise dominated (total time) | Noise dominated (detector-on time) | Marked lightcurve |
|---|---|---|---|---|---|---|---|
| A | 8605 | 7565 | 183 | 183 | 2.13% | 2.42% | 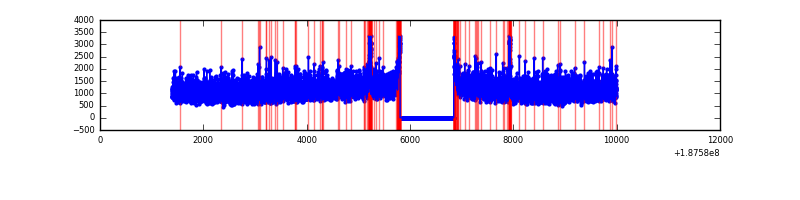 |
| B | 8605 | 7566 | 174 | 174 | 2.02% | 2.30% | 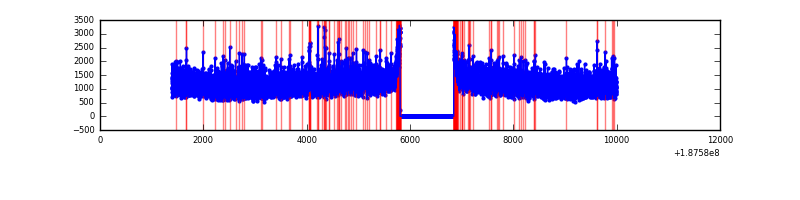 |
| C | 8605 | 7566 | 149 | 149 | 1.73% | 1.97% | 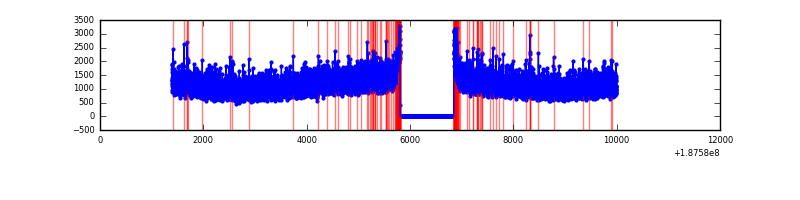 |
| D | 8605 | 7566 | 208 | 208 | 2.42% | 2.75% | 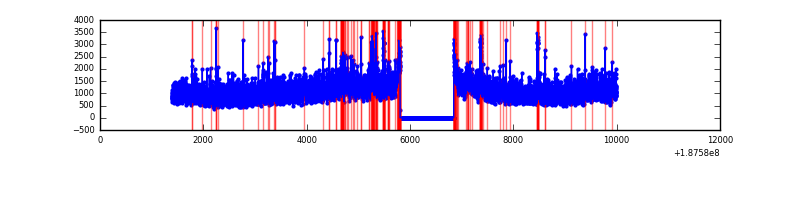 |
Top three noisy pixels from each quadrant. If the there are fewer than three noisy pixels in the level2.evt file, extra rows are filled as -1
| Pixel properties | Quadrant properties | ||||||
|---|---|---|---|---|---|---|---|
| Quadrant | DetID | PixID | Counts | Sigma | Mean | Median | Sigma |
| A | 4 | 32 | 97027 | 177.05 | 2231 | 2247 | 535.3 |
| A | 12 | 243 | 75514 | 136.86 | 2231 | 2247 | 535.3 |
| A | 0 | 253 | 20792 | 34.64 | 2231 | 2247 | 535.3 |
| B | 5 | 249 | 52141 | 91.19 | 2315 | 2325 | 546.3 |
| B | 4 | 187 | 20258 | 32.83 | 2315 | 2325 | 546.3 |
| B | 0 | 230 | 17798 | 28.32 | 2315 | 2325 | 546.3 |
| C | 15 | 241 | 376074 | 651.74 | 2058 | 2127 | 573.8 |
| C | 10 | 207 | 93626 | 159.47 | 2058 | 2127 | 573.8 |
| C | 3 | 111 | 29987 | 48.56 | 2058 | 2127 | 573.8 |
| D | 2 | 16 | 311325 | 523.98 | 2022 | 2073 | 590.2 |
| D | 2 | 216 | 176395 | 295.36 | 2022 | 2073 | 590.2 |
| D | 10 | 215 | 98791 | 163.87 | 2022 | 2073 | 590.2 |
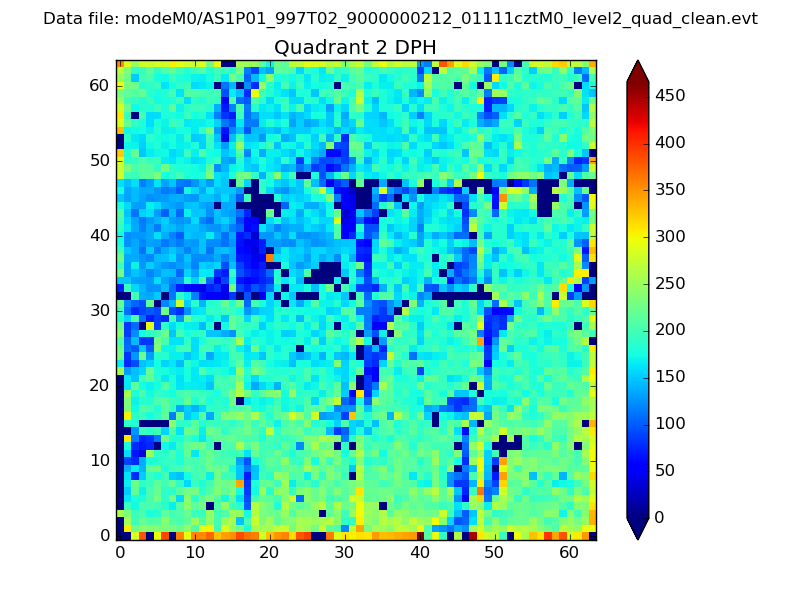
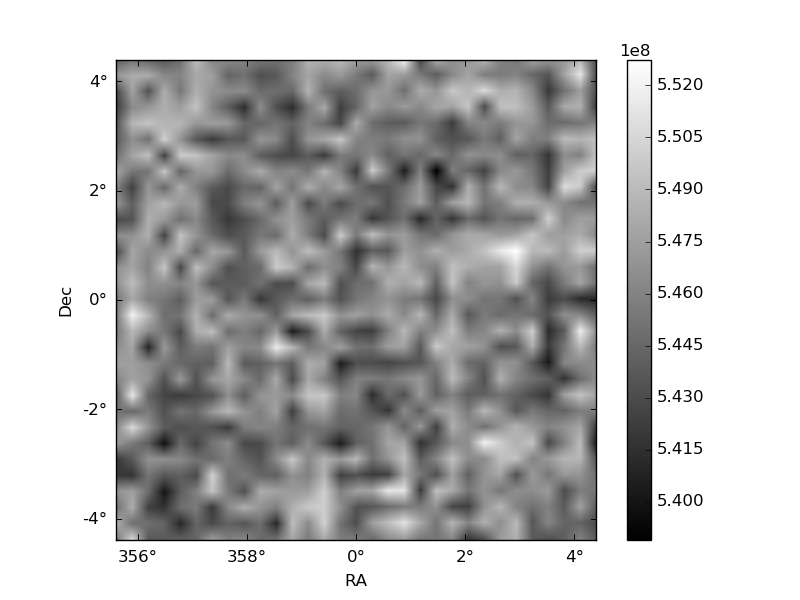
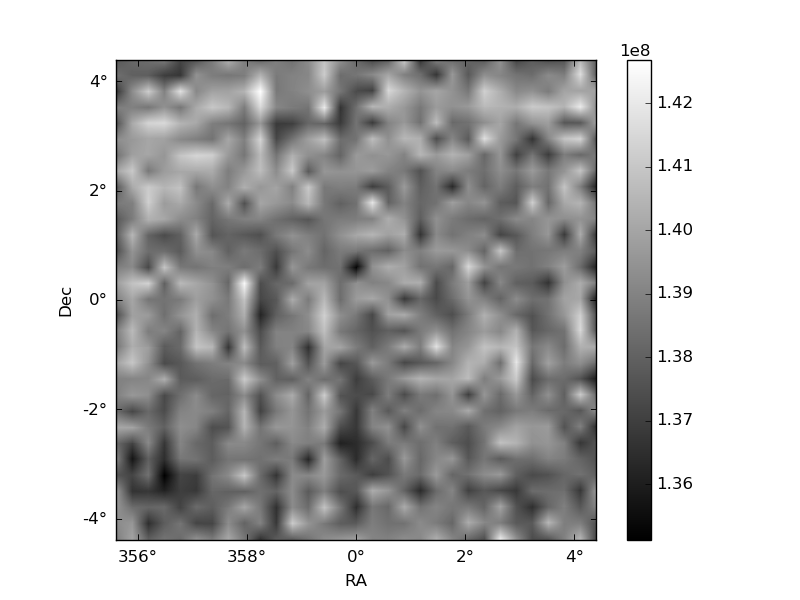
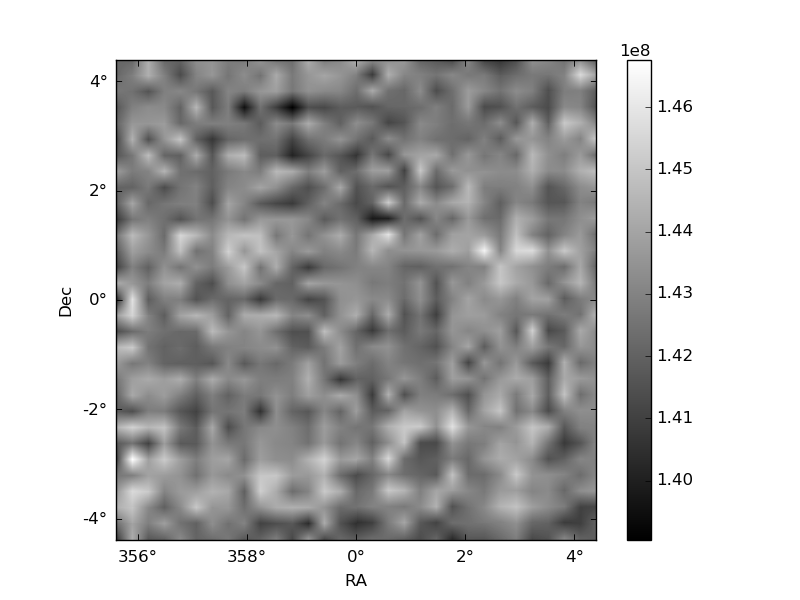
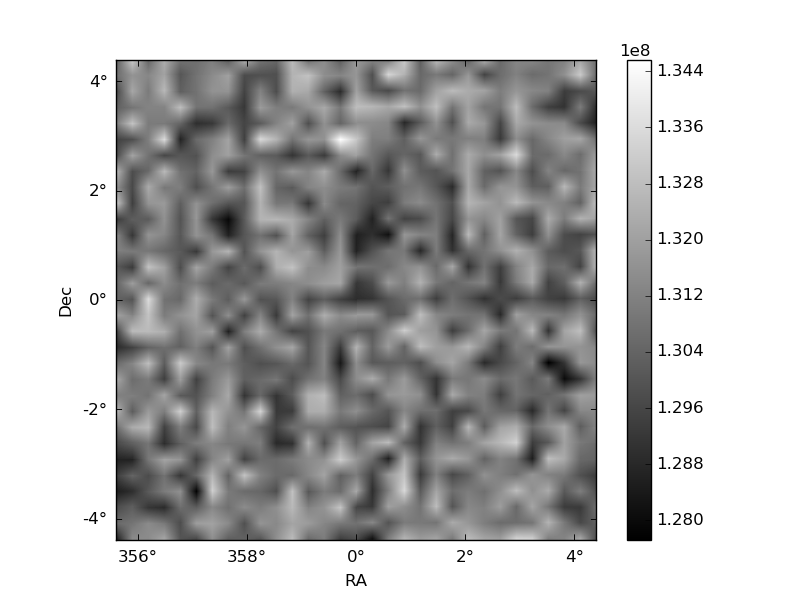
Histogram calculated using DETX and DETY for each event in the final _common_clean file
| Quadrant A | 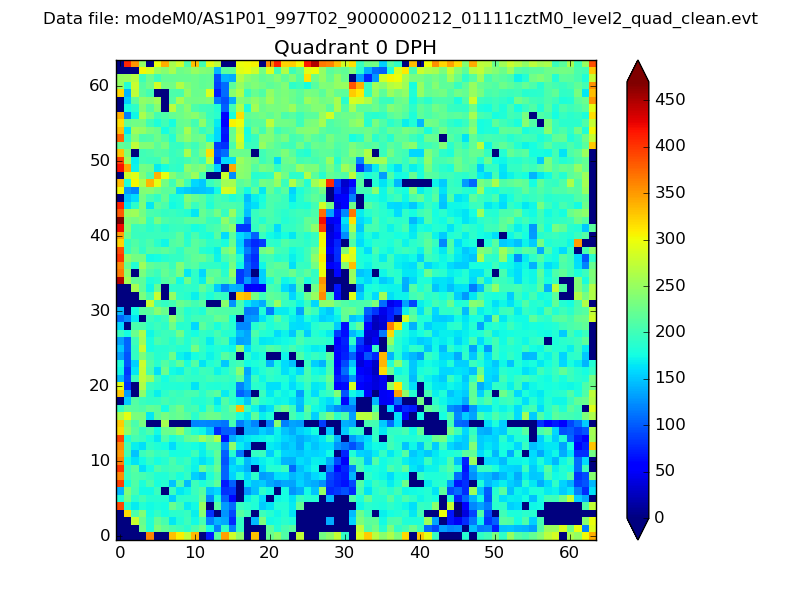 |
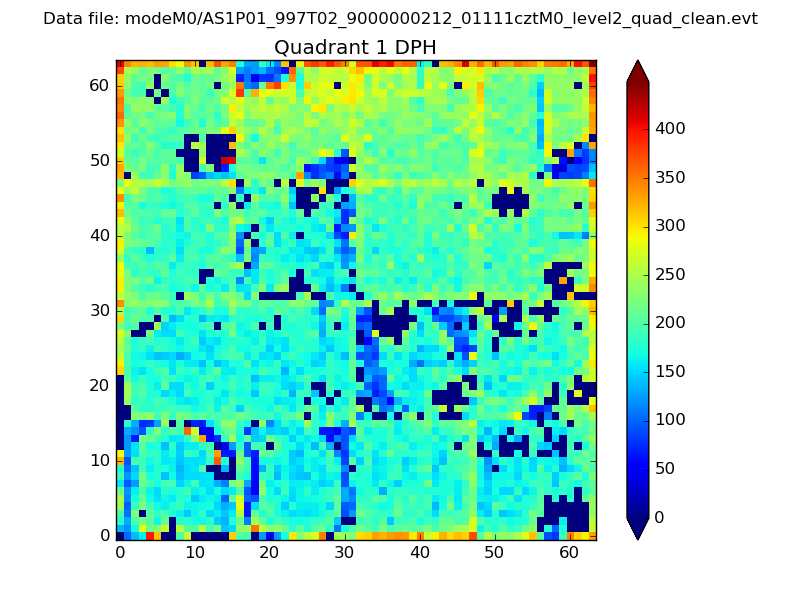 |
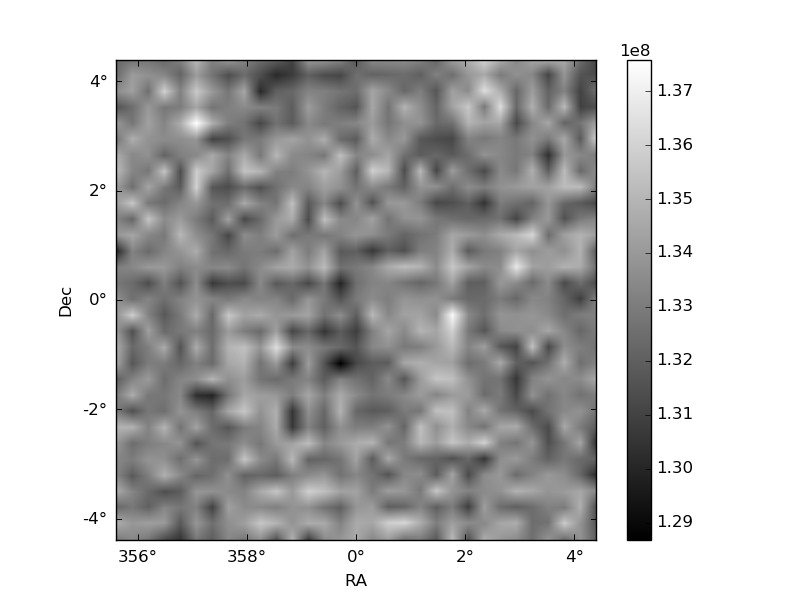
Quadrant B |
|---|---|---|---|
| Quadrant D | 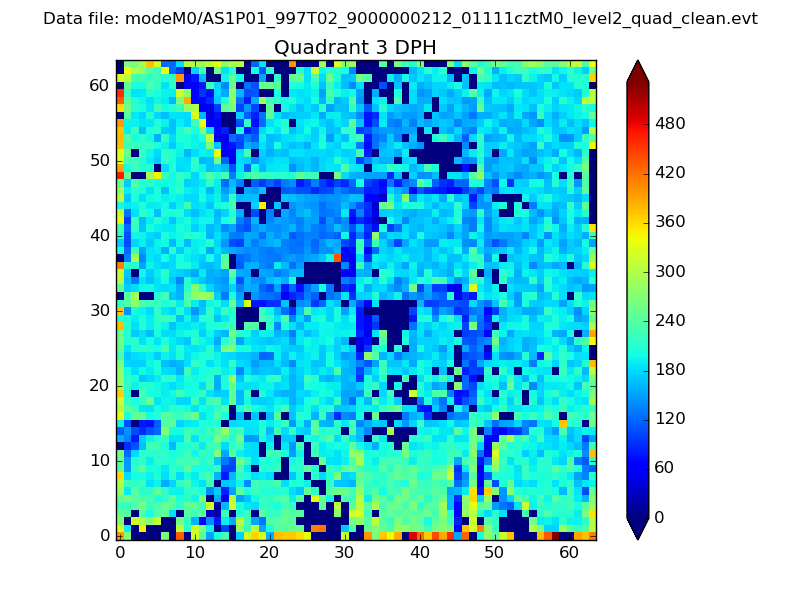 |
 |
Quadrant C |
| Plot type | Count rate plots | Images |
|---|---|---|
| Comparison with Poisson distribution Blue bars denote a histogram of data divided into 1 sec bins. Red curve is a Poisson curve with rate = median count rate of data. |
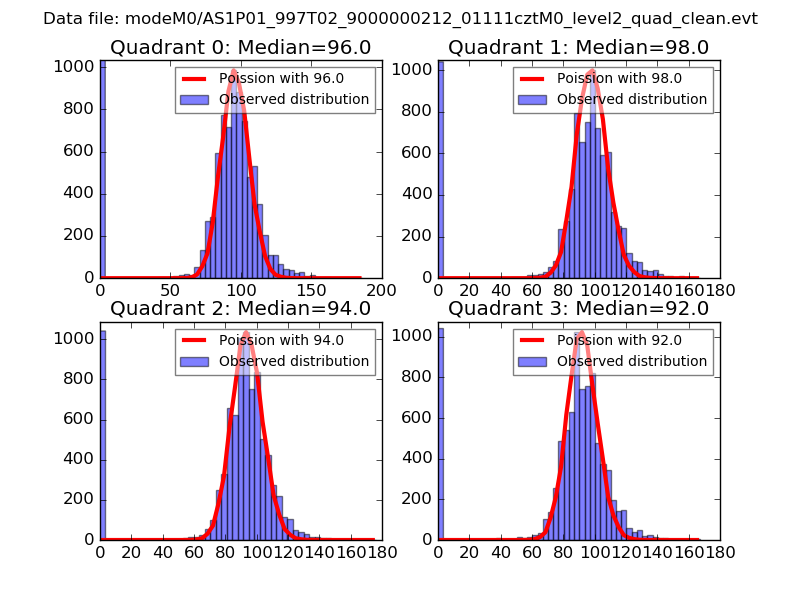 |
 |
| Quadrant-wise count rates Data is divided into 100 sec bins |
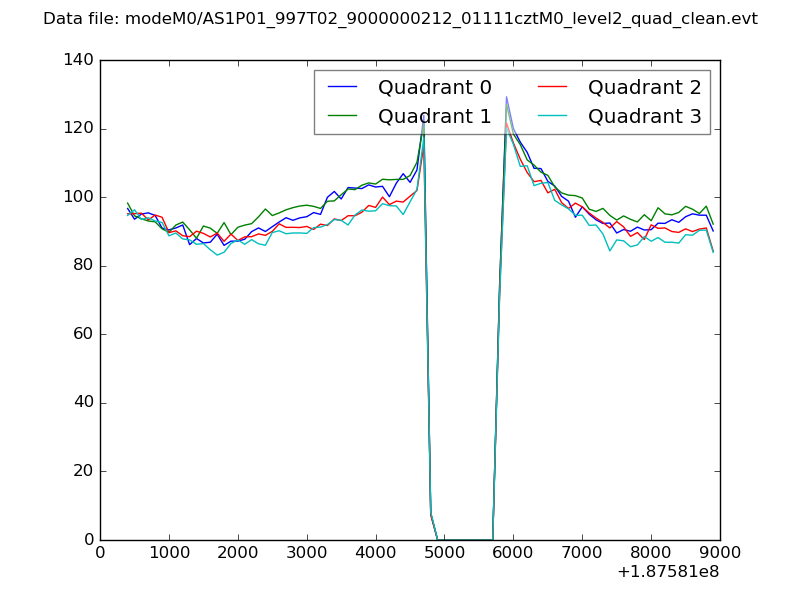 |
|
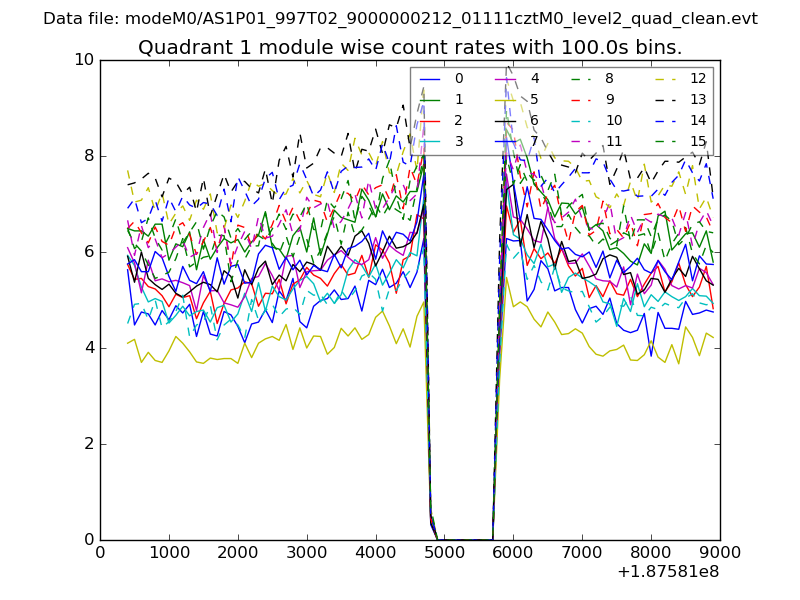
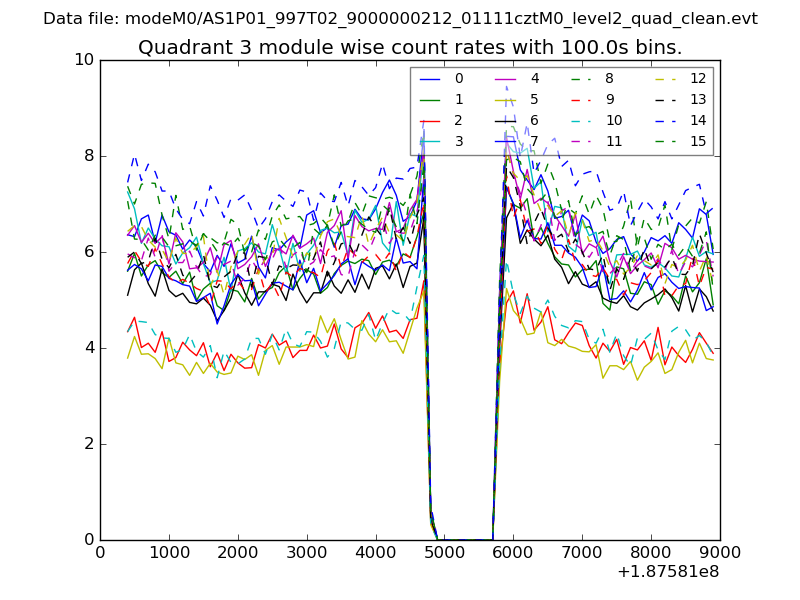
| Module-wise count rates for Quadrant A Data is divided into 100 sec bins |
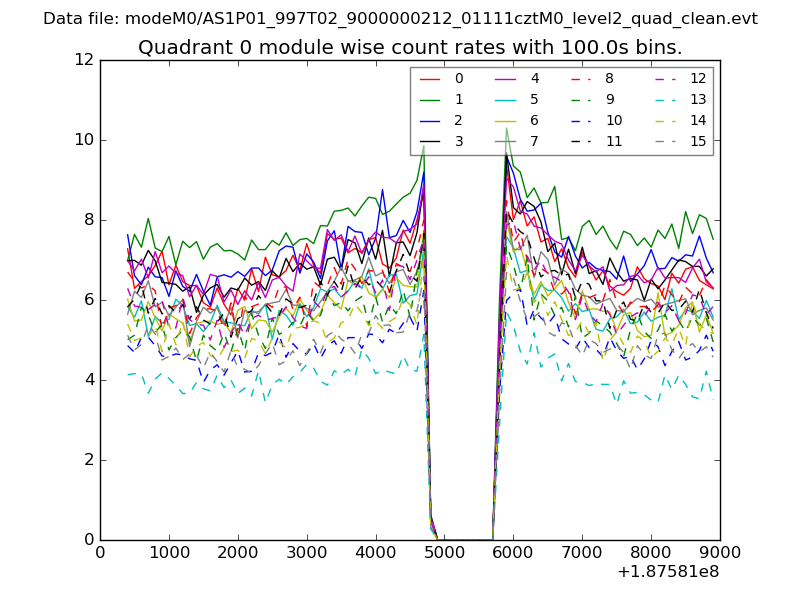 |
 |
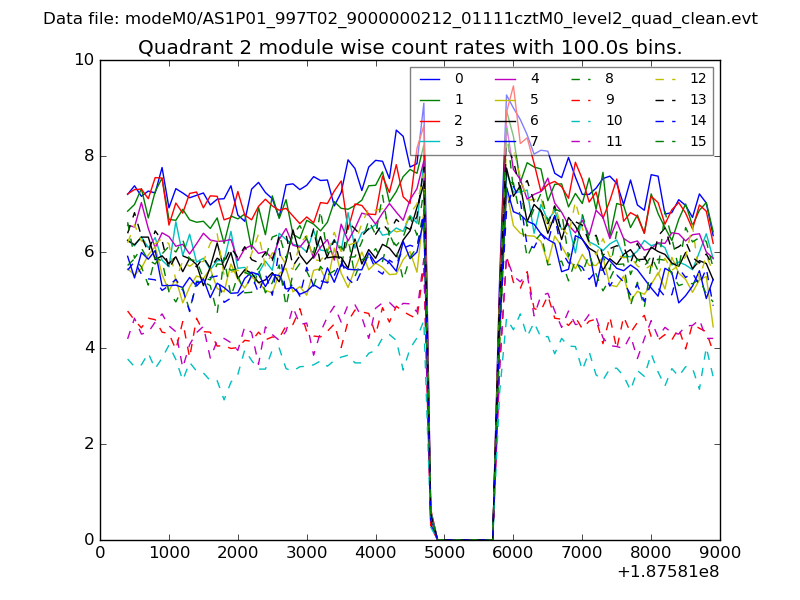
| Module-wise count rates for Quadrant B Data is divided into 100 sec bins |
 |
 |
| Module-wise count rates for Quadrant C Data is divided into 100 sec bins |
 |
 |
| Module-wise count rates for Quadrant D Data is divided into 100 sec bins |
 |
 |
| Parameter | Plot |
|---|---|
| CZT HV Monitor | 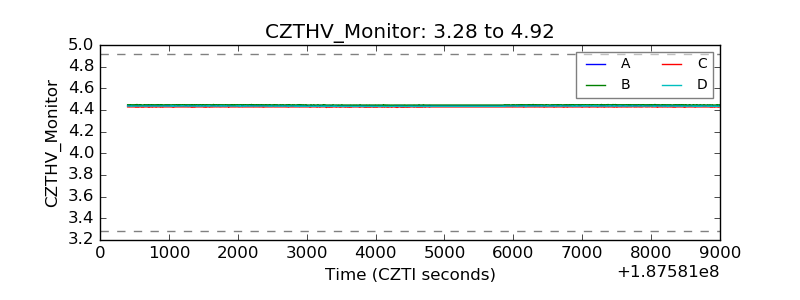 |
| D_VDD | 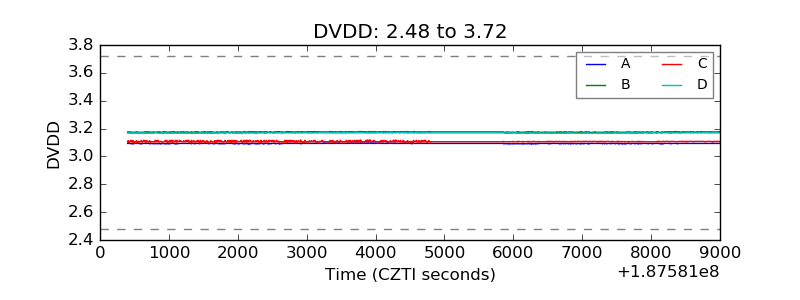 |
| Temperature 1 | 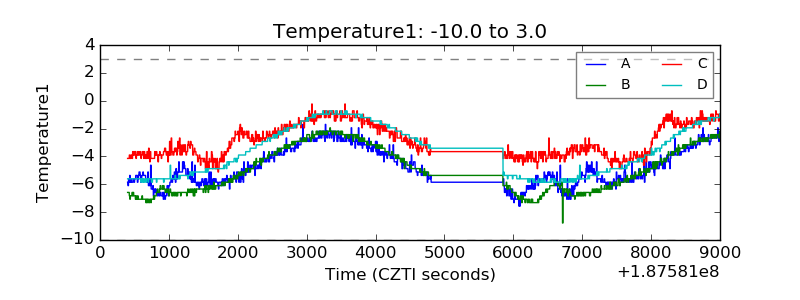 |
| Veto HV Monitor | 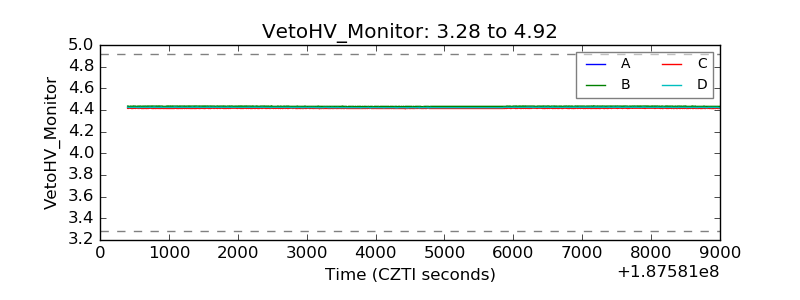 |
| Veto LLD | 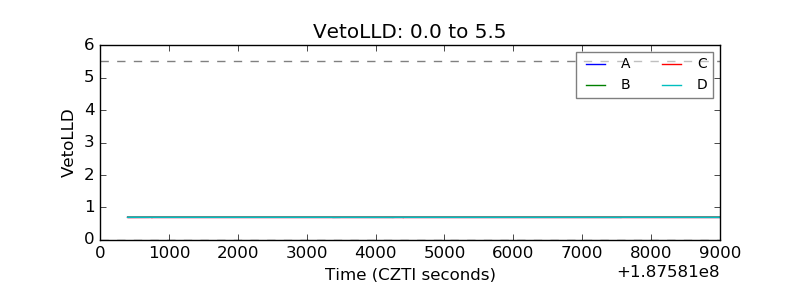 |
| Alpha Counter | 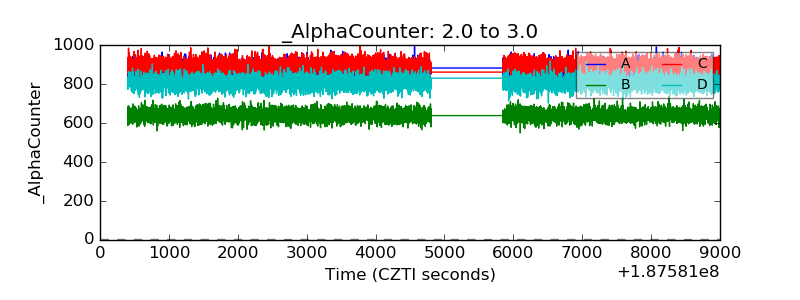 |
| _CPM_Rate | 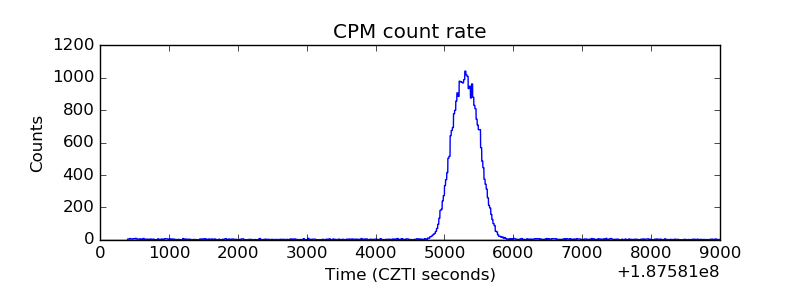 |
| CZT Counter |  |
| +2.5 Volts monitor |  |
| +5 Volts monitor |  |
| _ROLL_ROT | 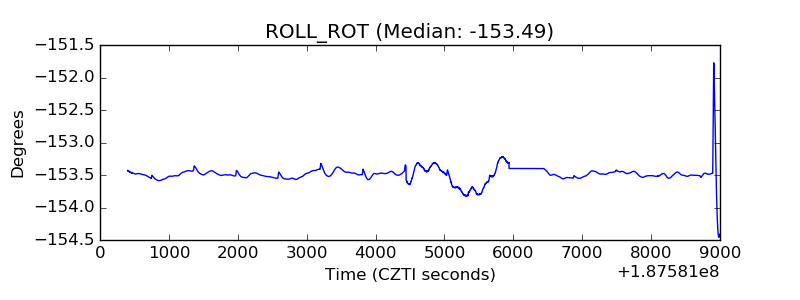 |
| _Roll_DEC | 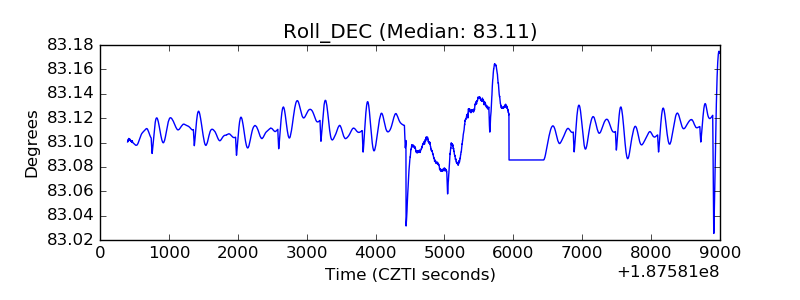 |
| _Roll_RA | 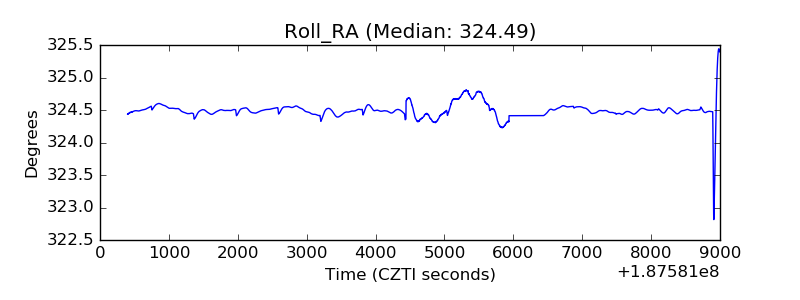 |
| Veto Counter | 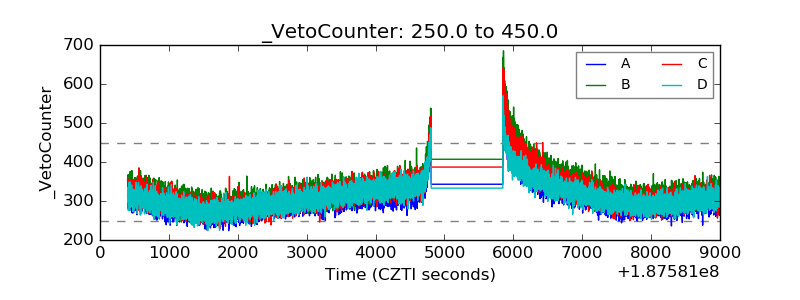 |