| Param | Original file | Final file |
|---|---|---|
| Filename | modeM0/AS1P01_999T99_9000000194_01080cztM0_level2.evt | modeM0/AS1P01_999T99_9000000194_01080cztM0_level2_quad_clean.evt |
| Size (bytes) | 82,814,400 | 8,861,760 |
| Size | 79.0 MB | 8.5 MB |
| Events in quadrant A | 631,856 | 54,926 |
| Events in quadrant B | 695,246 | 54,778 |
| Events in quadrant C | 621,040 | 54,827 |
| Events in quadrant D | 516,791 | 54,100 |
| Mode M0 | |||
|---|---|---|---|
| Quadrant | BADHDUFLAG | Total packets | Discarded packets |
| A | 0 | 2310 | 1 |
| B | 0 | 2463 | 0 |
| C | 0 | 2263 | 0 |
| D | 0 | 1967 | 0 |
| Mode SS | |||
|---|---|---|---|
| Quadrant | BADHDUFLAG | Total packets | Discarded packets |
| A | 0 | 12 | 0 |
| B | 0 | 12 | 0 |
| C | 0 | 12 | 0 |
| D | 0 | 12 | 0 |
| Quadrant | Total seconds | Saturated seconds | Saturation percentage |
|---|---|---|---|
| A | 591 | 0 | 0.000000% |
| B | 591 | 4 | 0.676819% |
| C | 591 | 0 | 0.000000% |
| D | 591 | 0 | 0.000000% |
Noise dominated data is calculated using 1-second bins in cleaned event files. If a bin has >2000 counts, and if more than 50% of those come from <1% of pixels, then it is considered to be noise-dominated and hence unusable.
| Quadrant | # 1 sec bins | Bins with >0 counts | Bins with >2000 counts | High rate bins dominated by noise | Noise dominated (total time) | Noise dominated (detector-on time) | Marked lightcurve |
|---|---|---|---|---|---|---|---|
| A | 591 | 591 | 4 | 4 | 0.68% | 0.68% | 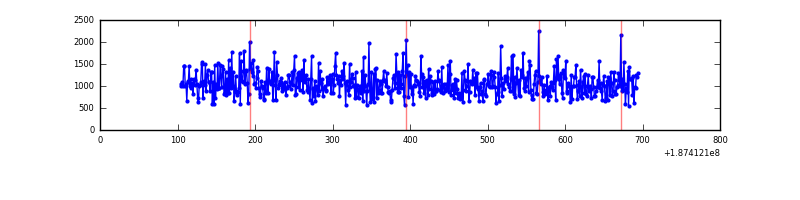 |
| B | 591 | 591 | 15 | 15 | 2.54% | 2.54% | 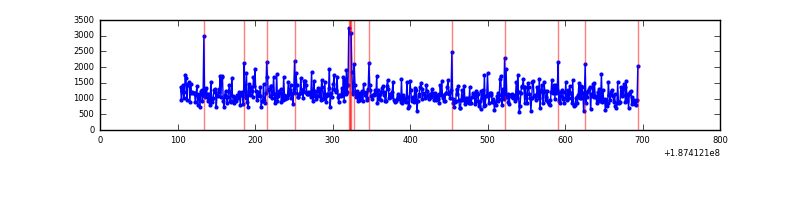 |
| C | 591 | 591 | 4 | 4 | 0.68% | 0.68% | 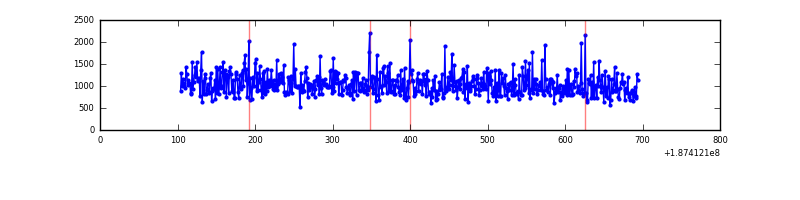 |
| D | 591 | 591 | 0 | 0 | 0.00% | 0.00% | 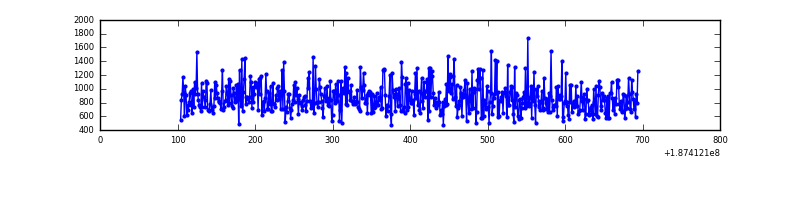 |
Top three noisy pixels from each quadrant. If the there are fewer than three noisy pixels in the level2.evt file, extra rows are filled as -1
| Pixel properties | Quadrant properties | ||||||
|---|---|---|---|---|---|---|---|
| Quadrant | DetID | PixID | Counts | Sigma | Mean | Median | Sigma |
| A | 3 | 111 | 557 | 9.42 | 164 | 166 | 41.5 |
| A | 14 | 203 | 428 | 6.31 | 164 | 166 | 41.5 |
| A | 13 | 235 | 419 | 6.09 | 164 | 166 | 41.5 |
| B | 5 | 184 | 14616 | 325.79 | 175 | 176 | 44.3 |
| B | 5 | 191 | 12505 | 278.16 | 175 | 176 | 44.3 |
| B | 4 | 232 | 2312 | 48.19 | 175 | 176 | 44.3 |
| C | 15 | 241 | 28079 | 636.18 | 150 | 155 | 43.9 |
| C | 3 | 111 | 1866 | 38.98 | 150 | 155 | 43.9 |
| C | 3 | 79 | 1295 | 25.97 | 150 | 155 | 43.9 |
| D | 13 | 13 | 998 | 19.1 | 137 | 140 | 44.9 |
| D | 15 | 13 | 453 | 6.97 | 137 | 140 | 44.9 |
| D | 13 | 169 | 417 | 6.17 | 137 | 140 | 44.9 |
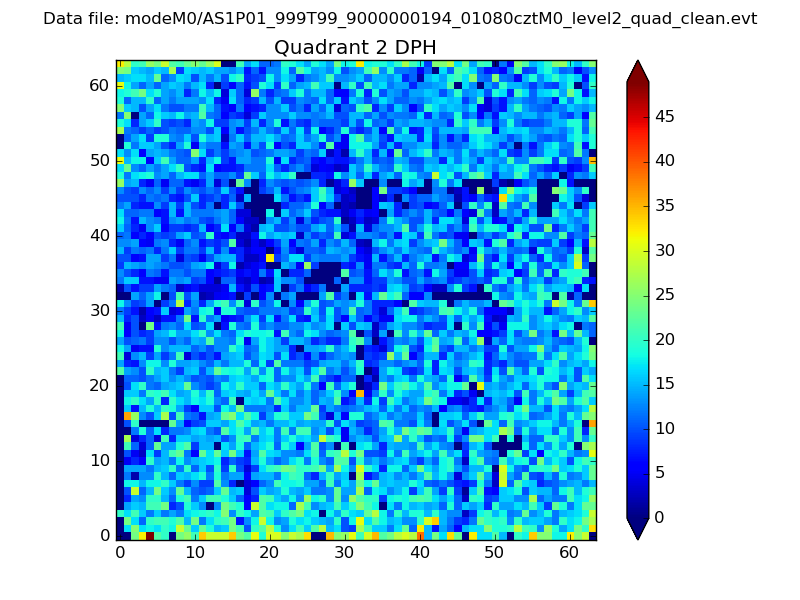
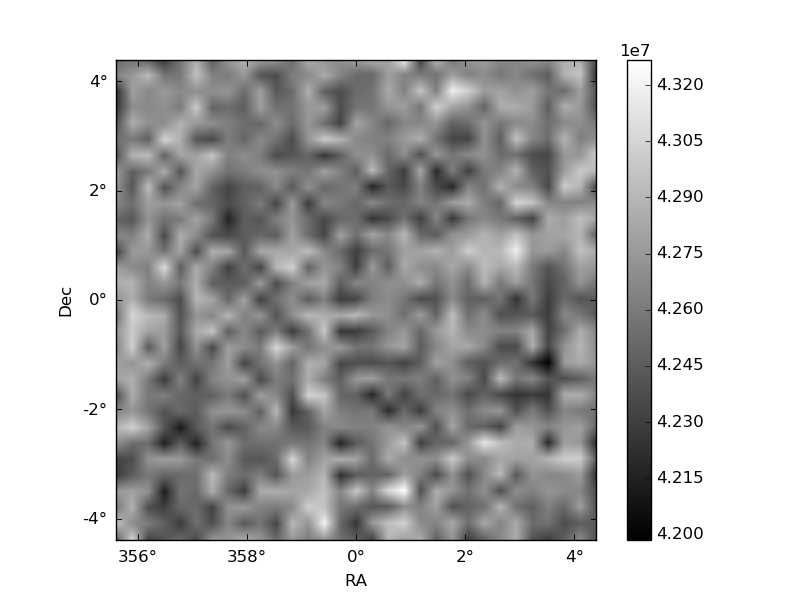
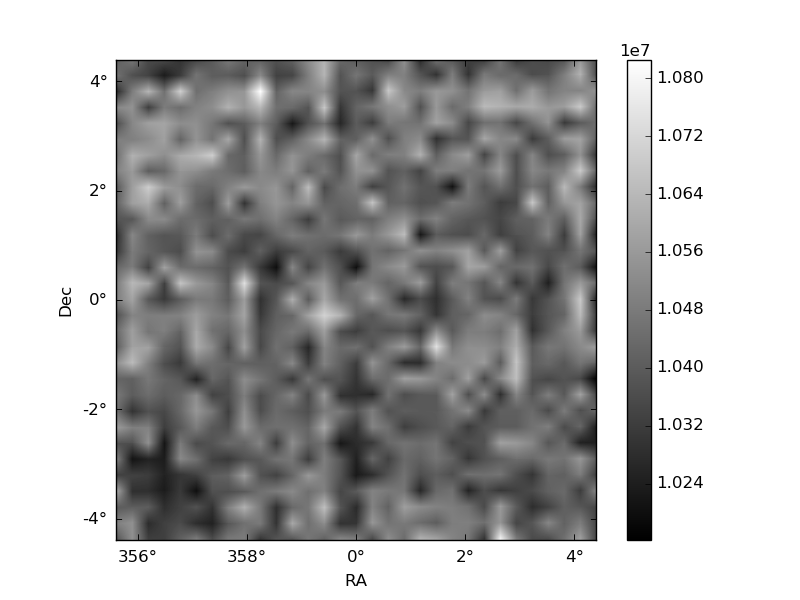
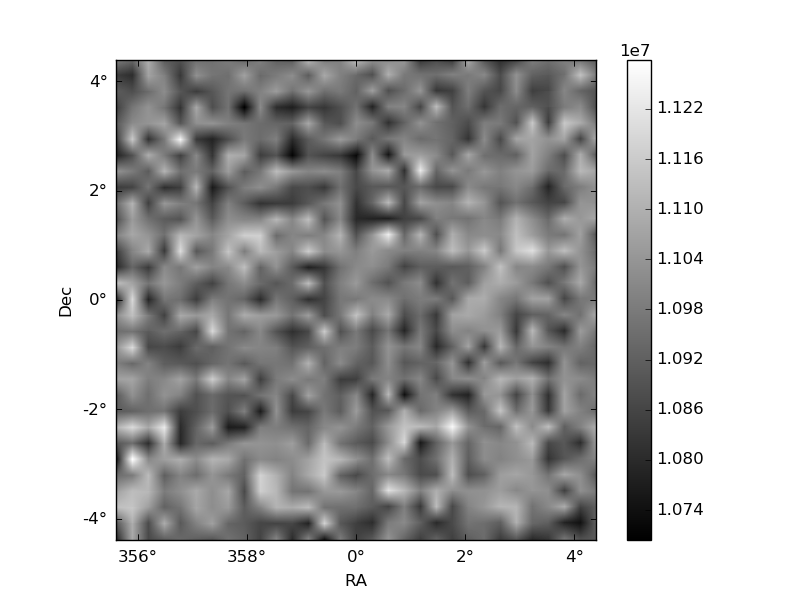
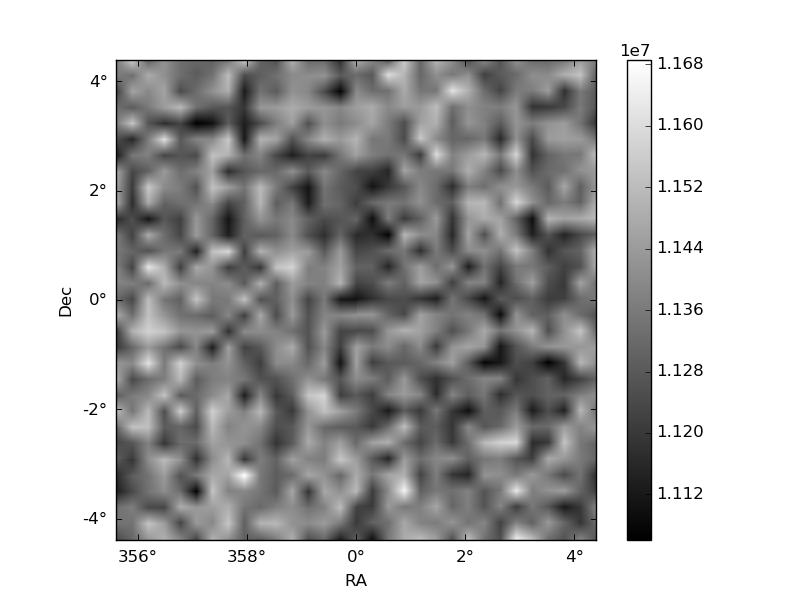
Histogram calculated using DETX and DETY for each event in the final _common_clean file
| Quadrant A | 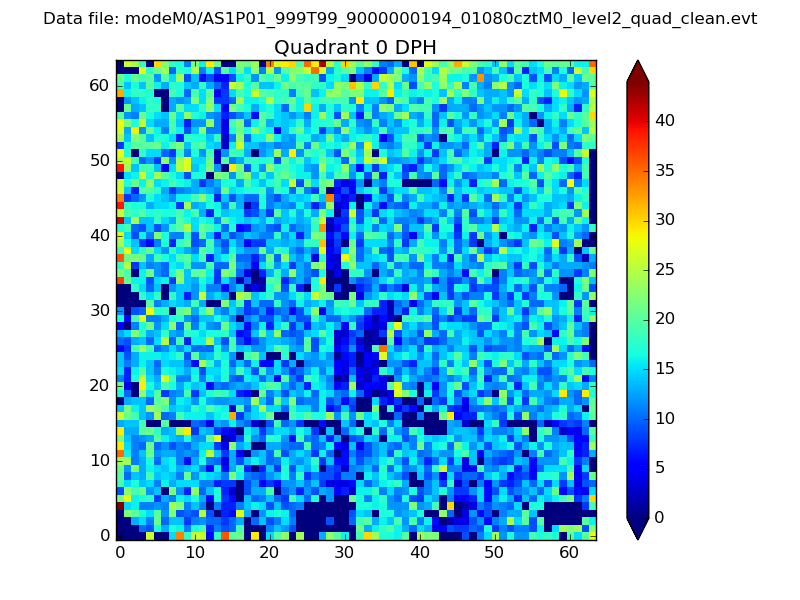 |
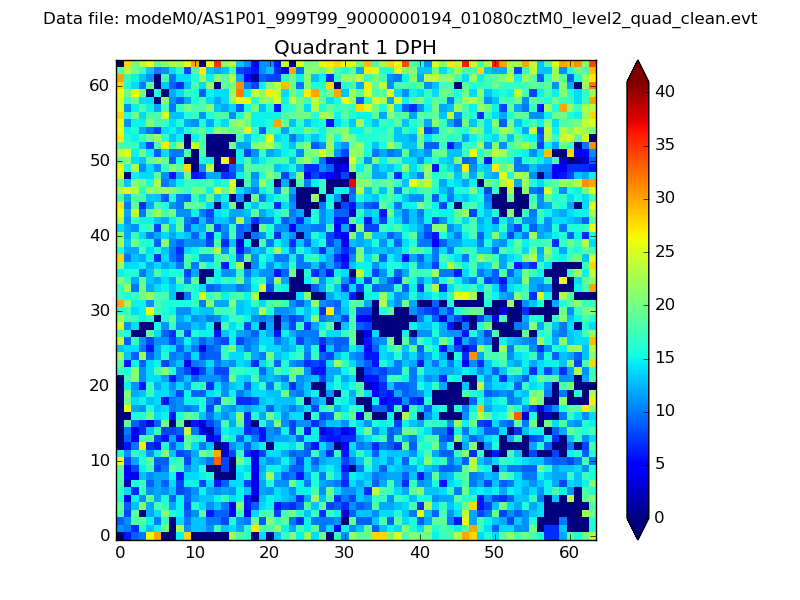 |
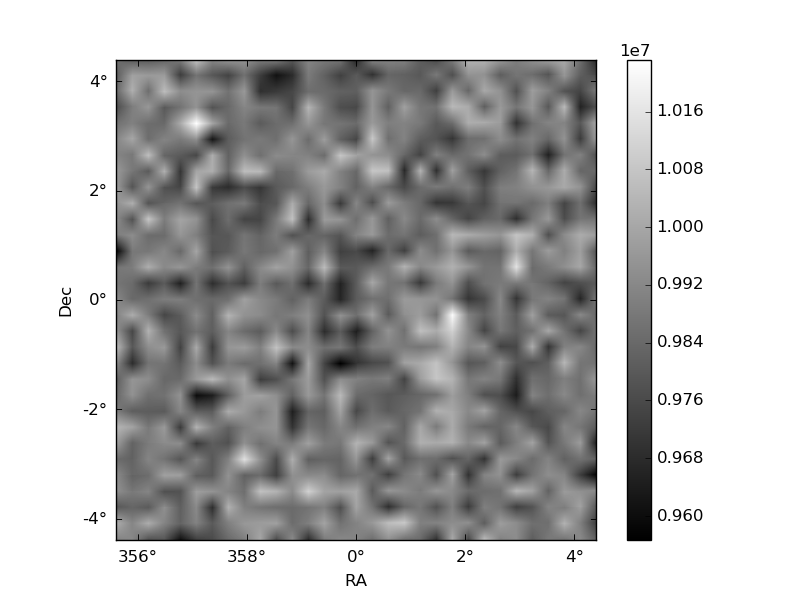
Quadrant B |
|---|---|---|---|
| Quadrant D | 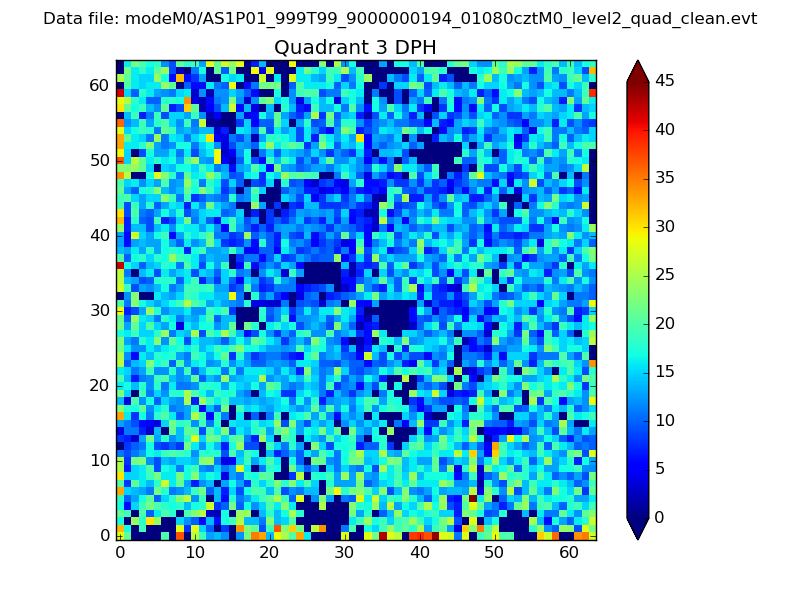 |
 |
Quadrant C |
| Plot type | Count rate plots | Images |
|---|---|---|
| Comparison with Poisson distribution Blue bars denote a histogram of data divided into 1 sec bins. Red curve is a Poisson curve with rate = median count rate of data. |
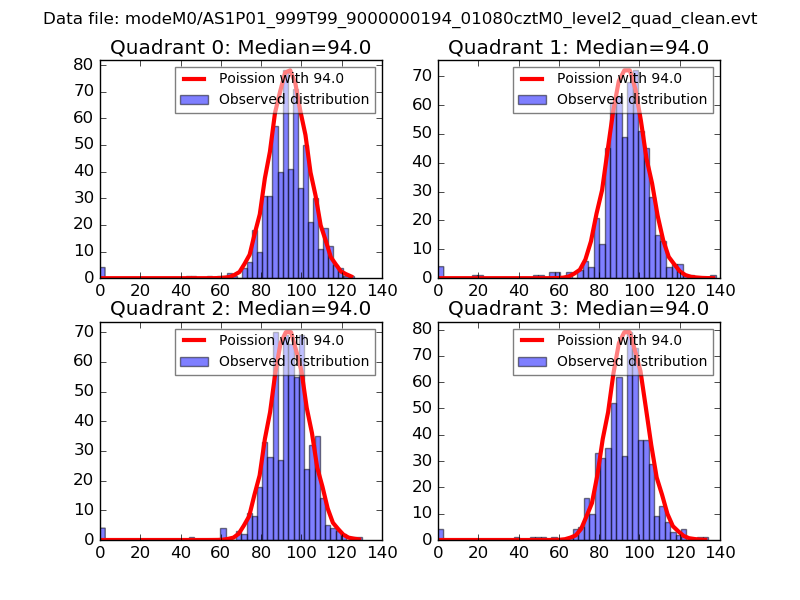 |
 |
| Quadrant-wise count rates Data is divided into 100 sec bins |
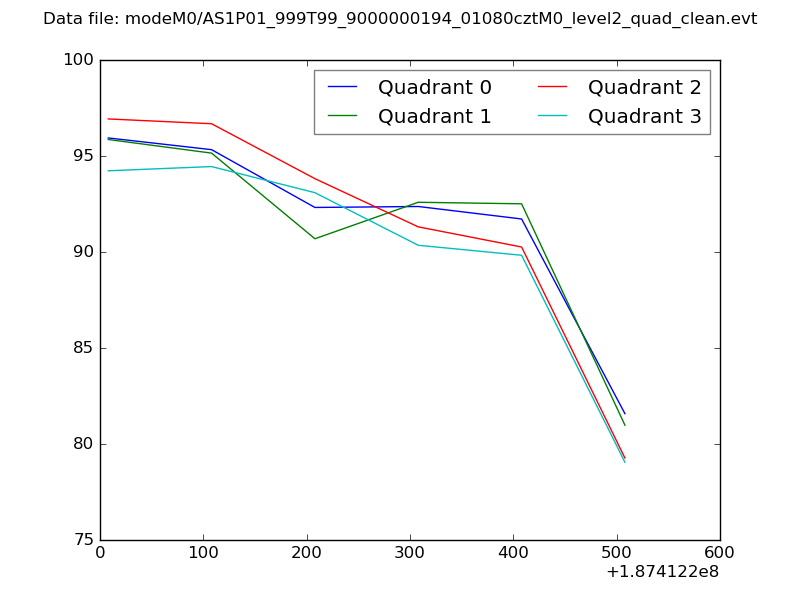 |
|
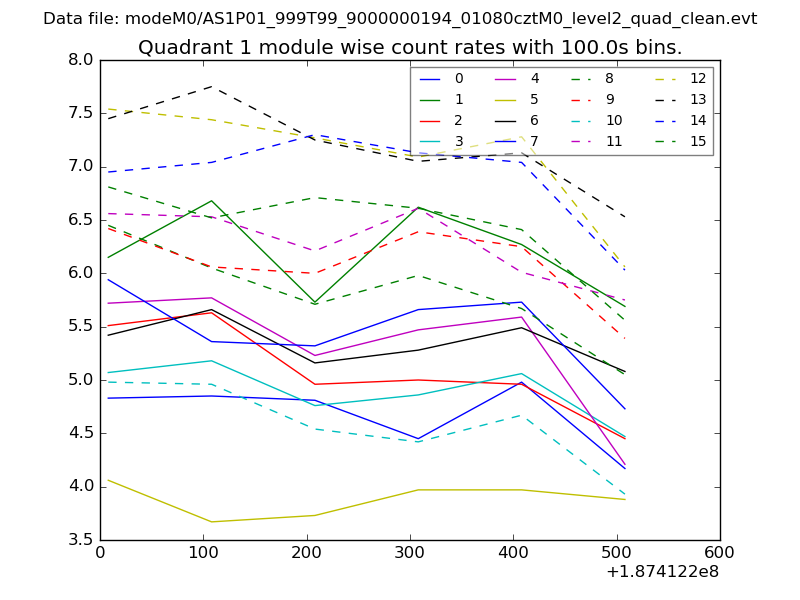
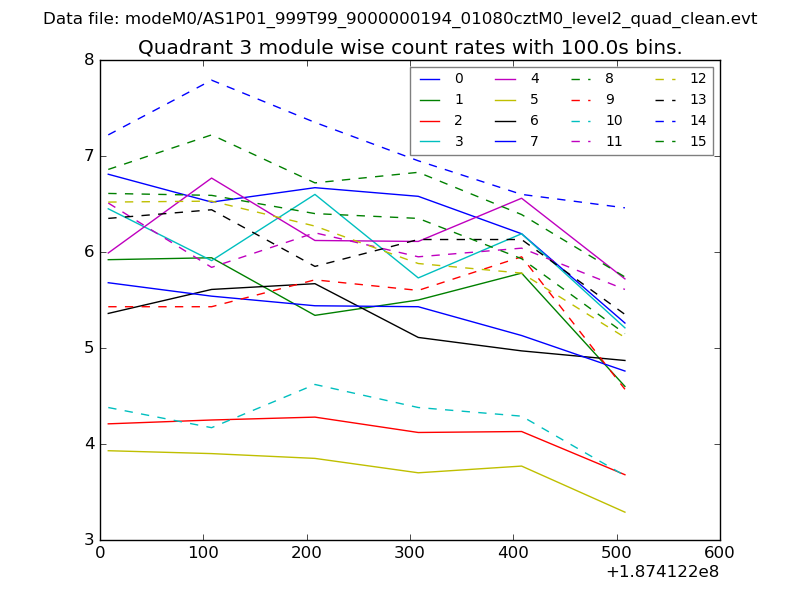
| Module-wise count rates for Quadrant A Data is divided into 100 sec bins |
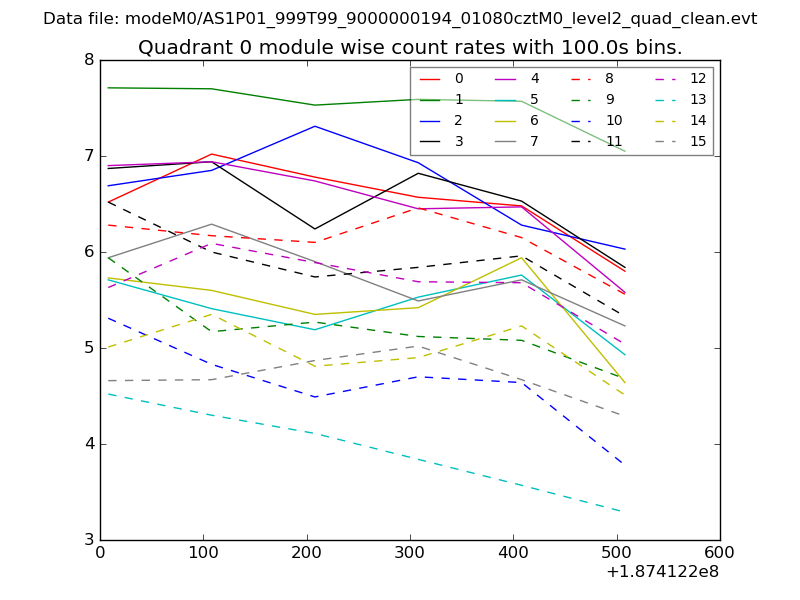 |
 |
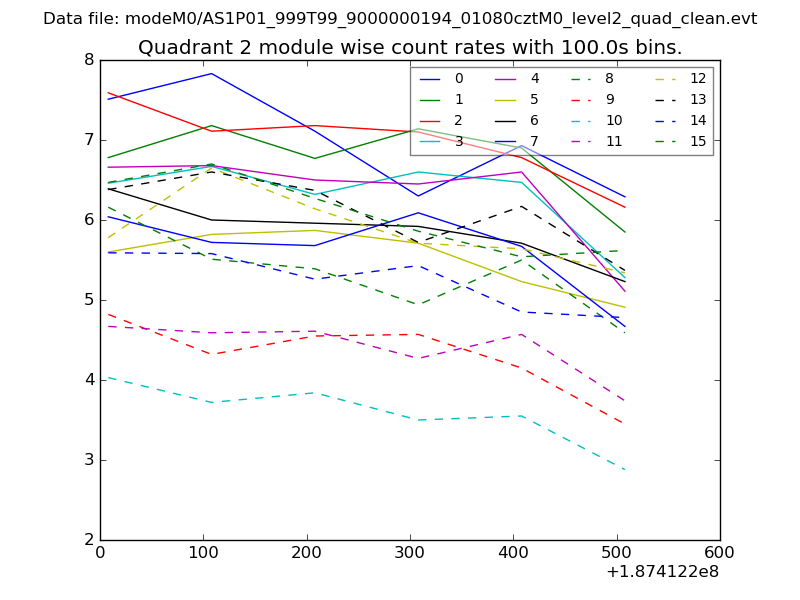
| Module-wise count rates for Quadrant B Data is divided into 100 sec bins |
 |
 |
| Module-wise count rates for Quadrant C Data is divided into 100 sec bins |
 |
 |
| Module-wise count rates for Quadrant D Data is divided into 100 sec bins |
 |
 |
| Parameter | Plot |
|---|---|
| CZT HV Monitor | 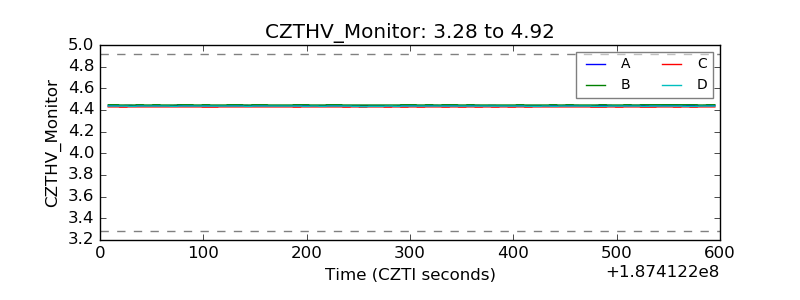 |
| D_VDD | 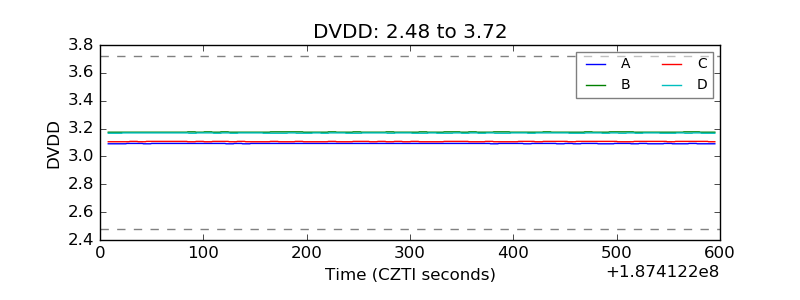 |
| Temperature 1 | 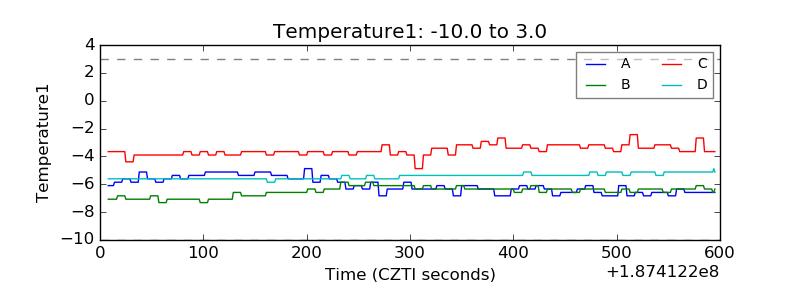 |
| Veto HV Monitor | 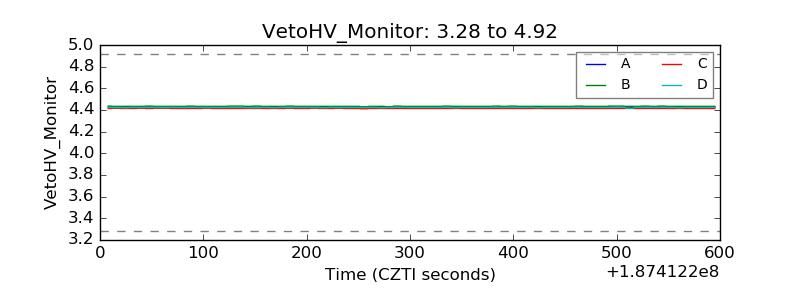 |
| Veto LLD | 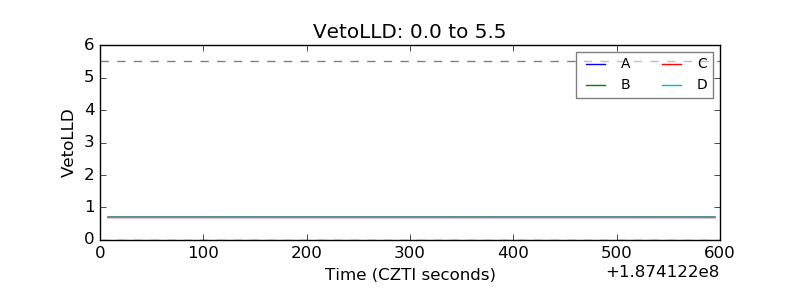 |
| Alpha Counter | 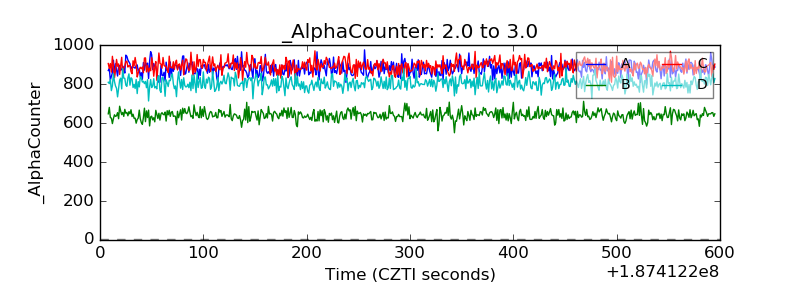 |
| _CPM_Rate | 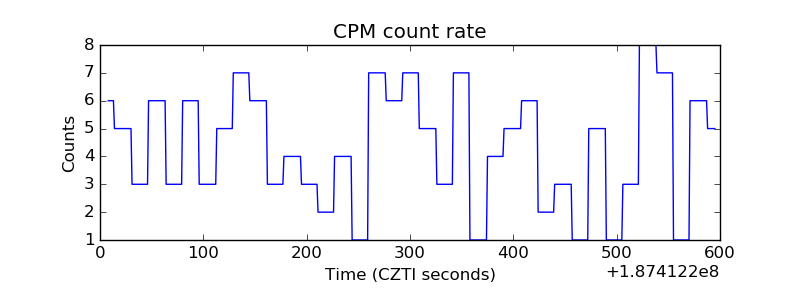 |
| CZT Counter | 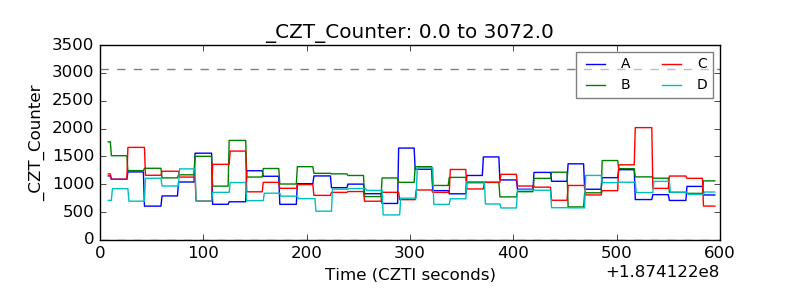 |
| +2.5 Volts monitor |  |
| +5 Volts monitor |  |
| _ROLL_ROT | 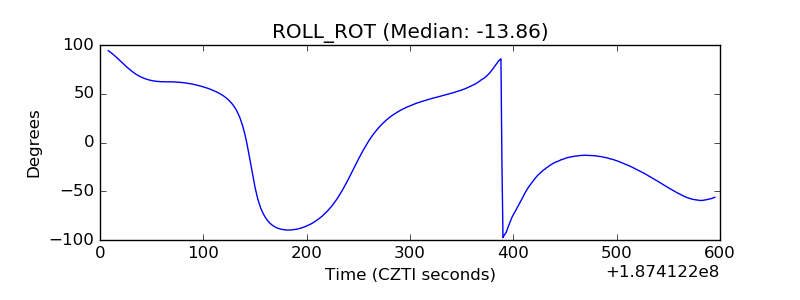 |
| _Roll_DEC | 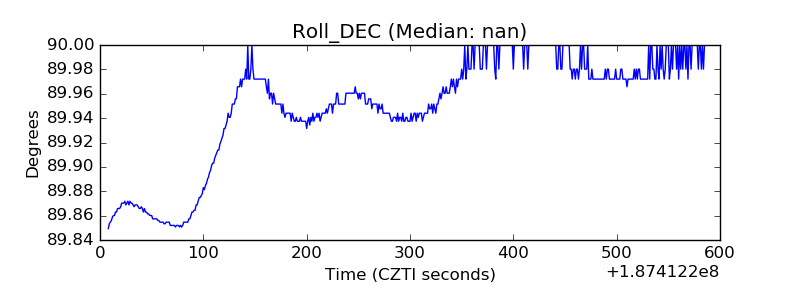 |
| _Roll_RA | 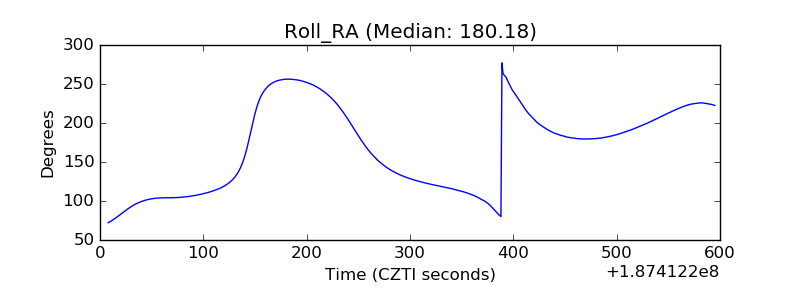 |
| Veto Counter | 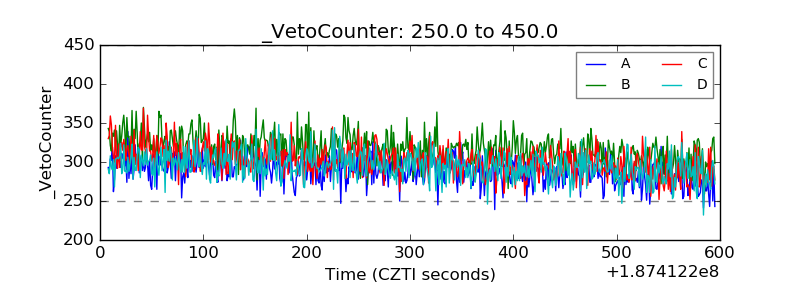 |