| Param | Original file | Final file |
|---|---|---|
| Filename | modeM0/AS1P01_999T99_9000000194_01082cztM0_level2.fits | modeM0/AS1P01_999T99_9000000194_01082cztM0_level2_quad_clean.evt |
| Size (bytes) | 123,900,480 | 12,107,520 |
| Size | 118.2 MB | 11.5 MB |
| Events in quadrant A | 1,162,879 | 79,014 |
| Events in quadrant B | 1,247,839 | 80,896 |
| Events in quadrant C | 1,120,209 | 79,246 |
| Events in quadrant D | 965,972 | 76,942 |
| Mode M0 | |||
|---|---|---|---|
| Quadrant | BADHDUFLAG | Total packets | Discarded packets |
| A | 0 | 4277 | 0 |
| B | 0 | 4483 | 0 |
| C | 0 | 4125 | 0 |
| D | 0 | 3696 | 0 |
| Mode SS | |||
|---|---|---|---|
| Quadrant | BADHDUFLAG | Total packets | Discarded packets |
| A | 0 | 22 | 0 |
| B | 0 | 22 | 0 |
| C | 0 | 22 | 0 |
| D | 0 | 22 | 0 |
| Quadrant | Total seconds | Saturated seconds | Saturation percentage |
|---|---|---|---|
| A | 1125 | 0 | 0.000000% |
| B | 1125 | 4 | 0.355556% |
| C | 1125 | 0 | 0.000000% |
| D | 1125 | 0 | 0.000000% |
Noise dominated data is calculated using 1-second bins in cleaned event files. If a bin has >2000 counts, and if more than 50% of those come from <1% of pixels, then it is considered to be noise-dominated and hence unusable.
| Quadrant | # 1 sec bins | Bins with >0 counts | Bins with >2000 counts | High rate bins dominated by noise | Noise dominated (total time) | Noise dominated (detector-on time) | Marked lightcurve |
|---|---|---|---|---|---|---|---|
| A | 1125 | 1125 | 5 | 5 | 0.44% | 0.44% | 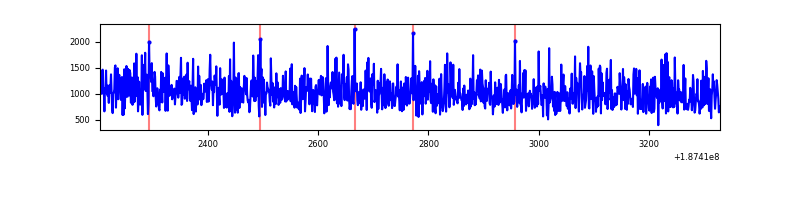 |
| B | 1125 | 1125 | 19 | 19 | 1.69% | 1.69% | 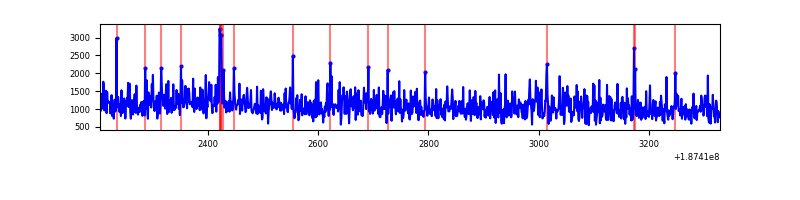 |
| C | 1125 | 1125 | 4 | 4 | 0.36% | 0.36% | 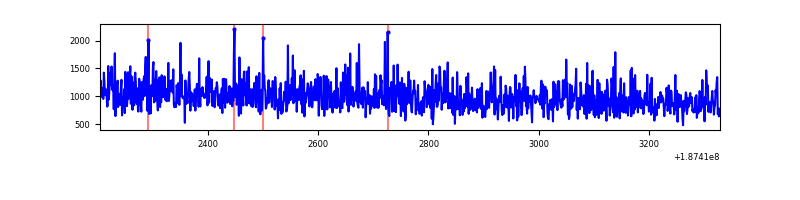 |
| D | 1125 | 1125 | 0 | 0 | 0.00% | 0.00% | 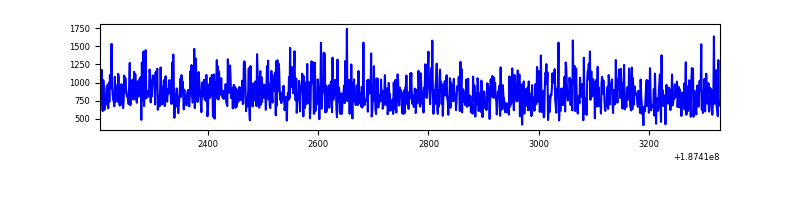 |
Top three noisy pixels from each quadrant. If the there are fewer than three noisy pixels in the level2.evt file, extra rows are filled as -1
| Pixel properties | Quadrant properties | ||||||
|---|---|---|---|---|---|---|---|
| Quadrant | DetID | PixID | Counts | Sigma | Mean | Median | Sigma |
| A | 3 | 111 | 1017 | 9.46 | 303 | 306 | 75.1 |
| A | 14 | 203 | 778 | 6.28 | 303 | 306 | 75.1 |
| A | -1 | -1 | -1 | -1.0 | 303 | 306 | 75.1 |
| B | 5 | 191 | 17205 | 215.28 | 319 | 322 | 78.4 |
| B | 5 | 184 | 15195 | 189.65 | 319 | 322 | 78.4 |
| B | 4 | 232 | 2424 | 26.8 | 319 | 322 | 78.4 |
| C | 15 | 241 | 53109 | 685.23 | 271 | 279 | 77.1 |
| C | 3 | 111 | 3412 | 40.63 | 271 | 279 | 77.1 |
| C | 3 | 79 | 2549 | 29.44 | 271 | 279 | 77.1 |
| D | 2 | 216 | 3791 | 43.14 | 257 | 264 | 81.8 |
| D | 15 | 13 | 1348 | 13.26 | 257 | 264 | 81.8 |
| D | 13 | 13 | 1163 | 10.99 | 257 | 264 | 81.8 |
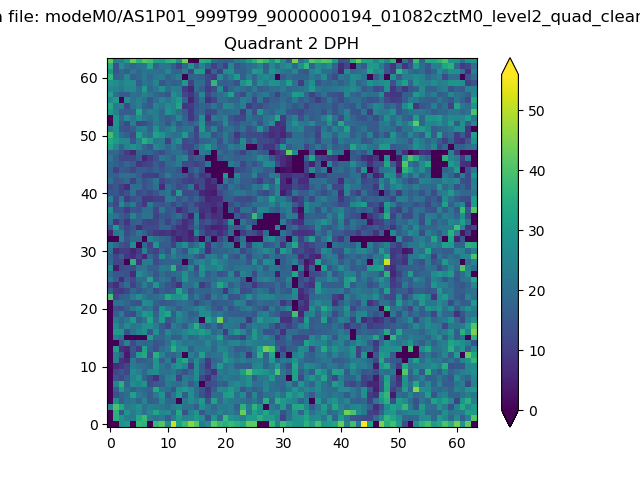
Histogram calculated using DETX and DETY for each event in the final _common_clean file
| Quadrant A | 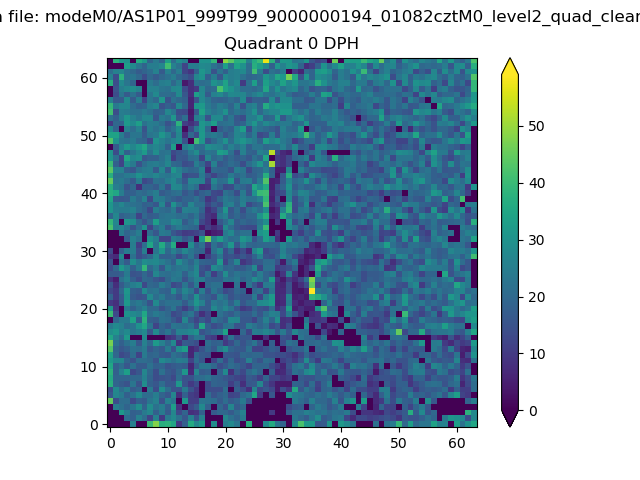 |
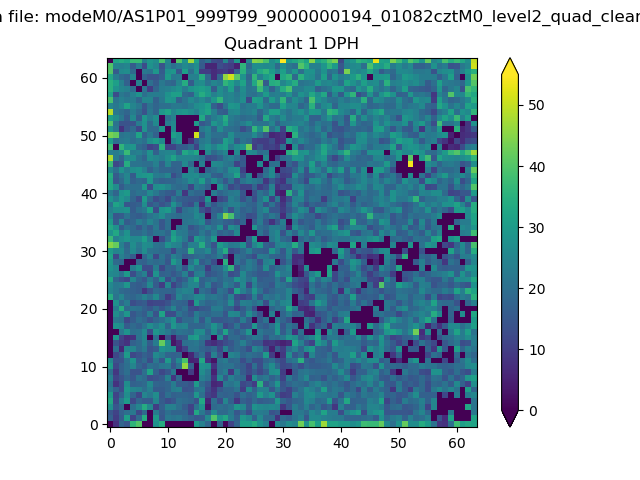 |
Quadrant B |
|---|---|---|---|
| Quadrant D | 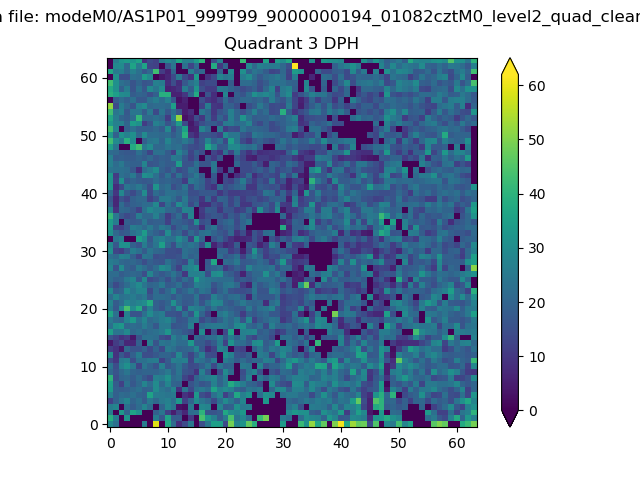 |
 |
Quadrant C |
| Plot type | Count rate plots | Images |
|---|---|---|
| Comparison with Poisson distribution Blue bars denote a histogram of data divided into 1 sec bins. Red curve is a Poisson curve with rate = median count rate of data. |
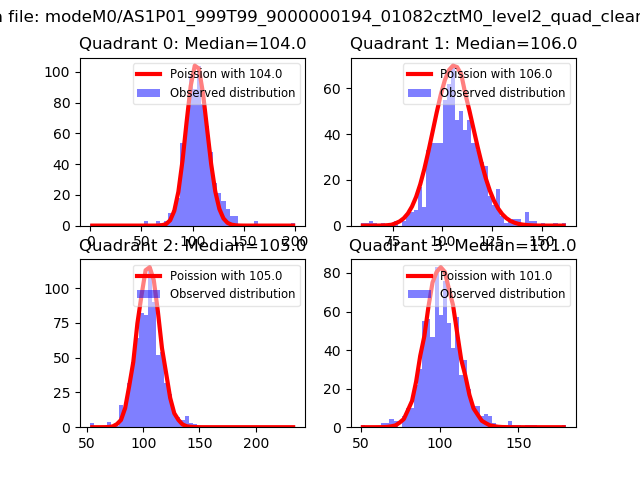 |
 |
| Quadrant-wise count rates Data is divided into 100 sec bins |
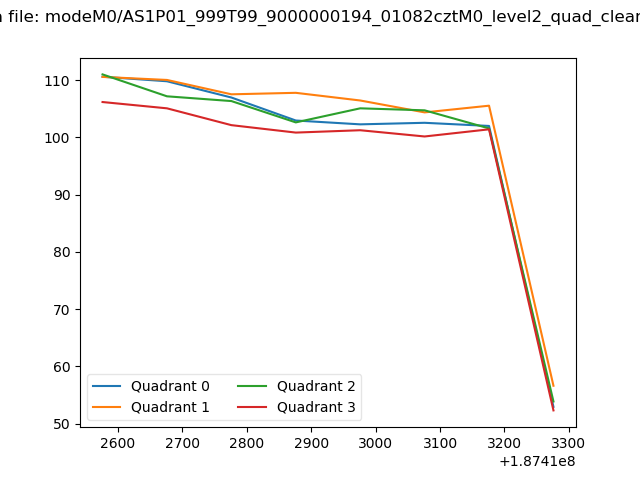 |
|
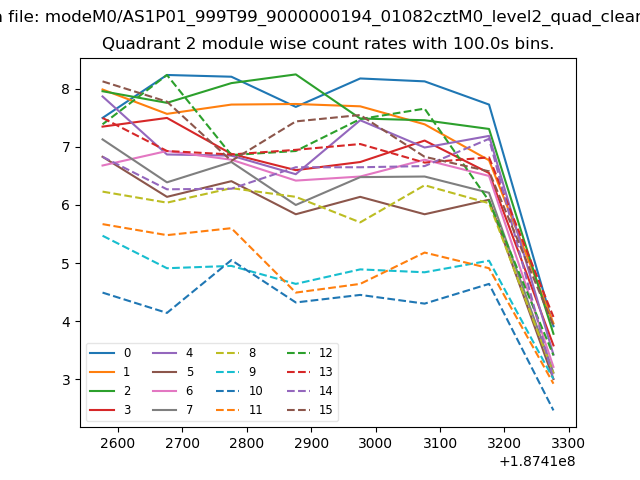
| Module-wise count rates for Quadrant A Data is divided into 100 sec bins |
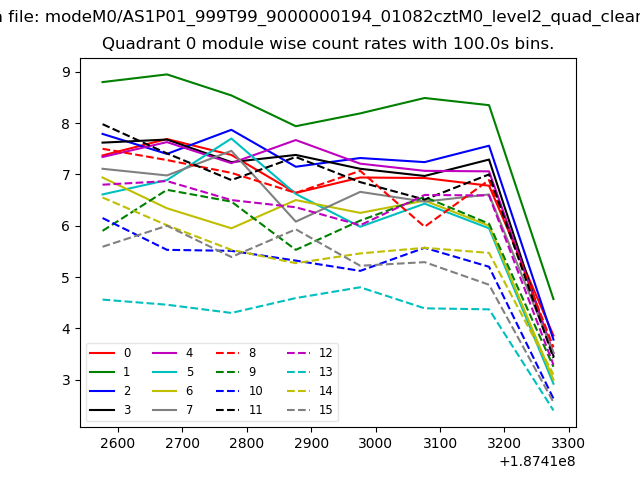 |
 |
| Module-wise count rates for Quadrant B Data is divided into 100 sec bins |
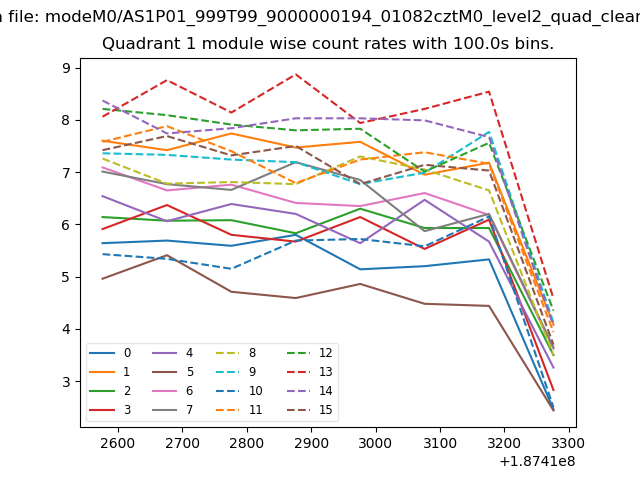 |
 |
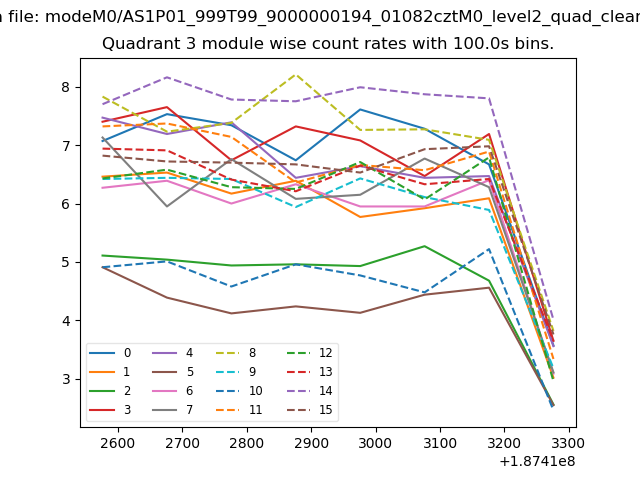
| Module-wise count rates for Quadrant C Data is divided into 100 sec bins |
 |
 |
| Module-wise count rates for Quadrant D Data is divided into 100 sec bins |
 |
 |
| Parameter | Plot |
|---|---|
| CZT HV Monitor | 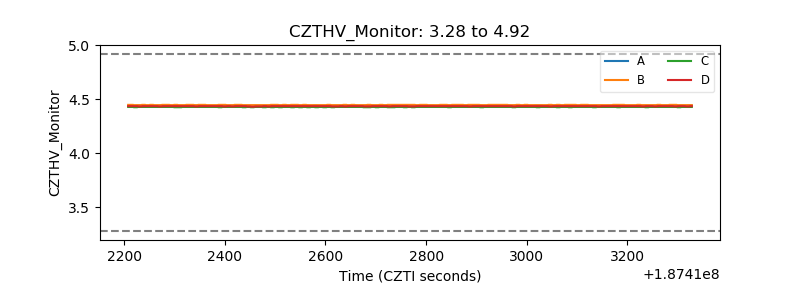 |
| D_VDD | 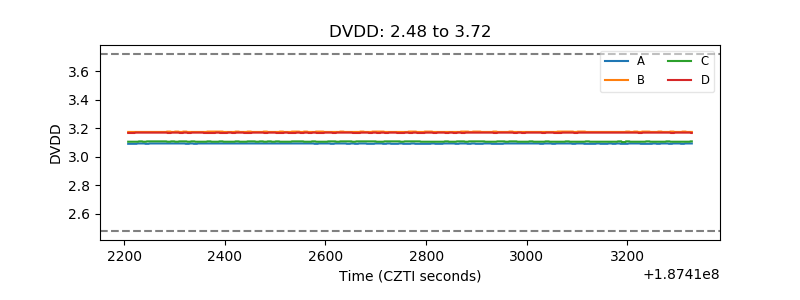 |
| Temperature 1 | 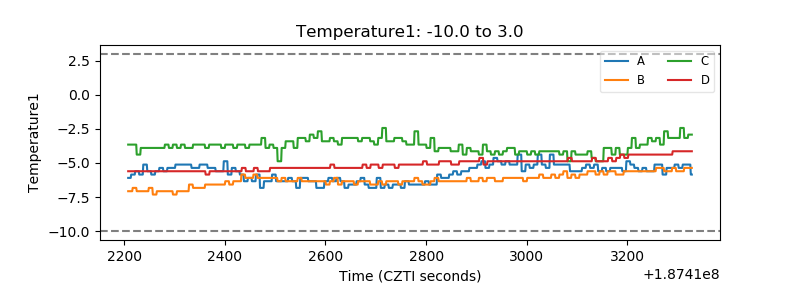 |
| Veto HV Monitor |  |
| Veto LLD | 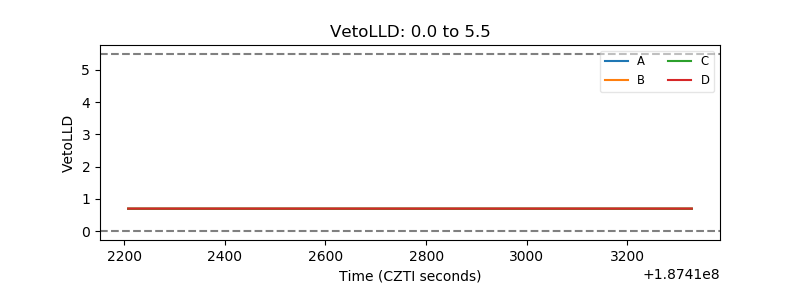 |
| Alpha Counter | 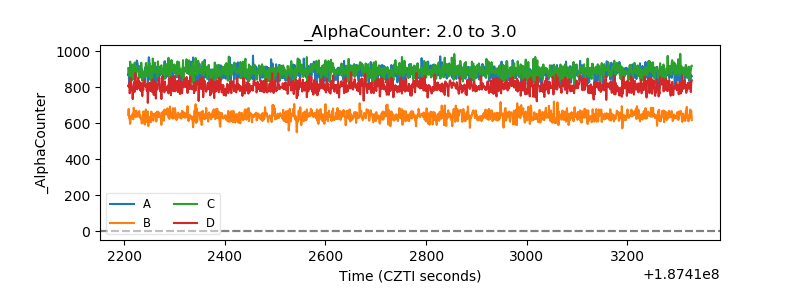 |
| _CPM_Rate | 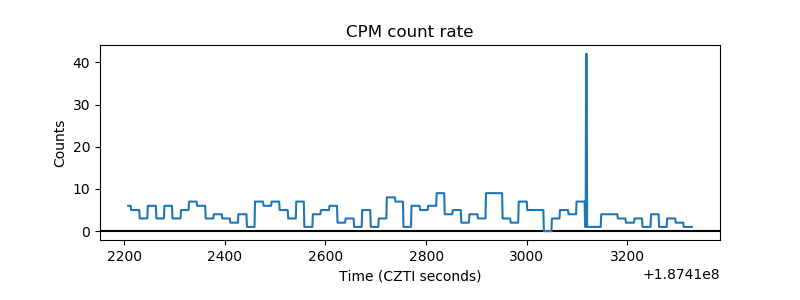 |
| CZT Counter | 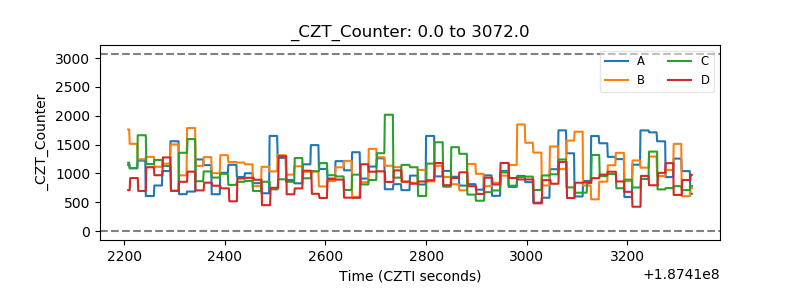 |
| +2.5 Volts monitor | 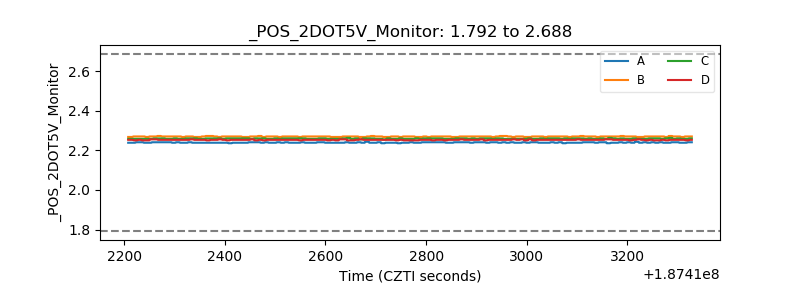 |
| +5 Volts monitor | 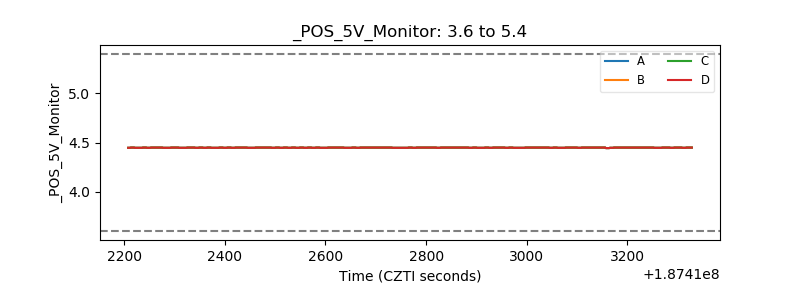 |
| _ROLL_ROT | 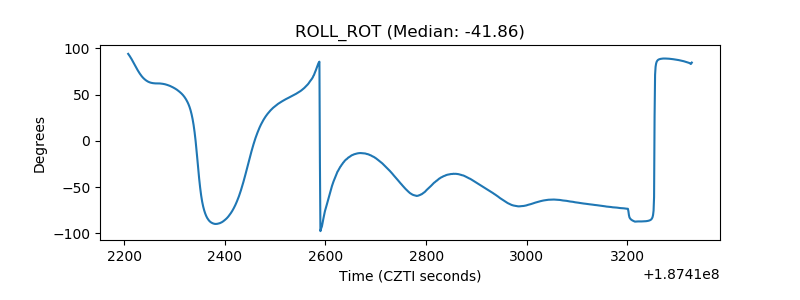 |
| _Roll_DEC | 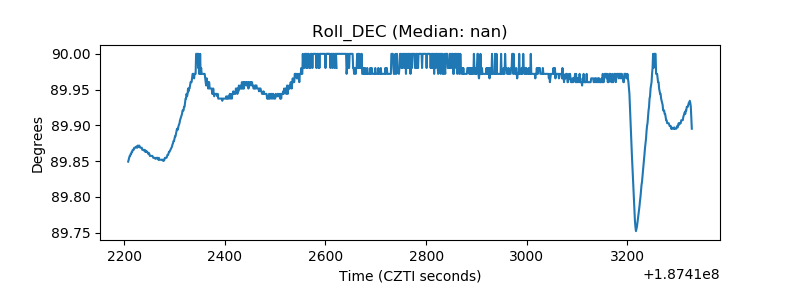 |
| _Roll_RA | 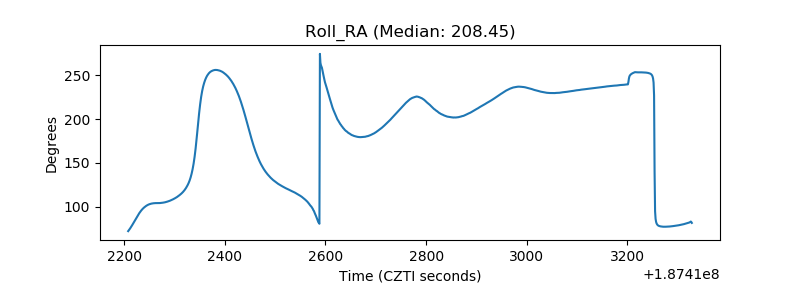 |
| Veto Counter | 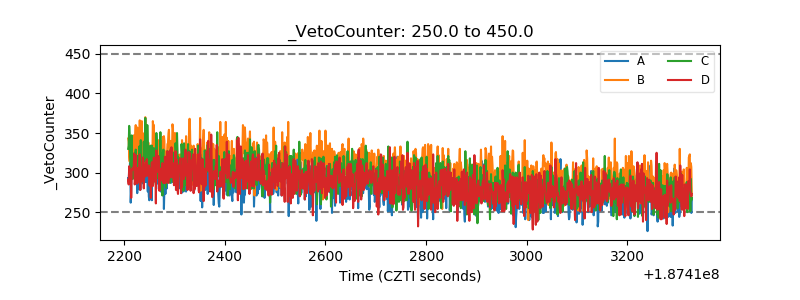 |