| Param | Original file | Final file |
|---|---|---|
| Filename | modeM0/AS1P01_997T01_9000000214cztM0_level2.fits | modeM0/AS1P01_997T01_9000000214cztM0_level2_quad_clean.evt |
| Size (bytes) | 843,505,920 | 1,352,689,920 |
| Size | 804.4 MB | 1.3 GB |
| Events in quadrant A | 4,899,088 | 8,966,204 |
| Events in quadrant B | 4,810,508 | 8,943,870 |
| Events in quadrant C | 4,682,480 | 8,283,306 |
| Events in quadrant D | 4,118,096 | 7,746,498 |
| Mode M9 | |||
|---|---|---|---|
| Quadrant | BADHDUFLAG | Total packets | Discarded packets |
| A | 0 | 158 | 0 |
| B | 0 | 158 | 0 |
| C | 0 | 158 | 0 |
| D | 0 | 158 | 0 |
| Mode M0 | |||
|---|---|---|---|
| Quadrant | BADHDUFLAG | Total packets | Discarded packets |
| A | 0 | 432663 | 0 |
| B | 0 | 451541 | 0 |
| C | 0 | 445534 | 0 |
| D | 0 | 411220 | 0 |
| Mode SS | |||
|---|---|---|---|
| Quadrant | BADHDUFLAG | Total packets | Discarded packets |
| A | 0 | 2088 | 0 |
| B | 0 | 2088 | 0 |
| C | 0 | 2088 | 0 |
| D | 0 | 2088 | 0 |
| Quadrant | Total seconds | Saturated seconds | Saturation percentage |
|---|---|---|---|
| A | 102628 | 273 | 0.266009% |
| B | 102629 | 367 | 0.357599% |
| C | 102629 | 1159 | 1.129310% |
| D | 102628 | 1118 | 1.089371% |
Noise dominated data is calculated using 1-second bins in cleaned event files. If a bin has >2000 counts, and if more than 50% of those come from <1% of pixels, then it is considered to be noise-dominated and hence unusable.
| Quadrant | # 1 sec bins | Bins with >0 counts | Bins with >2000 counts | High rate bins dominated by noise | Noise dominated (total time) | Noise dominated (detector-on time) | Marked lightcurve |
|---|---|---|---|---|---|---|---|
| A | 123598 | 102620 | 0 | 0 | 0.00% | 0.00% |  |
| B | 123599 | 102621 | 0 | 0 | 0.00% | 0.00% |  |
| C | 123599 | 102626 | 0 | 0 | 0.00% | 0.00% |  |
| D | 123598 | 102586 | 0 | 0 | 0.00% | 0.00% |  |
Top three noisy pixels from each quadrant. If the there are fewer than three noisy pixels in the level2.evt file, extra rows are filled as -1
| Pixel properties | Quadrant properties | ||||||
|---|---|---|---|---|---|---|---|
| Quadrant | DetID | PixID | Counts | Sigma | Mean | Median | Sigma |
| A | 0 | 29 | 4449 | 11.31 | 1266 | 1184 | 288.7 |
| A | 7 | 110 | 4416 | 11.19 | 1266 | 1184 | 288.7 |
| A | 14 | 188 | 3692 | 8.69 | 1266 | 1184 | 288.7 |
| B | 2 | 9 | 3966 | 12.08 | 1272 | 1210 | 228.1 |
| B | 14 | 254 | 3311 | 9.21 | 1272 | 1210 | 228.1 |
| B | 5 | 128 | 3289 | 9.11 | 1272 | 1210 | 228.1 |
| C | 12 | 241 | 3376 | 7.41 | 1238 | 1141 | 301.7 |
| C | 2 | 191 | 3193 | 6.8 | 1238 | 1141 | 301.7 |
| C | 1 | 81 | 3042 | 6.3 | 1238 | 1141 | 301.7 |
| D | 1 | 19 | 3116 | 7.4 | 1176 | 1079 | 275.3 |
| D | 6 | 231 | 3054 | 7.18 | 1176 | 1079 | 275.3 |
| D | 6 | 44 | 2962 | 6.84 | 1176 | 1079 | 275.3 |
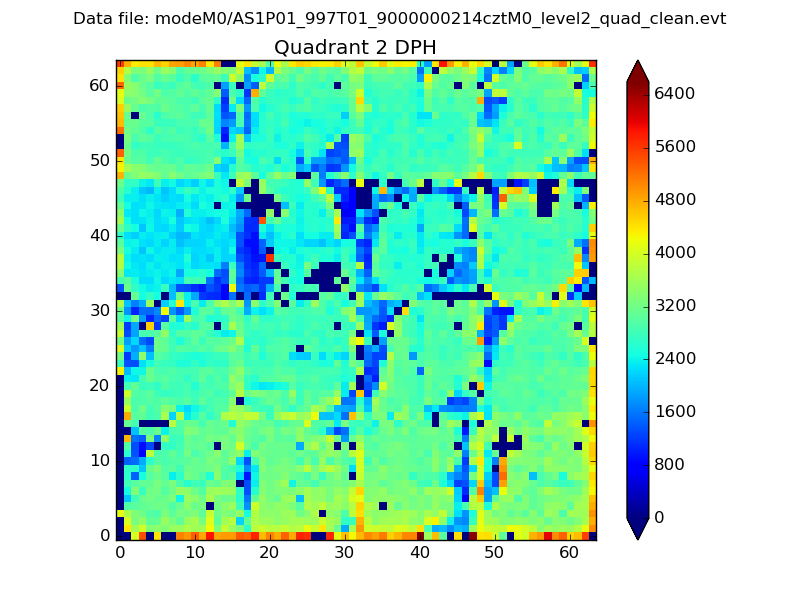
Histogram calculated using DETX and DETY for each event in the final _common_clean file
| Quadrant A |  |
 |
Quadrant B |
|---|---|---|---|
| Quadrant D |  |
 |
Quadrant C |
| Plot type | Count rate plots | Images |
|---|---|---|
| Comparison with Poisson distribution Blue bars denote a histogram of data divided into 1 sec bins. Red curve is a Poisson curve with rate = median count rate of data. |
 |
 |
| Quadrant-wise count rates Data is divided into 100 sec bins |
 |
|
| Module-wise count rates for Quadrant A Data is divided into 100 sec bins |
 |
 |
| Module-wise count rates for Quadrant B Data is divided into 100 sec bins |
 |
 |
| Module-wise count rates for Quadrant C Data is divided into 100 sec bins |
 |
 |
| Module-wise count rates for Quadrant D Data is divided into 100 sec bins |
 |
 |
| Parameter | Plot |
|---|---|
| CZT HV Monitor |  |
| D_VDD |  |
| Temperature 1 |  |
| Veto HV Monitor |  |
| Veto LLD |  |
| Alpha Counter |  |
| _CPM_Rate |  |
| CZT Counter |  |
| +2.5 Volts monitor |  |
| +5 Volts monitor |  |
| _ROLL_ROT |  |
| _Roll_DEC |  |
| _Roll_RA |  |
| Veto Counter |  |