| Param | Original file | Final file |
|---|---|---|
| Filename | modeM0/AS1P01_997T01_9000000214_01111cztM0_level2.evt | modeM0/AS1P01_997T01_9000000214_01111cztM0_level2_quad_clean.evt |
| Size (bytes) | 515,476,800 | 49,766,400 |
| Size | 491.6 MB | 47.5 MB |
| Events in quadrant A | 3,805,500 | 329,691 |
| Events in quadrant B | 3,981,085 | 331,814 |
| Events in quadrant C | 3,900,714 | 314,642 |
| Events in quadrant D | 3,716,726 | 309,987 |
| Mode M9 | |||
|---|---|---|---|
| Quadrant | BADHDUFLAG | Total packets | Discarded packets |
| A | 0 | 11 | 0 |
| B | 0 | 11 | 0 |
| C | 0 | 11 | 0 |
| D | 0 | 11 | 0 |
| Mode M0 | |||
|---|---|---|---|
| Quadrant | BADHDUFLAG | Total packets | Discarded packets |
| A | 0 | 13522 | 2 |
| B | 0 | 14036 | 1 |
| C | 0 | 13781 | 1 |
| D | 0 | 13239 | 1 |
| Mode SS | |||
|---|---|---|---|
| Quadrant | BADHDUFLAG | Total packets | Discarded packets |
| A | 0 | 66 | 0 |
| B | 0 | 66 | 0 |
| C | 0 | 66 | 0 |
| D | 0 | 66 | 0 |
| Quadrant | Total seconds | Saturated seconds | Saturation percentage |
|---|---|---|---|
| A | 3093 | 16 | 0.517297% |
| B | 3093 | 15 | 0.484966% |
| C | 3093 | 5 | 0.161655% |
| D | 3093 | 28 | 0.905270% |
Noise dominated data is calculated using 1-second bins in cleaned event files. If a bin has >2000 counts, and if more than 50% of those come from <1% of pixels, then it is considered to be noise-dominated and hence unusable.
| Quadrant | # 1 sec bins | Bins with >0 counts | Bins with >2000 counts | High rate bins dominated by noise | Noise dominated (total time) | Noise dominated (detector-on time) | Marked lightcurve |
|---|---|---|---|---|---|---|---|
| A | 4278 | 3094 | 97 | 97 | 2.27% | 3.14% | 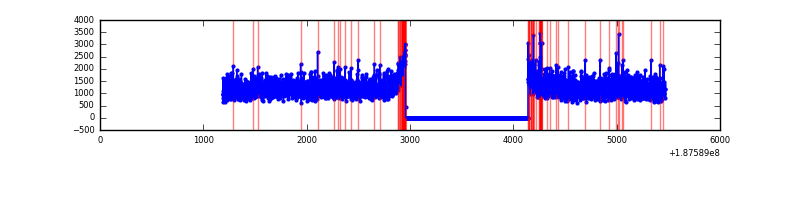 |
| B | 4278 | 3094 | 139 | 139 | 3.25% | 4.49% | 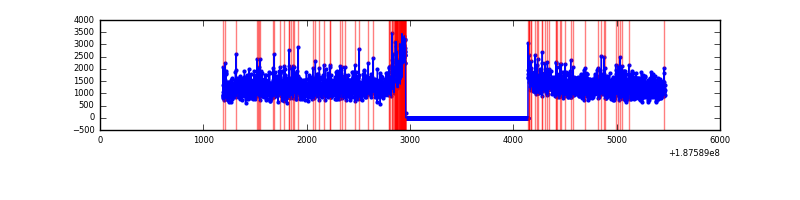 |
| C | 4278 | 3094 | 91 | 91 | 2.13% | 2.94% | 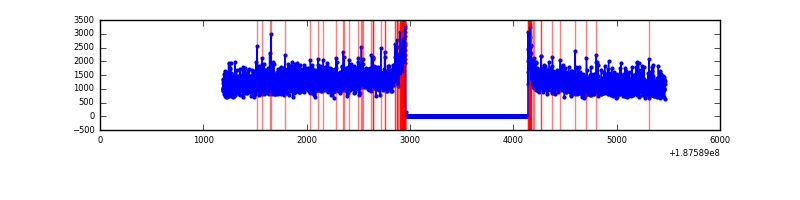 |
| D | 4278 | 3094 | 90 | 90 | 2.10% | 2.91% | 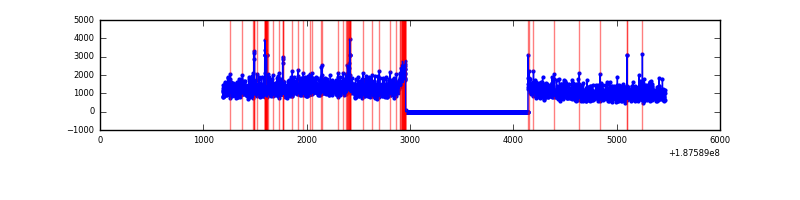 |
Top three noisy pixels from each quadrant. If the there are fewer than three noisy pixels in the level2.evt file, extra rows are filled as -1
| Pixel properties | Quadrant properties | ||||||
|---|---|---|---|---|---|---|---|
| Quadrant | DetID | PixID | Counts | Sigma | Mean | Median | Sigma |
| A | 4 | 32 | 73023 | 308.18 | 970 | 973 | 233.8 |
| A | 0 | 253 | 7444 | 27.68 | 970 | 973 | 233.8 |
| A | 11 | 79 | 4837 | 16.53 | 970 | 973 | 233.8 |
| B | 8 | 38 | 51210 | 211.12 | 1019 | 1023 | 237.7 |
| B | 5 | 249 | 12734 | 49.26 | 1019 | 1023 | 237.7 |
| B | 15 | 22 | 11205 | 42.83 | 1019 | 1023 | 237.7 |
| C | 15 | 241 | 154346 | 585.59 | 931 | 962 | 261.9 |
| C | 10 | 207 | 74240 | 279.76 | 931 | 962 | 261.9 |
| C | 3 | 79 | 12794 | 45.17 | 931 | 962 | 261.9 |
| D | 2 | 16 | 177574 | 663.31 | 903 | 928 | 266.3 |
| D | 2 | 216 | 99793 | 371.24 | 903 | 928 | 266.3 |
| D | 2 | 152 | 22049 | 79.31 | 903 | 928 | 266.3 |
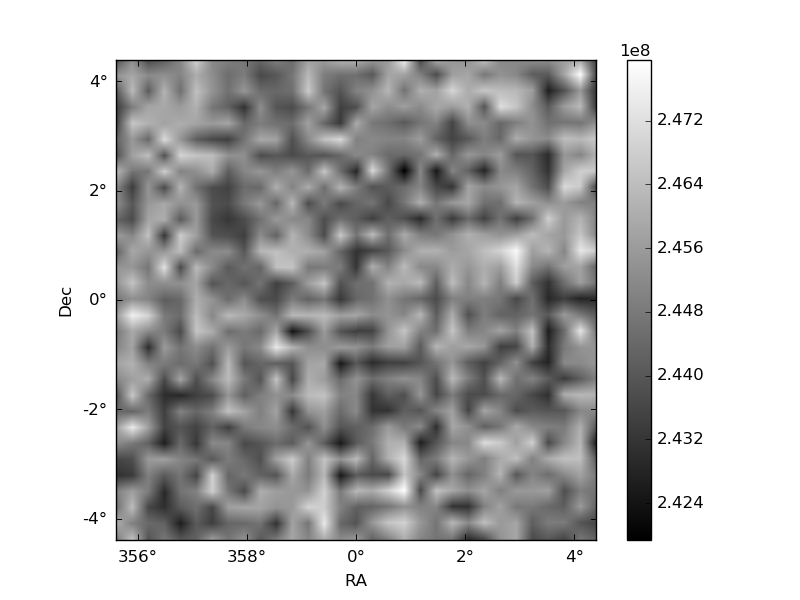
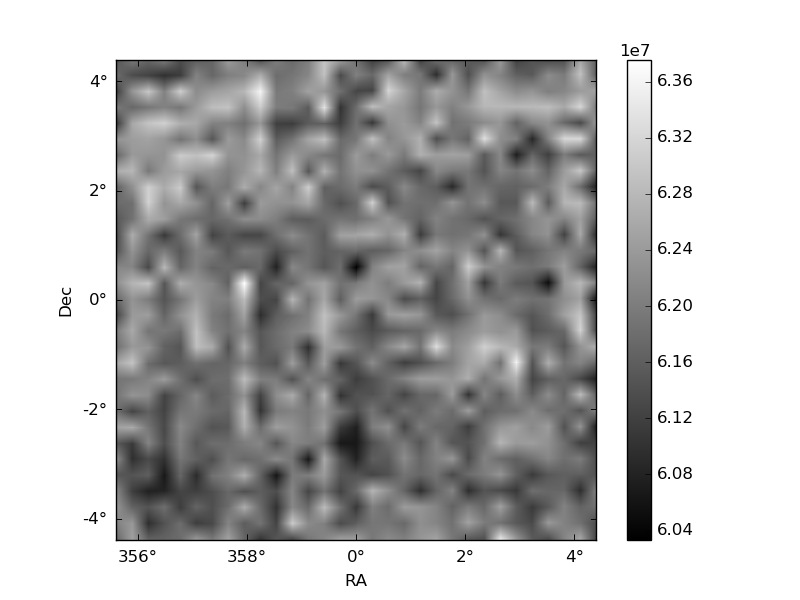
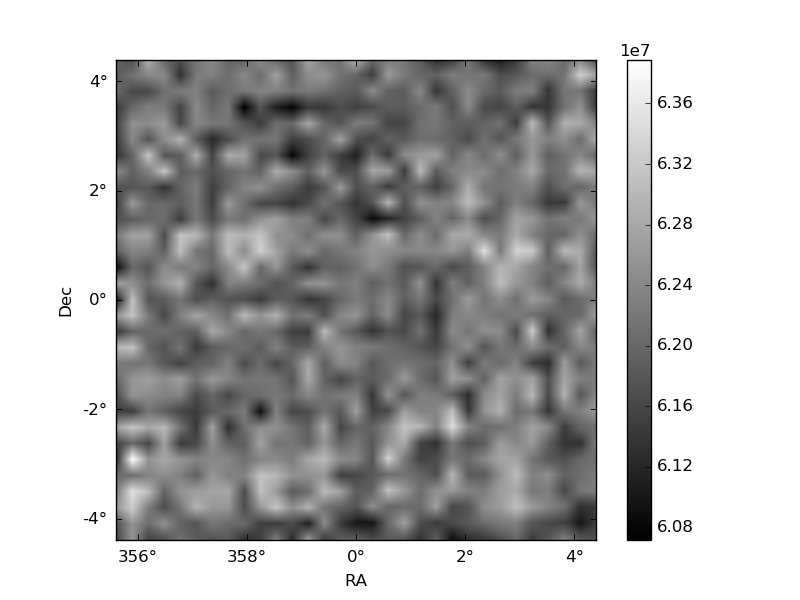
Histogram calculated using DETX and DETY for each event in the final _common_clean file
| Quadrant A | 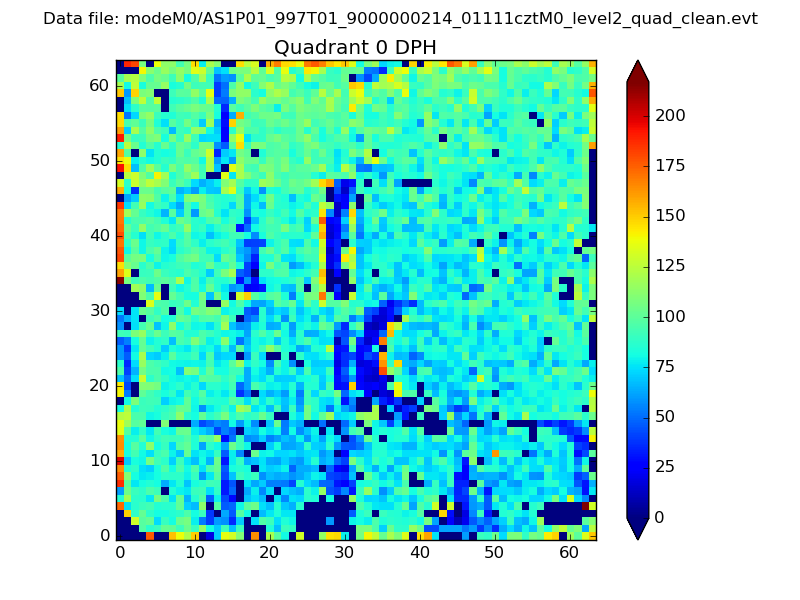 |
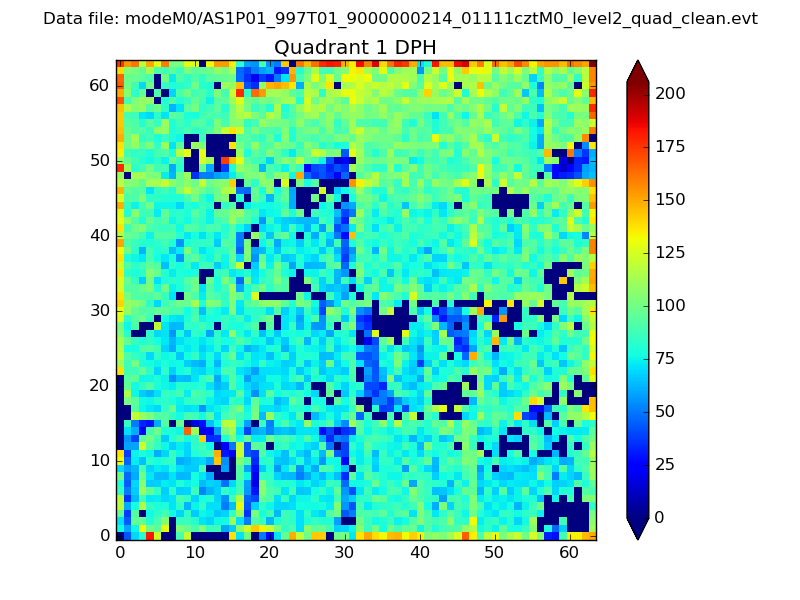 |
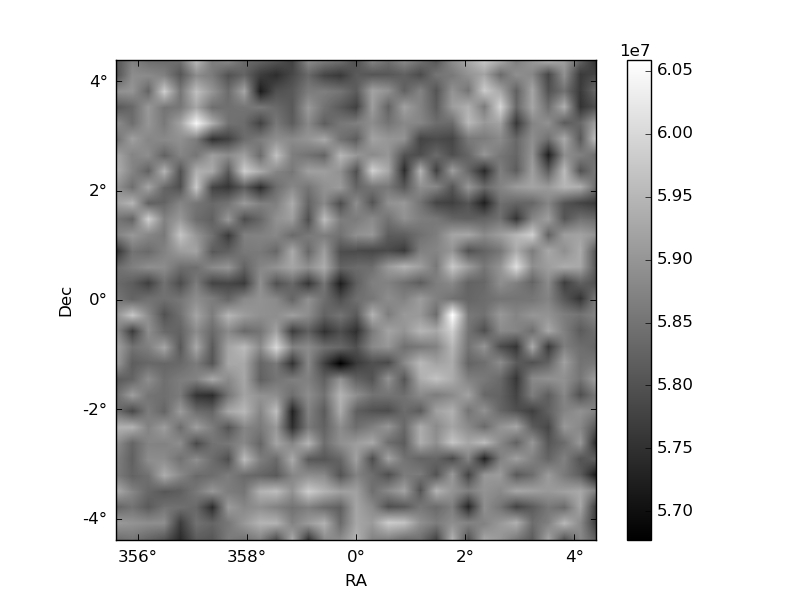
Quadrant B |
|---|---|---|---|
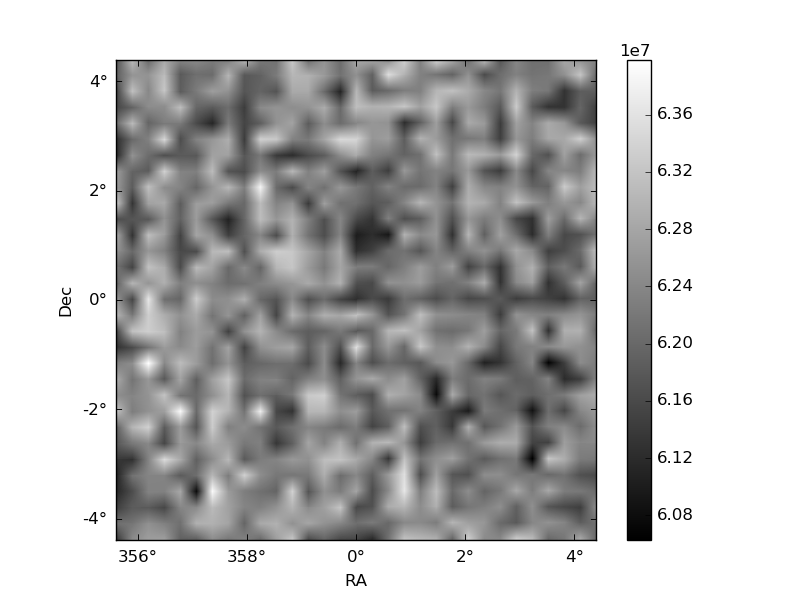
| Quadrant D | 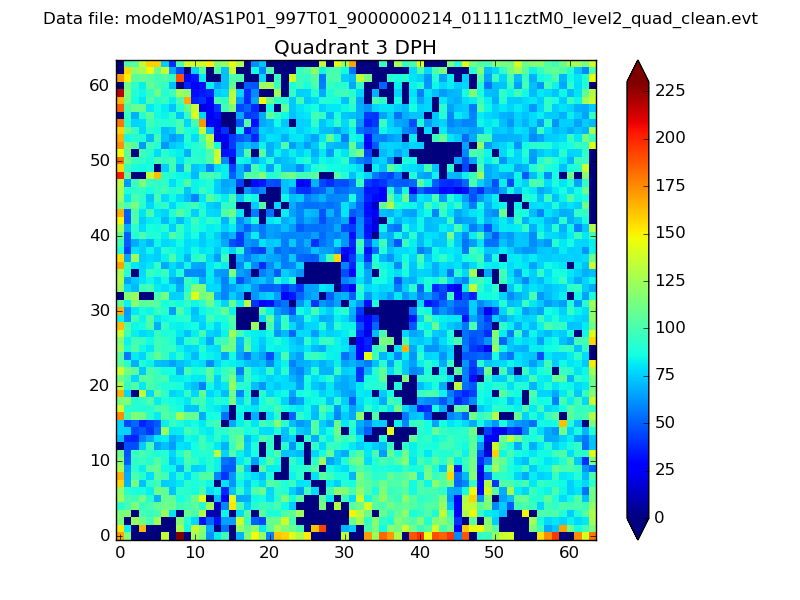 |
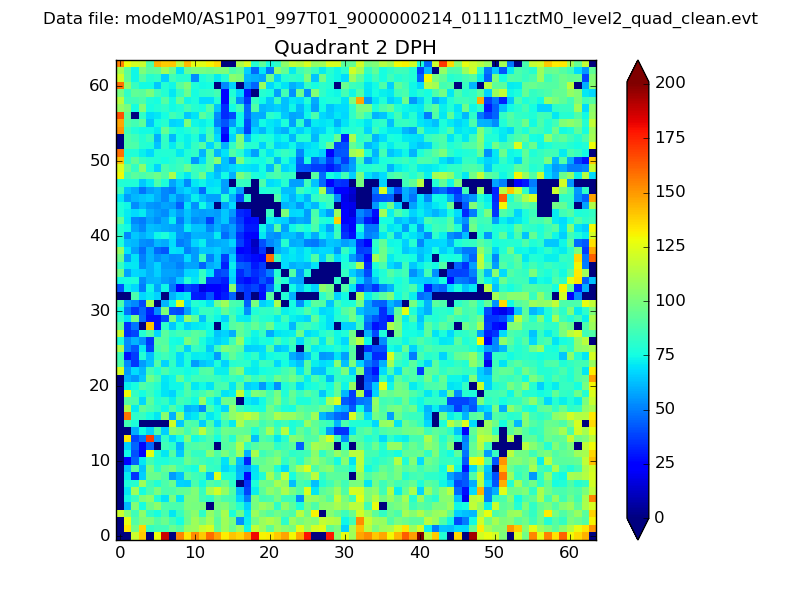 |
Quadrant C |
| Plot type | Count rate plots | Images |
|---|---|---|
| Comparison with Poisson distribution Blue bars denote a histogram of data divided into 1 sec bins. Red curve is a Poisson curve with rate = median count rate of data. |
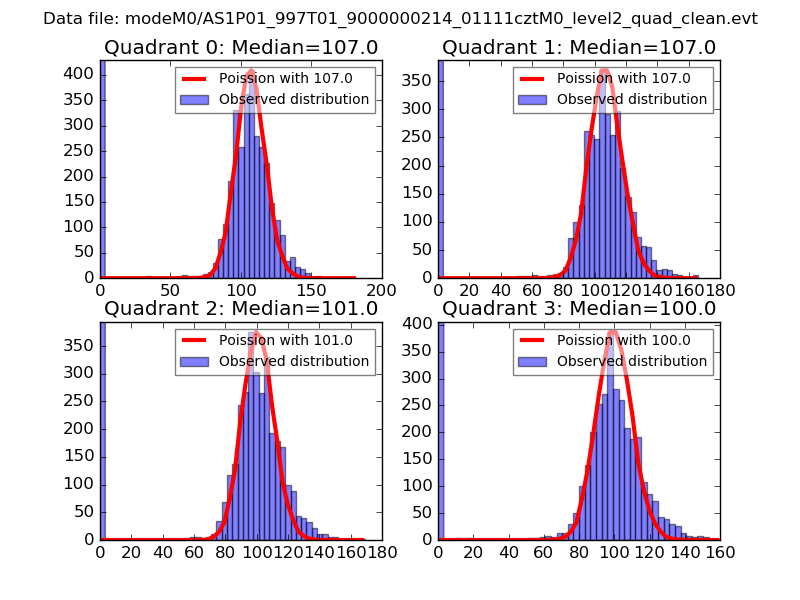 |
 |
| Quadrant-wise count rates Data is divided into 100 sec bins |
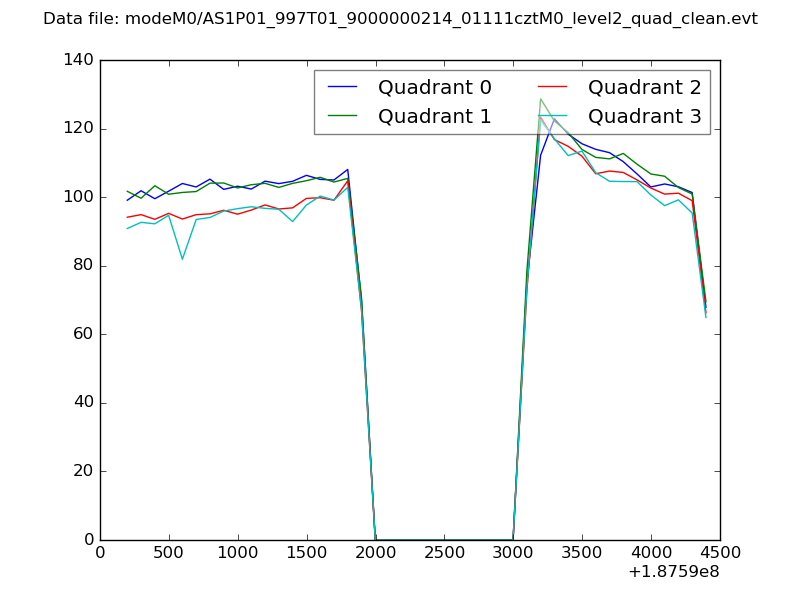 |
|
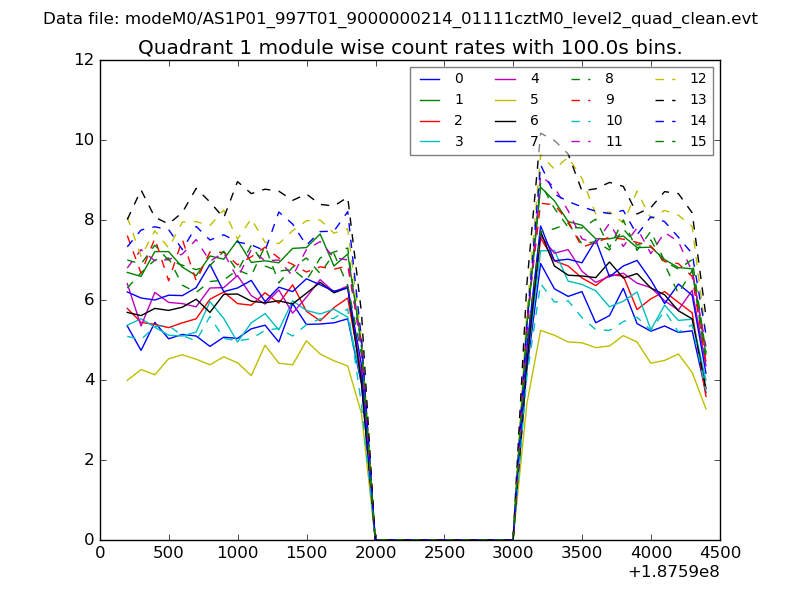
| Module-wise count rates for Quadrant A Data is divided into 100 sec bins |
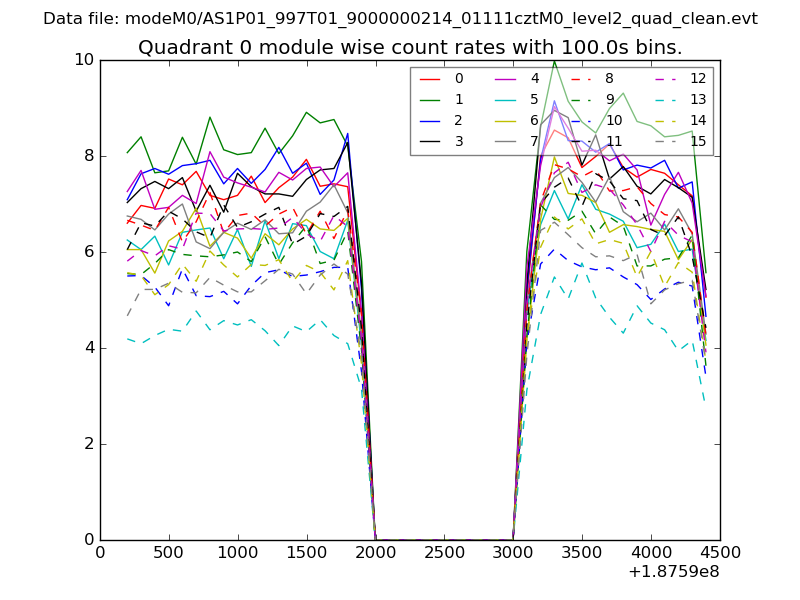 |
 |
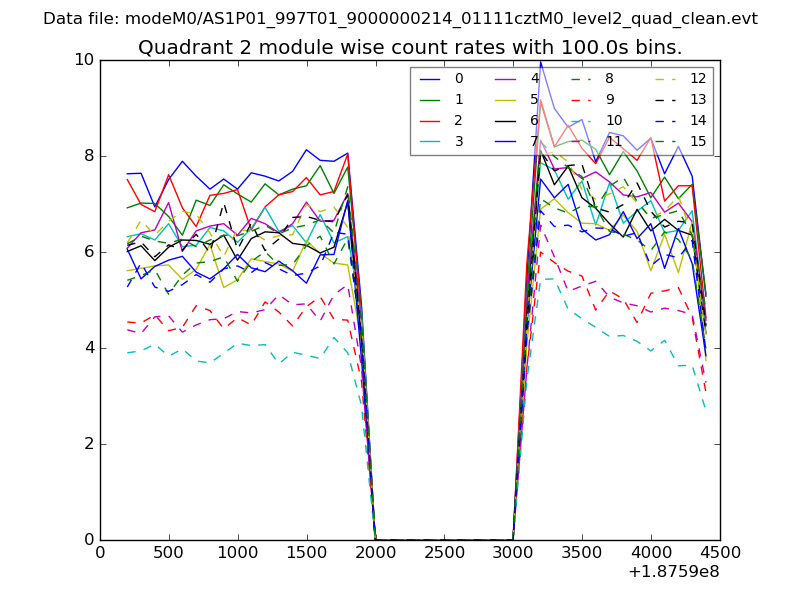
| Module-wise count rates for Quadrant B Data is divided into 100 sec bins |
 |
 |
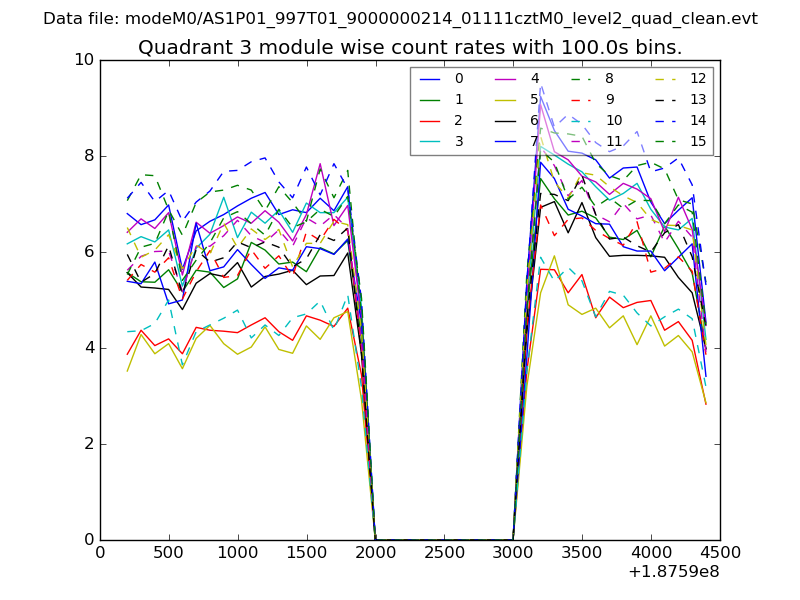
| Module-wise count rates for Quadrant C Data is divided into 100 sec bins |
 |
 |
| Module-wise count rates for Quadrant D Data is divided into 100 sec bins |
 |
 |
| Parameter | Plot |
|---|---|
| CZT HV Monitor | 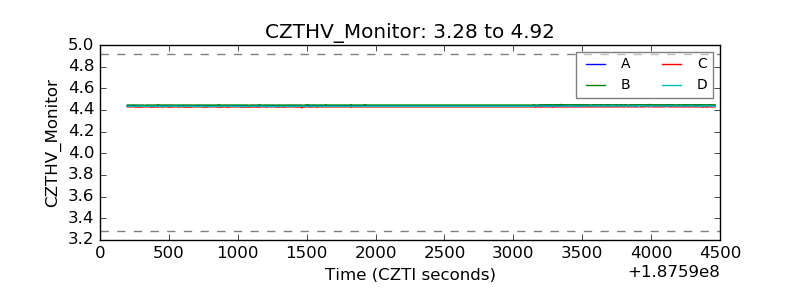 |
| D_VDD | 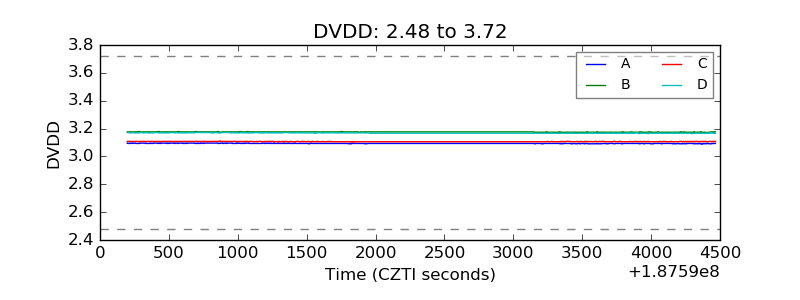 |
| Temperature 1 | 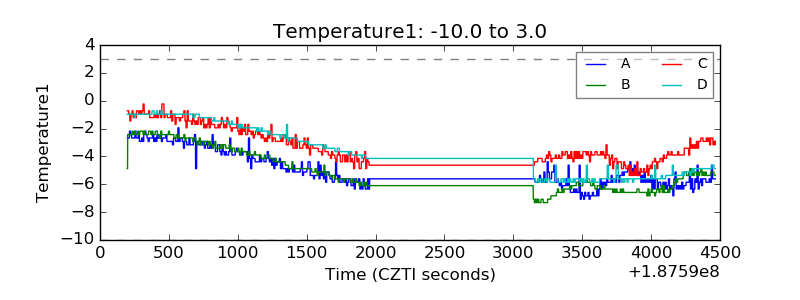 |
| Veto HV Monitor | 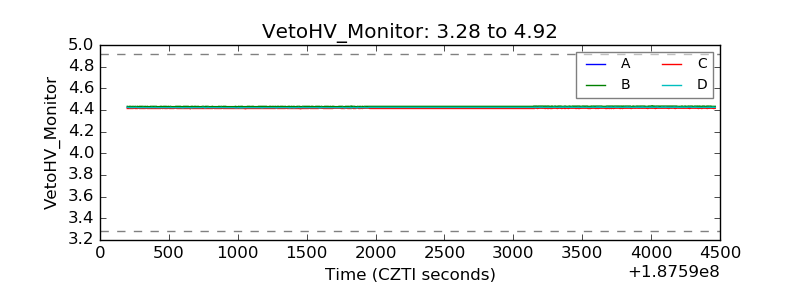 |
| Veto LLD | 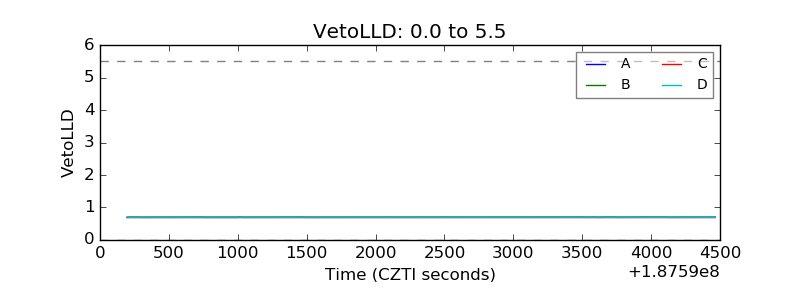 |
| Alpha Counter | 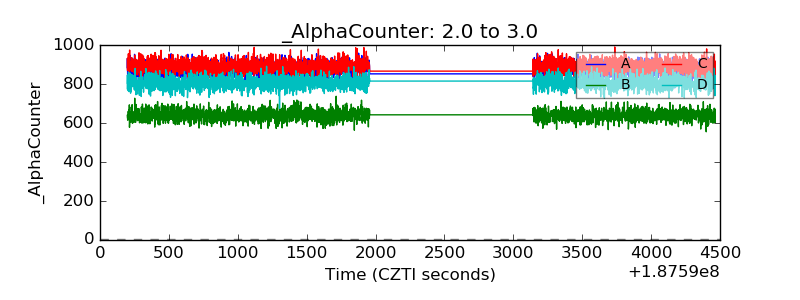 |
| _CPM_Rate | 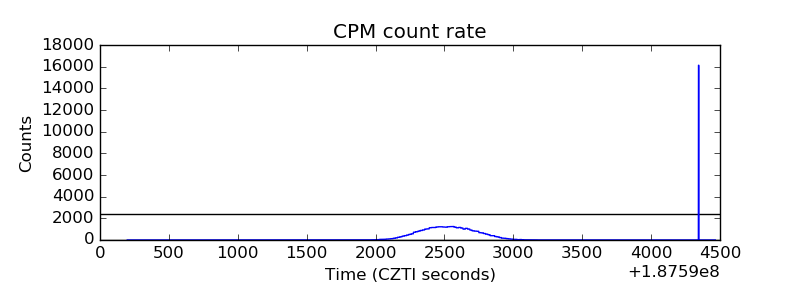 |
| CZT Counter | 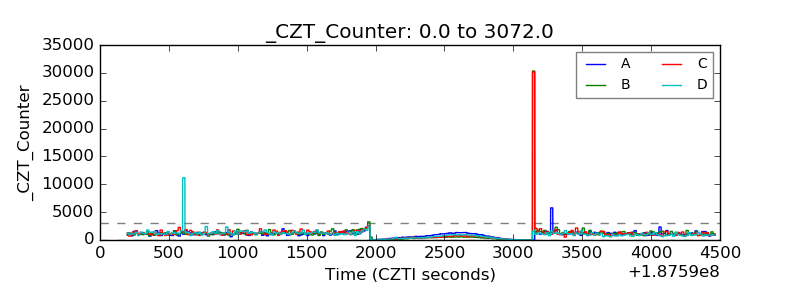 |
| +2.5 Volts monitor |  |
| +5 Volts monitor |  |
| _ROLL_ROT | 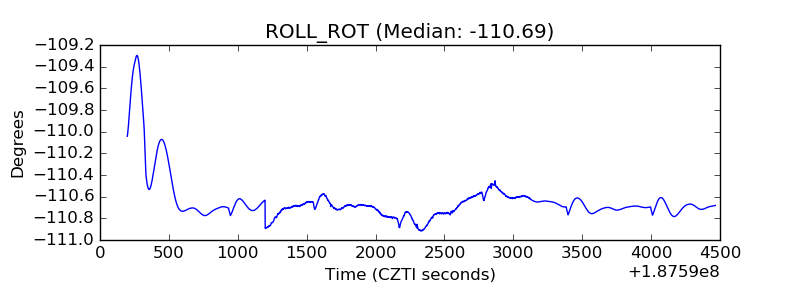 |
| _Roll_DEC | 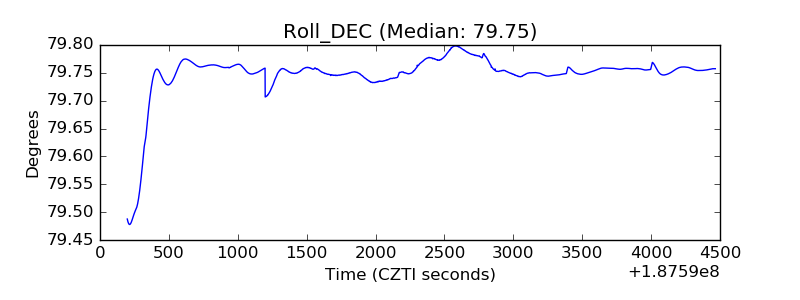 |
| _Roll_RA | 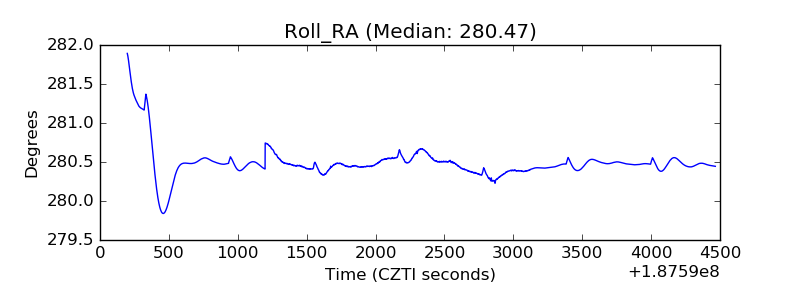 |
| Veto Counter | 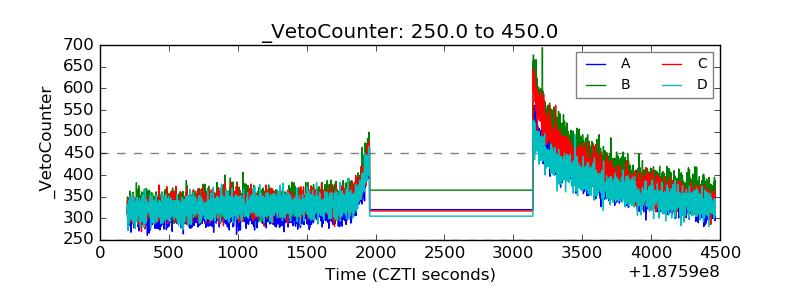 |