| Param | Original file | Final file |
|---|---|---|
| Filename | modeM0/AS1P01_997T01_9000000214_01113cztM0_level2.evt | modeM0/AS1P01_997T01_9000000214_01113cztM0_level2_quad_clean.evt |
| Size (bytes) | 957,522,240 | 98,023,680 |
| Size | 913.2 MB | 93.5 MB |
| Events in quadrant A | 7,273,317 | 650,205 |
| Events in quadrant B | 7,488,792 | 654,213 |
| Events in quadrant C | 7,217,732 | 619,226 |
| Events in quadrant D | 6,609,909 | 615,297 |
| Mode M9 | |||
|---|---|---|---|
| Quadrant | BADHDUFLAG | Total packets | Discarded packets |
| A | 0 | 11 | 0 |
| B | 0 | 11 | 0 |
| C | 0 | 11 | 0 |
| D | 0 | 11 | 0 |
| Mode M0 | |||
|---|---|---|---|
| Quadrant | BADHDUFLAG | Total packets | Discarded packets |
| A | 0 | 25971 | 2 |
| B | 0 | 26577 | 1 |
| C | 0 | 25805 | 1 |
| D | 0 | 23982 | 1 |
| Mode SS | |||
|---|---|---|---|
| Quadrant | BADHDUFLAG | Total packets | Discarded packets |
| A | 0 | 126 | 0 |
| B | 0 | 126 | 0 |
| C | 0 | 126 | 0 |
| D | 0 | 126 | 0 |
| Quadrant | Total seconds | Saturated seconds | Saturation percentage |
|---|---|---|---|
| A | 6143 | 24 | 0.390689% |
| B | 6143 | 14 | 0.227902% |
| C | 6143 | 25 | 0.406967% |
| D | 6143 | 22 | 0.358131% |
Noise dominated data is calculated using 1-second bins in cleaned event files. If a bin has >2000 counts, and if more than 50% of those come from <1% of pixels, then it is considered to be noise-dominated and hence unusable.
| Quadrant | # 1 sec bins | Bins with >0 counts | Bins with >2000 counts | High rate bins dominated by noise | Noise dominated (total time) | Noise dominated (detector-on time) | Marked lightcurve |
|---|---|---|---|---|---|---|---|
| A | 7338 | 6143 | 167 | 167 | 2.28% | 2.72% | 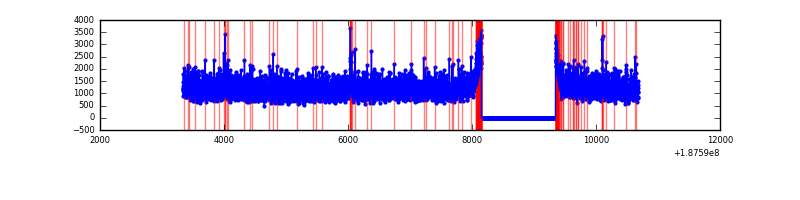 |
| B | 7338 | 6144 | 171 | 171 | 2.33% | 2.78% | 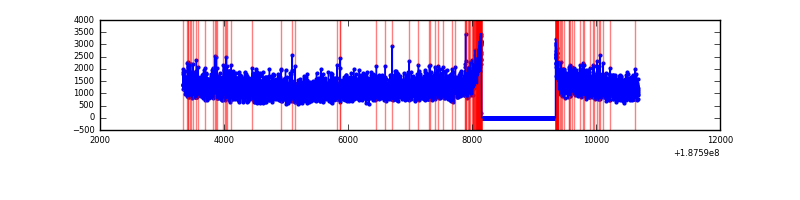 |
| C | 7338 | 6144 | 143 | 143 | 1.95% | 2.33% | 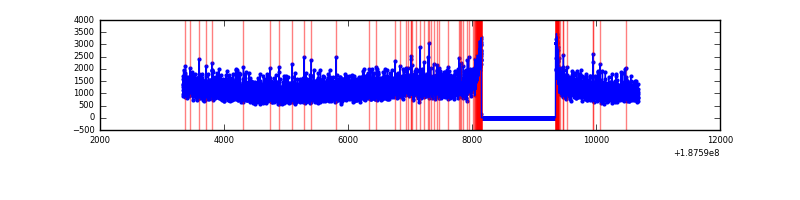 |
| D | 7338 | 6144 | 140 | 140 | 1.91% | 2.28% | 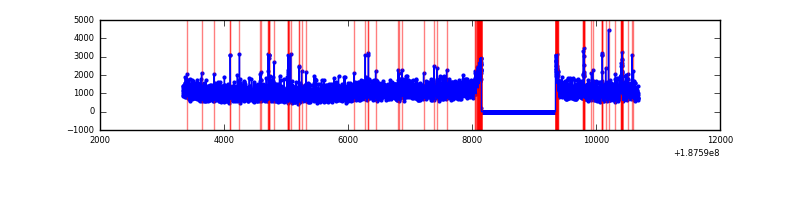 |
Top three noisy pixels from each quadrant. If the there are fewer than three noisy pixels in the level2.evt file, extra rows are filled as -1
| Pixel properties | Quadrant properties | ||||||
|---|---|---|---|---|---|---|---|
| Quadrant | DetID | PixID | Counts | Sigma | Mean | Median | Sigma |
| A | 4 | 32 | 53754 | 115.59 | 1877 | 1889 | 448.7 |
| A | 0 | 253 | 15420 | 30.16 | 1877 | 1889 | 448.7 |
| A | 11 | 79 | 7923 | 13.45 | 1877 | 1889 | 448.7 |
| B | 4 | 187 | 19640 | 38.97 | 1945 | 1959 | 453.7 |
| B | 0 | 190 | 17289 | 33.79 | 1945 | 1959 | 453.7 |
| B | 15 | 22 | 16756 | 32.62 | 1945 | 1959 | 453.7 |
| C | 15 | 241 | 319216 | 657.81 | 1729 | 1783 | 482.6 |
| C | 10 | 207 | 78700 | 159.39 | 1729 | 1783 | 482.6 |
| C | 10 | 19 | 32831 | 64.34 | 1729 | 1783 | 482.6 |
| D | 2 | 216 | 66641 | 132.76 | 1727 | 1763 | 488.7 |
| D | 7 | 67 | 51282 | 101.33 | 1727 | 1763 | 488.7 |
| D | 10 | 125 | 19899 | 37.11 | 1727 | 1763 | 488.7 |
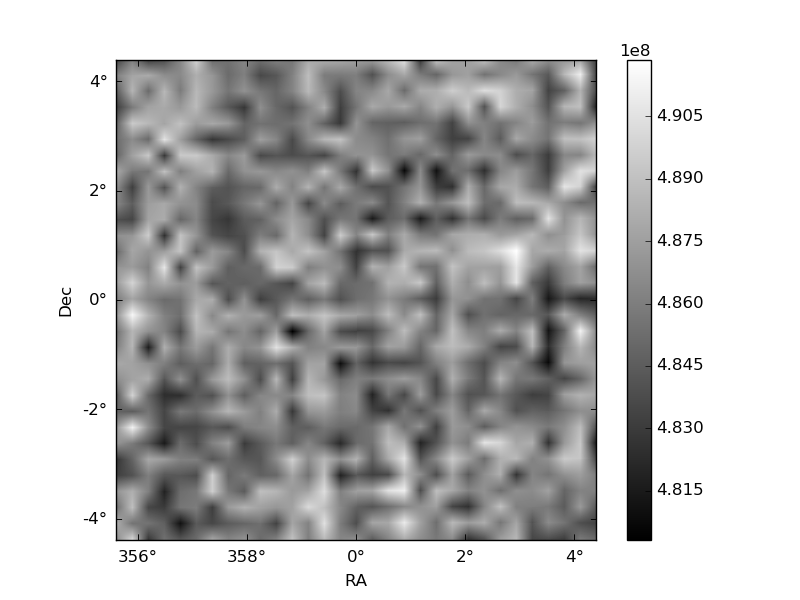
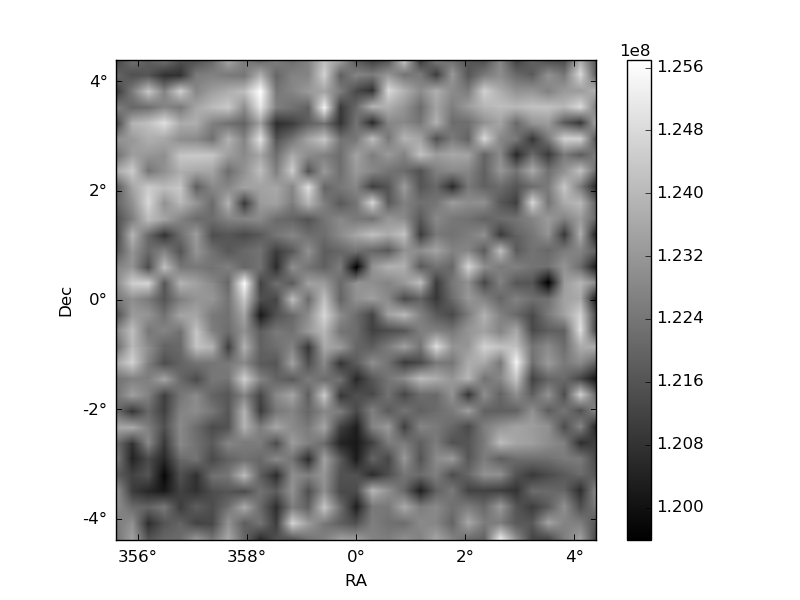
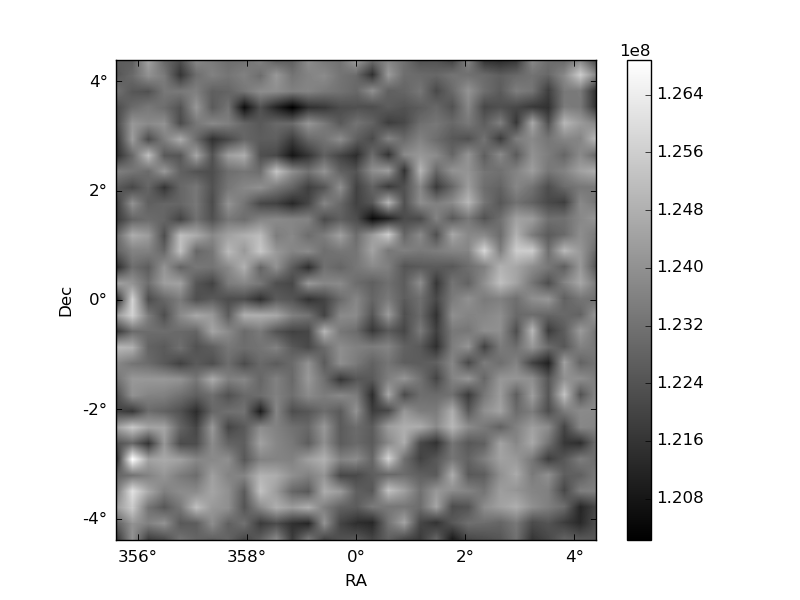
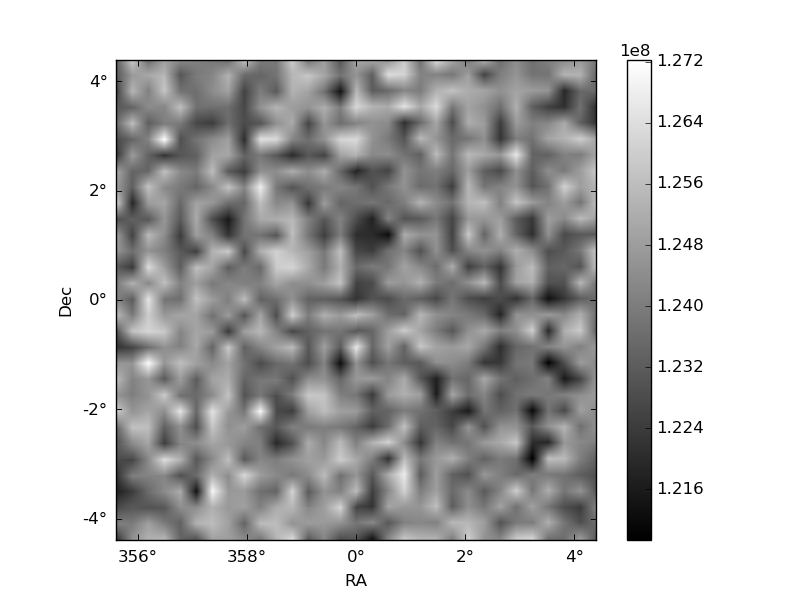
Histogram calculated using DETX and DETY for each event in the final _common_clean file
| Quadrant A | 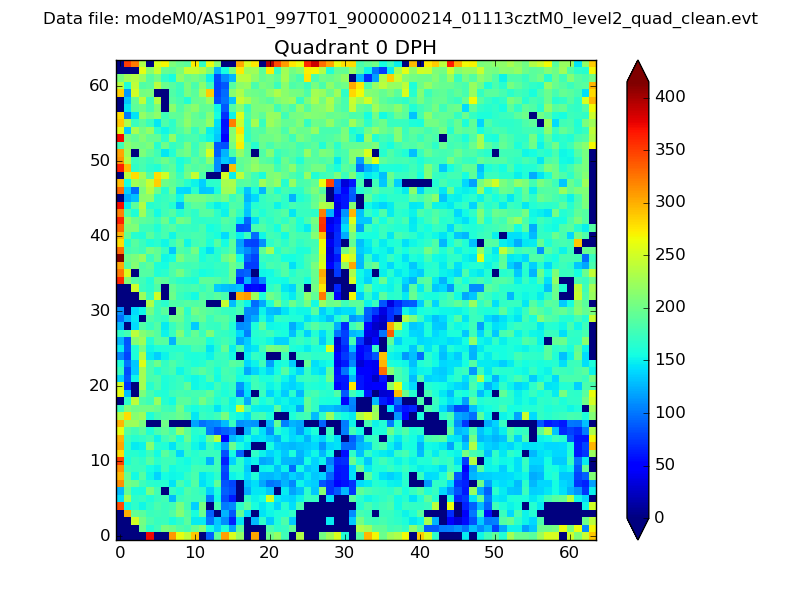 |
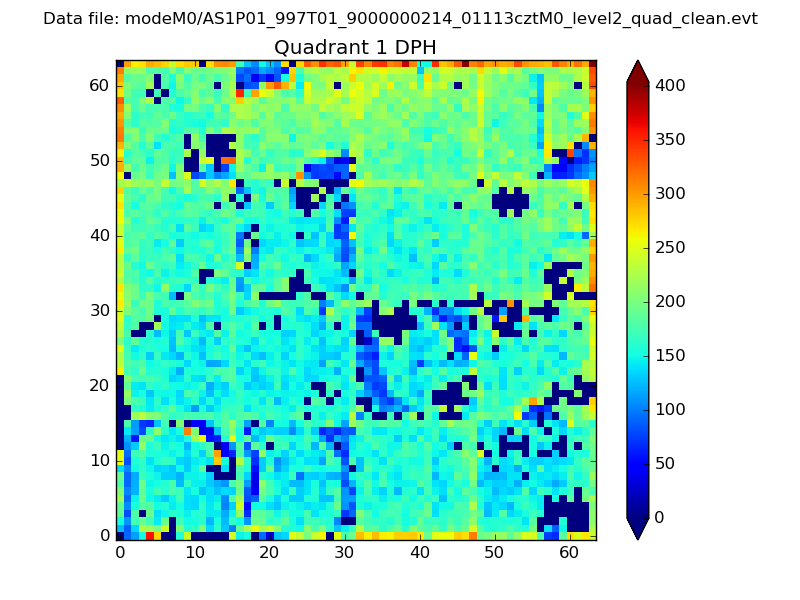 |
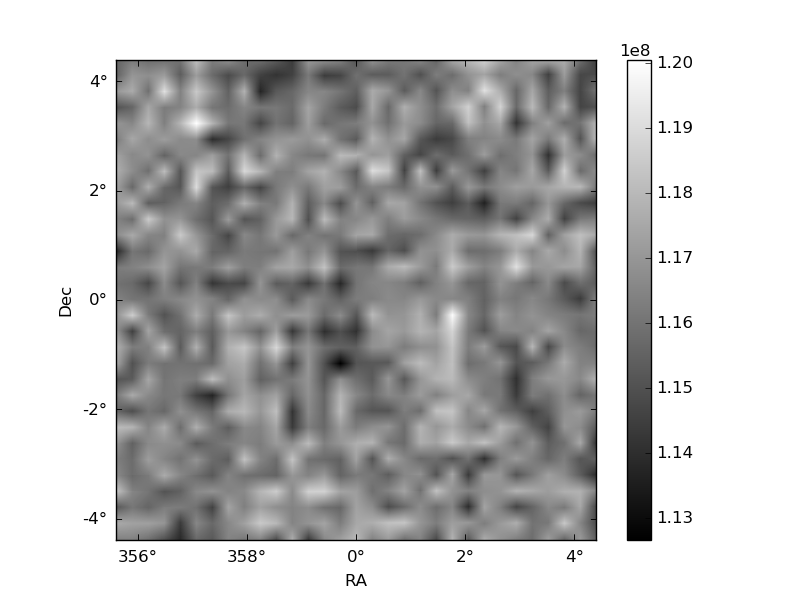
Quadrant B |
|---|---|---|---|
| Quadrant D | 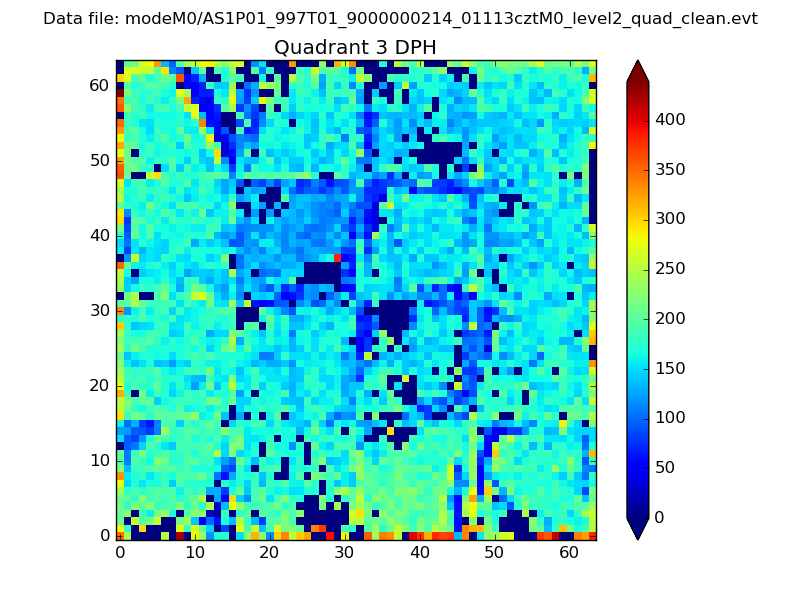 |
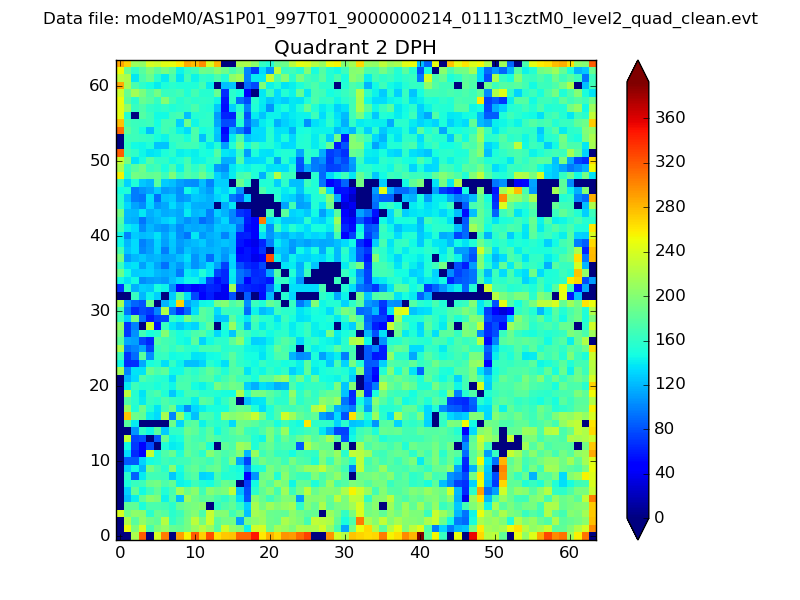 |
Quadrant C |
| Plot type | Count rate plots | Images |
|---|---|---|
| Comparison with Poisson distribution Blue bars denote a histogram of data divided into 1 sec bins. Red curve is a Poisson curve with rate = median count rate of data. |
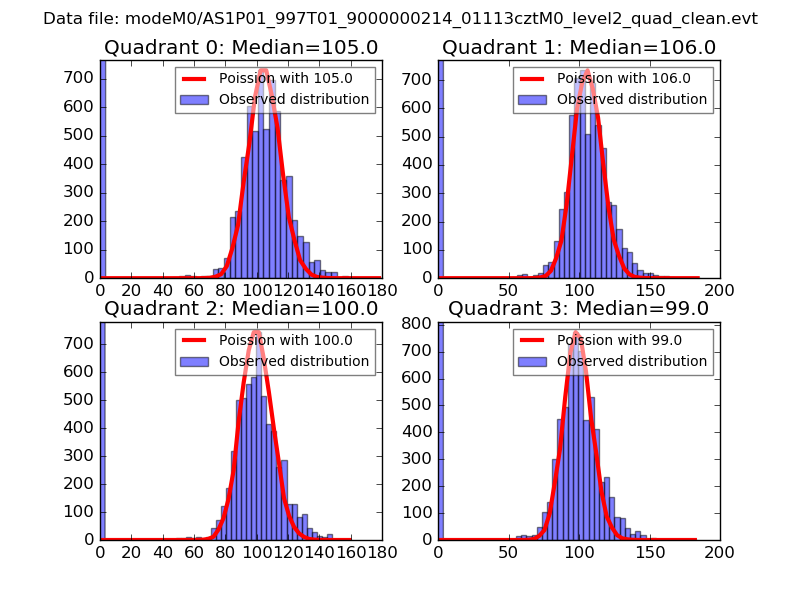 |
 |
| Quadrant-wise count rates Data is divided into 100 sec bins |
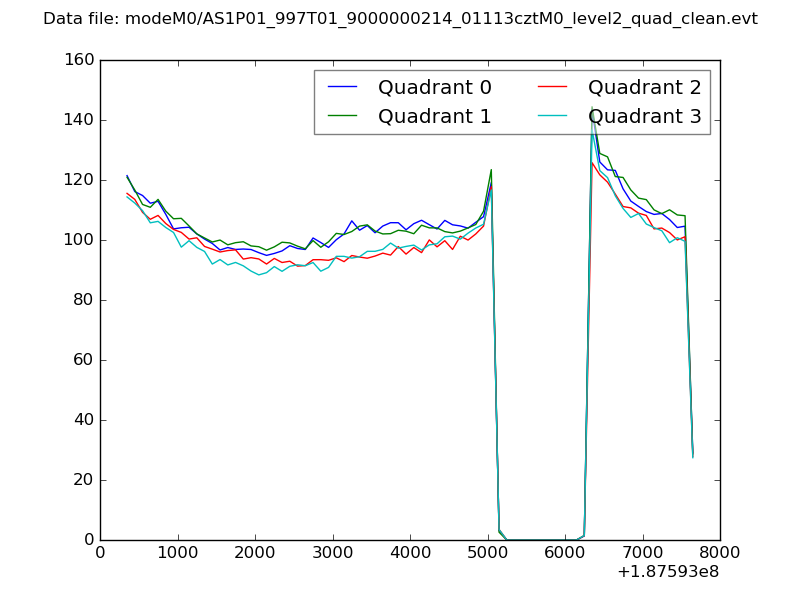 |
|
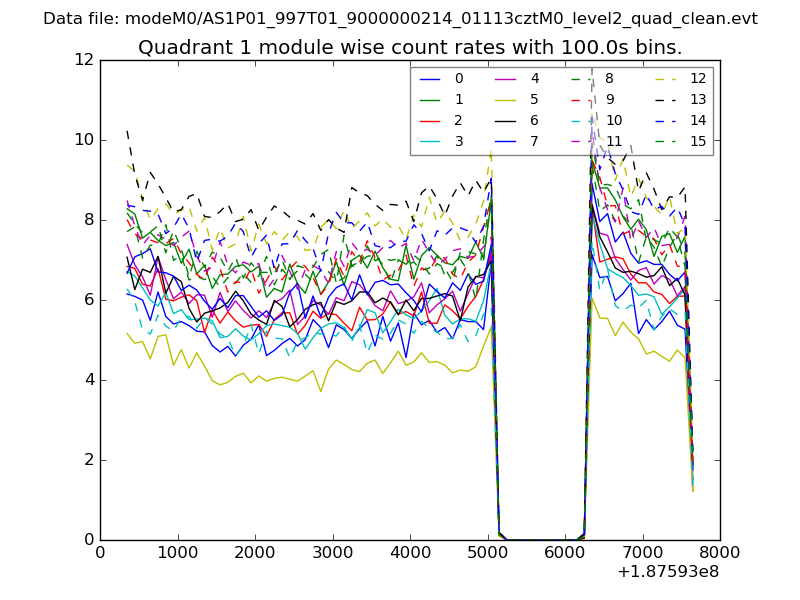
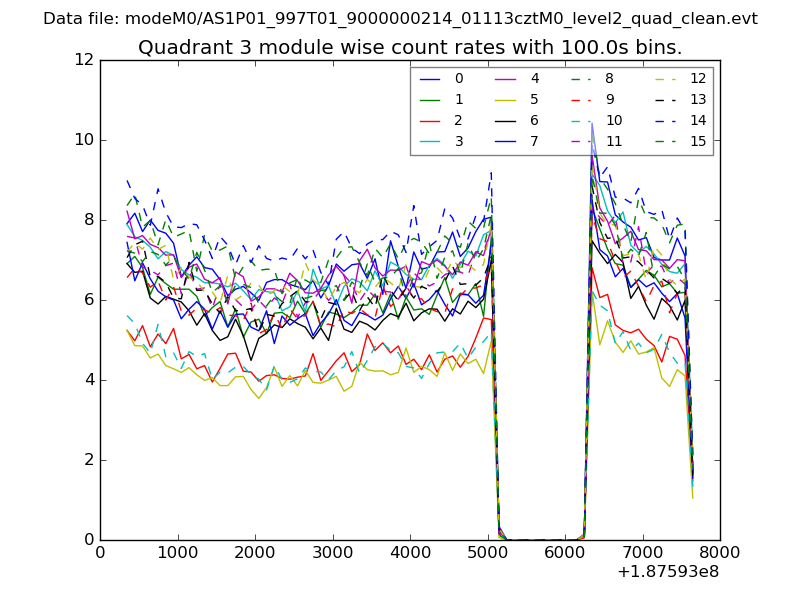
| Module-wise count rates for Quadrant A Data is divided into 100 sec bins |
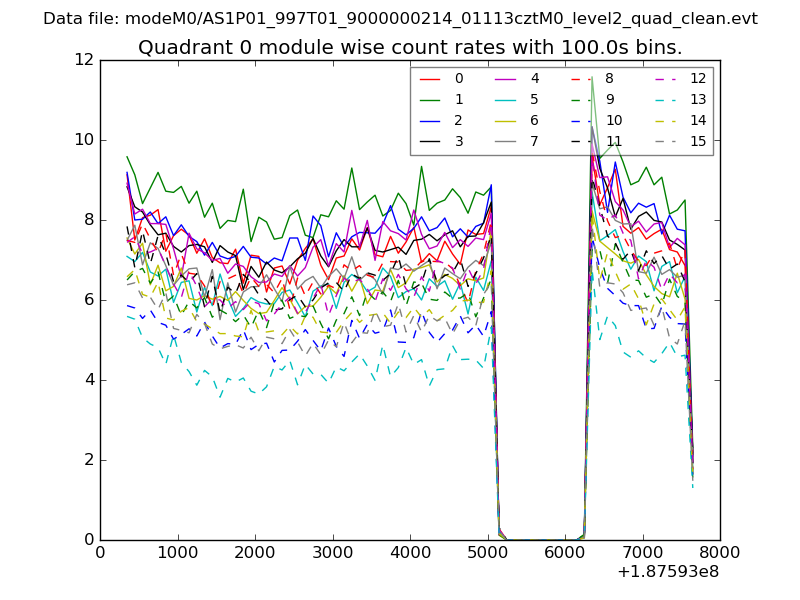 |
 |
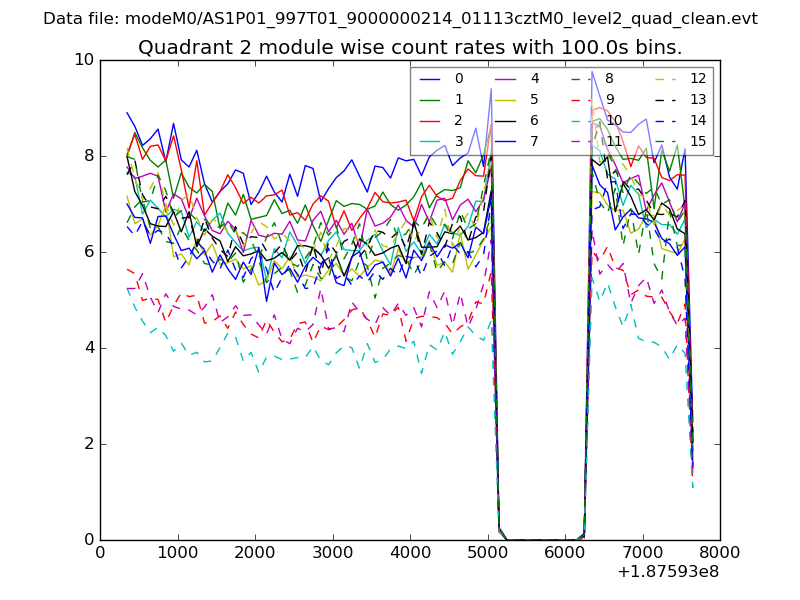
| Module-wise count rates for Quadrant B Data is divided into 100 sec bins |
 |
 |
| Module-wise count rates for Quadrant C Data is divided into 100 sec bins |
 |
 |
| Module-wise count rates for Quadrant D Data is divided into 100 sec bins |
 |
 |
| Parameter | Plot |
|---|---|
| CZT HV Monitor | 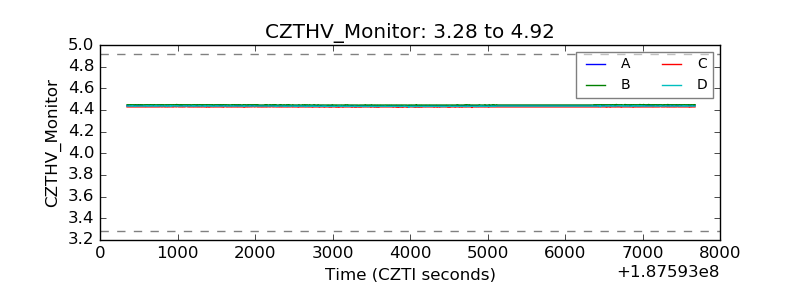 |
| D_VDD | 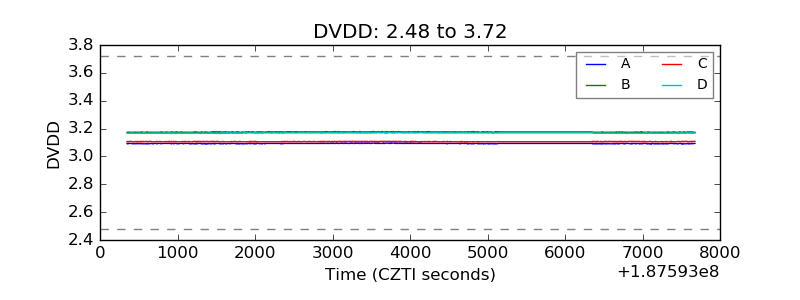 |
| Temperature 1 | 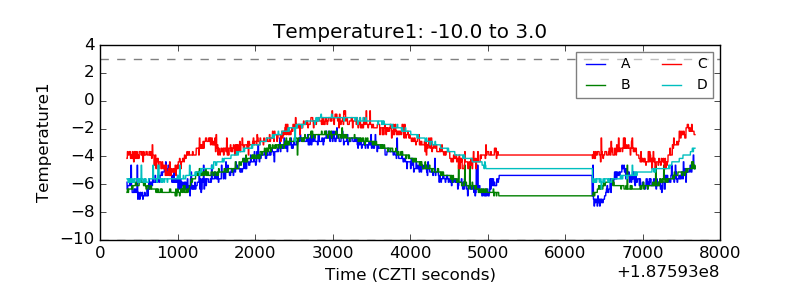 |
| Veto HV Monitor | 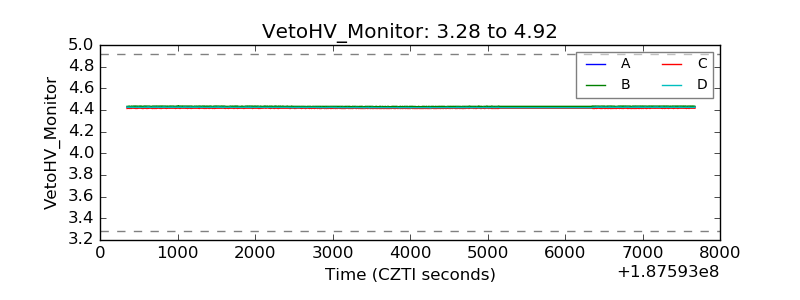 |
| Veto LLD | 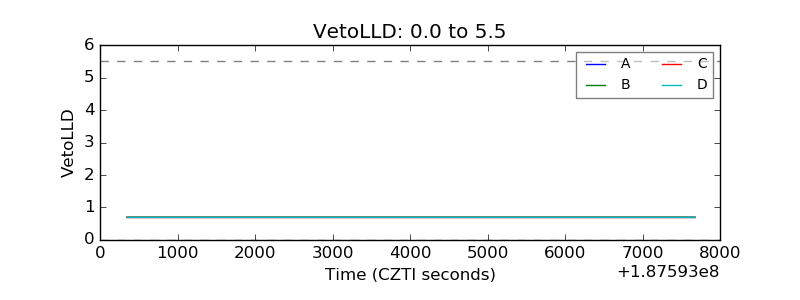 |
| Alpha Counter | 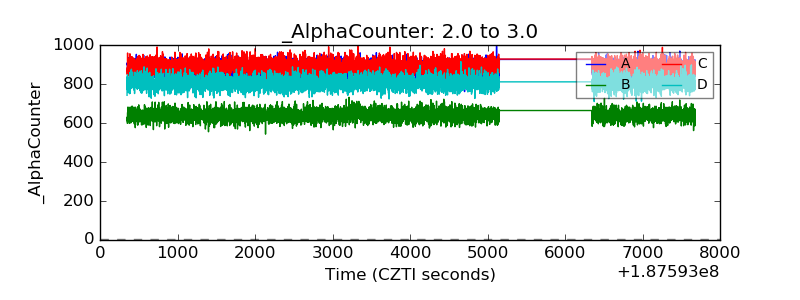 |
| _CPM_Rate | 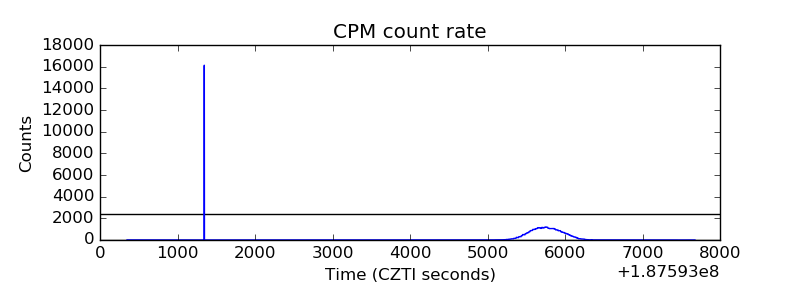 |
| CZT Counter | 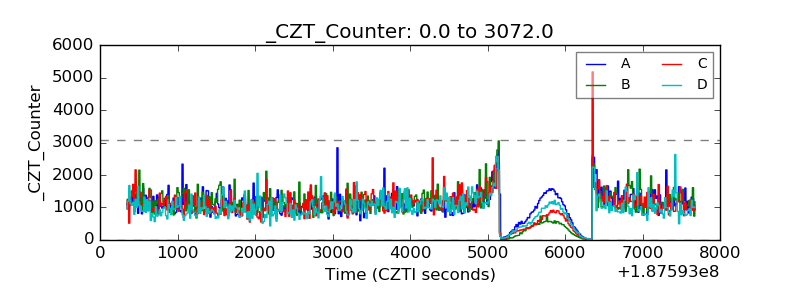 |
| +2.5 Volts monitor |  |
| +5 Volts monitor |  |
| _ROLL_ROT | 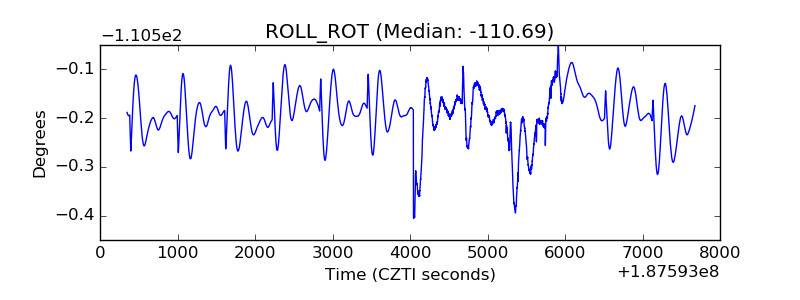 |
| _Roll_DEC | 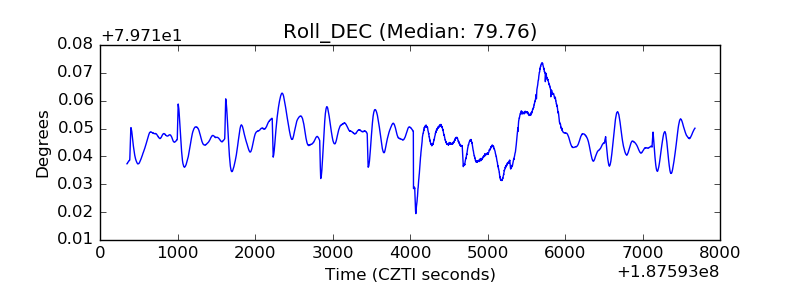 |
| _Roll_RA | 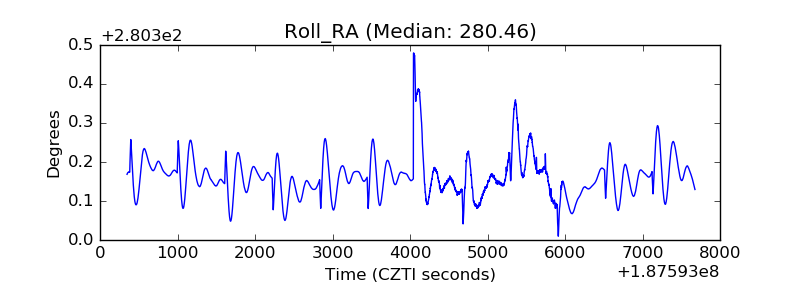 |
| Veto Counter | 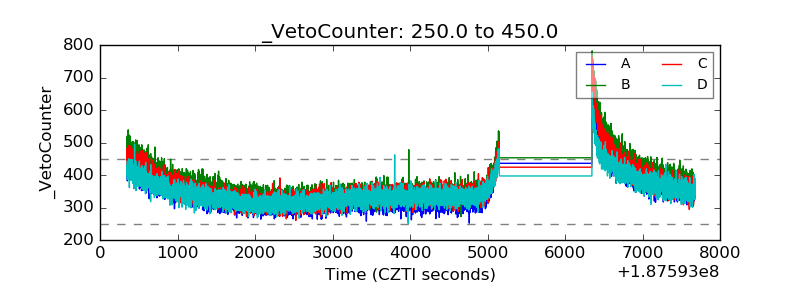 |