| Param | Original file | Final file |
|---|---|---|
| Filename | modeM0/AS1P01_997T01_9000000214_01116cztM0_level2.evt | modeM0/AS1P01_997T01_9000000214_01116cztM0_level2_quad_clean.evt |
| Size (bytes) | 1,015,666,560 | 99,057,600 |
| Size | 968.6 MB | 94.5 MB |
| Events in quadrant A | 7,704,983 | 652,144 |
| Events in quadrant B | 7,850,454 | 649,398 |
| Events in quadrant C | 7,585,652 | 625,673 |
| Events in quadrant D | 7,189,716 | 622,111 |
| Mode M9 | |||
|---|---|---|---|
| Quadrant | BADHDUFLAG | Total packets | Discarded packets |
| A | 0 | 10 | 0 |
| B | 0 | 10 | 0 |
| C | 0 | 10 | 0 |
| D | 0 | 10 | 0 |
| Mode M0 | |||
|---|---|---|---|
| Quadrant | BADHDUFLAG | Total packets | Discarded packets |
| A | 0 | 27447 | 2 |
| B | 0 | 27892 | 1 |
| C | 0 | 27102 | 1 |
| D | 0 | 25976 | 1 |
| Mode SS | |||
|---|---|---|---|
| Quadrant | BADHDUFLAG | Total packets | Discarded packets |
| A | 0 | 130 | 0 |
| B | 0 | 130 | 0 |
| C | 0 | 130 | 0 |
| D | 0 | 130 | 0 |
| Quadrant | Total seconds | Saturated seconds | Saturation percentage |
|---|---|---|---|
| A | 6463 | 11 | 0.170200% |
| B | 6463 | 7 | 0.108309% |
| C | 6463 | 2 | 0.030945% |
| D | 6463 | 52 | 0.804580% |
Noise dominated data is calculated using 1-second bins in cleaned event files. If a bin has >2000 counts, and if more than 50% of those come from <1% of pixels, then it is considered to be noise-dominated and hence unusable.
| Quadrant | # 1 sec bins | Bins with >0 counts | Bins with >2000 counts | High rate bins dominated by noise | Noise dominated (total time) | Noise dominated (detector-on time) | Marked lightcurve |
|---|---|---|---|---|---|---|---|
| A | 7463 | 6464 | 200 | 200 | 2.68% | 3.09% | 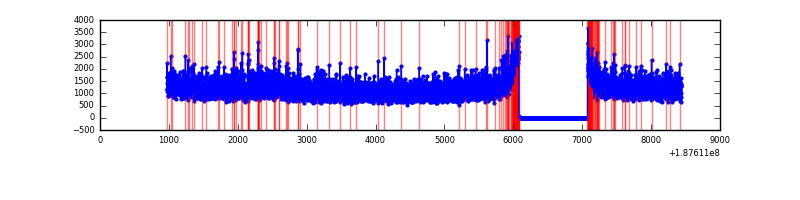 |
| B | 7463 | 6464 | 190 | 190 | 2.55% | 2.94% | 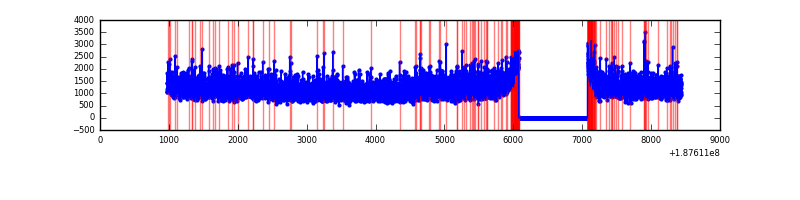 |
| C | 7463 | 6464 | 120 | 120 | 1.61% | 1.86% | 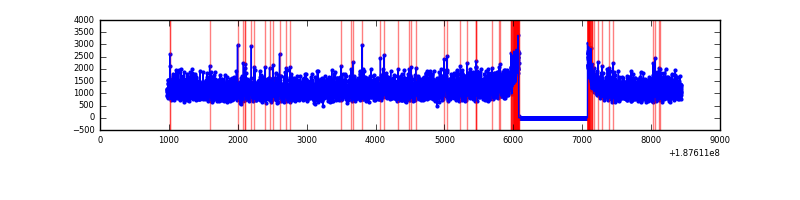 |
| D | 7463 | 6464 | 193 | 193 | 2.59% | 2.99% | 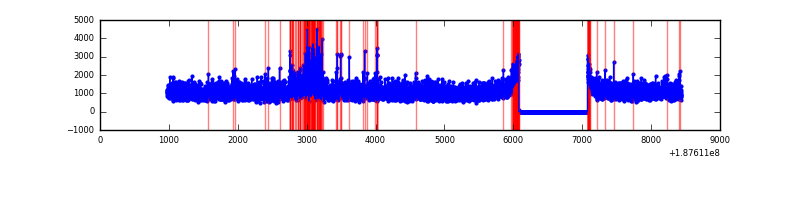 |
Top three noisy pixels from each quadrant. If the there are fewer than three noisy pixels in the level2.evt file, extra rows are filled as -1
| Pixel properties | Quadrant properties | ||||||
|---|---|---|---|---|---|---|---|
| Quadrant | DetID | PixID | Counts | Sigma | Mean | Median | Sigma |
| A | 4 | 32 | 44746 | 90.02 | 1980 | 1993 | 474.9 |
| A | 12 | 243 | 41910 | 84.05 | 1980 | 1993 | 474.9 |
| A | 0 | 253 | 15646 | 28.75 | 1980 | 1993 | 474.9 |
| B | 2 | 32 | 47645 | 96.25 | 2019 | 2026 | 474.0 |
| B | 15 | 22 | 42526 | 85.45 | 2019 | 2026 | 474.0 |
| B | 5 | 249 | 36925 | 73.63 | 2019 | 2026 | 474.0 |
| C | 15 | 241 | 349687 | 685.42 | 1829 | 1891 | 507.4 |
| C | 3 | 79 | 27208 | 49.89 | 1829 | 1891 | 507.4 |
| C | 3 | 111 | 25654 | 46.83 | 1829 | 1891 | 507.4 |
| D | 10 | 125 | 111681 | 208.13 | 1857 | 1890 | 527.5 |
| D | 2 | 16 | 56783 | 104.06 | 1857 | 1890 | 527.5 |
| D | 13 | 73 | 26160 | 46.01 | 1857 | 1890 | 527.5 |
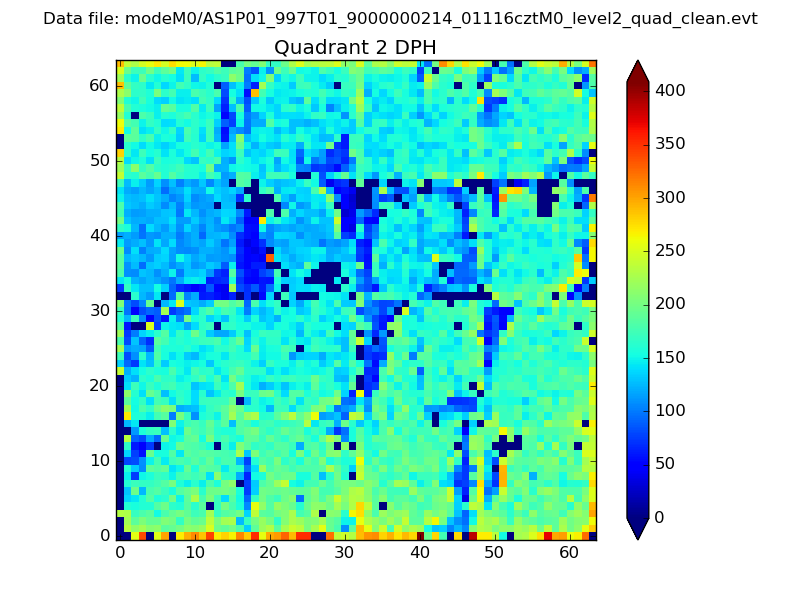
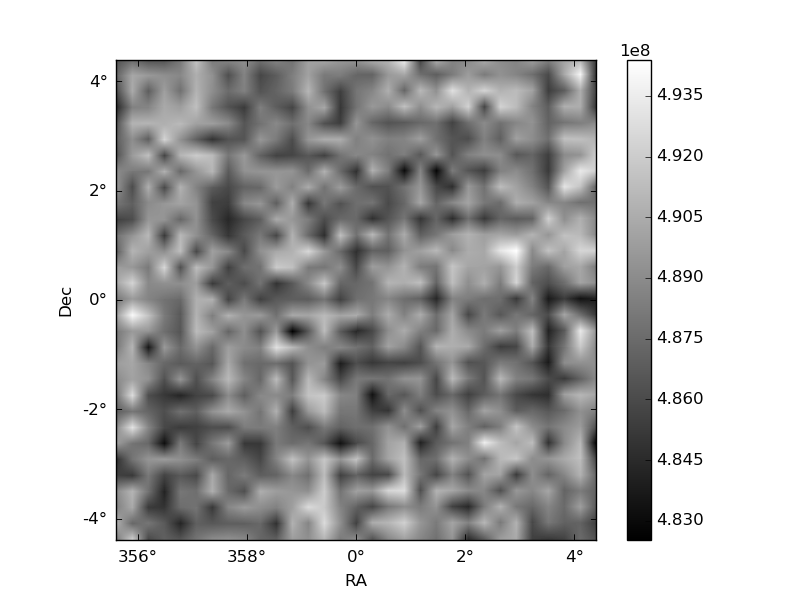
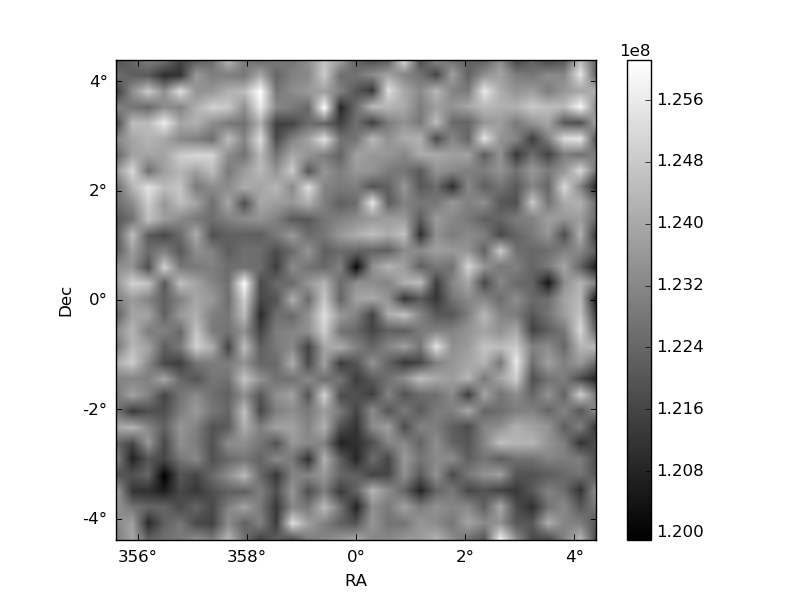
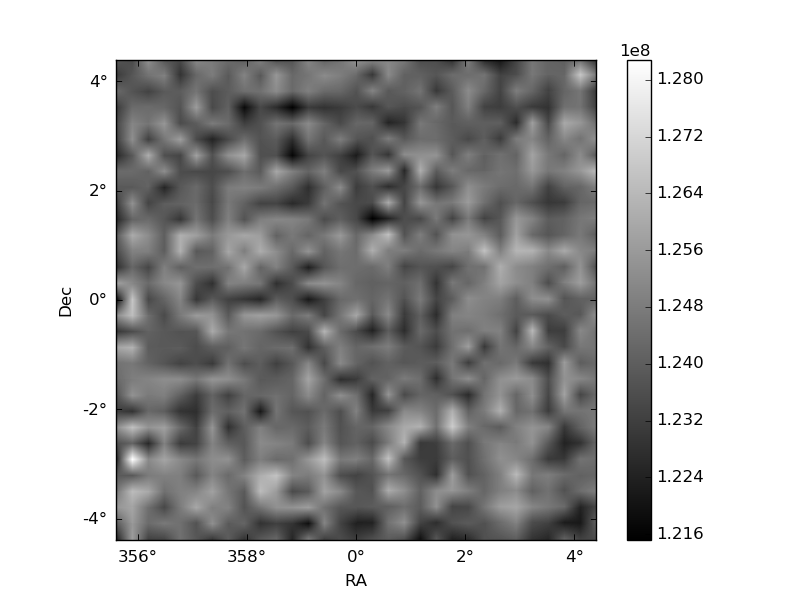
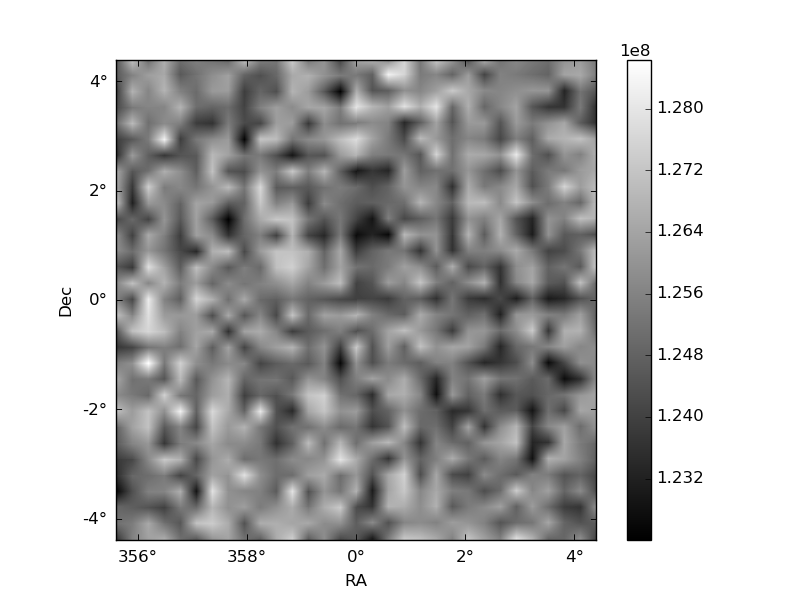
Histogram calculated using DETX and DETY for each event in the final _common_clean file
| Quadrant A | 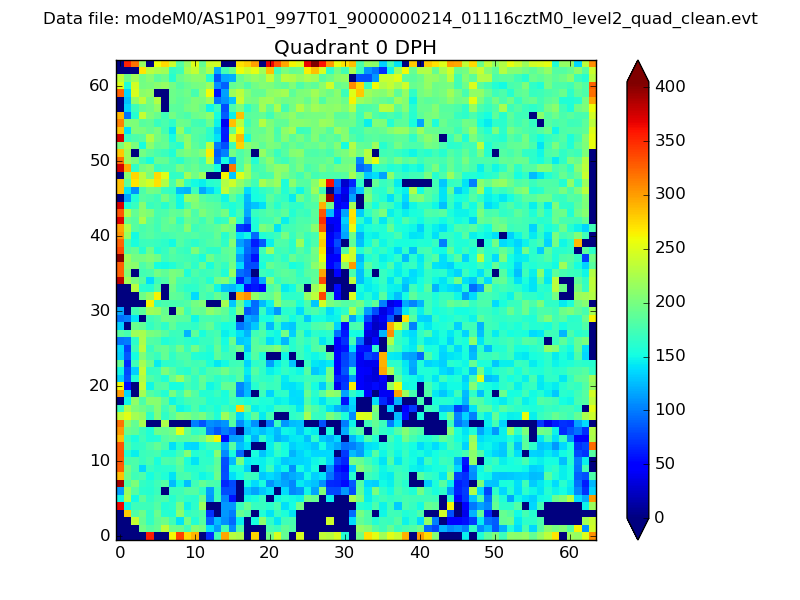 |
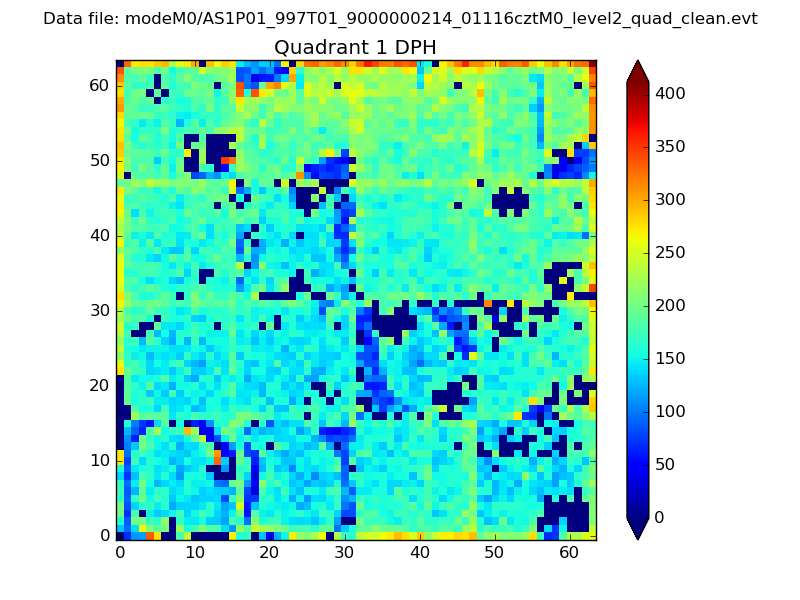 |
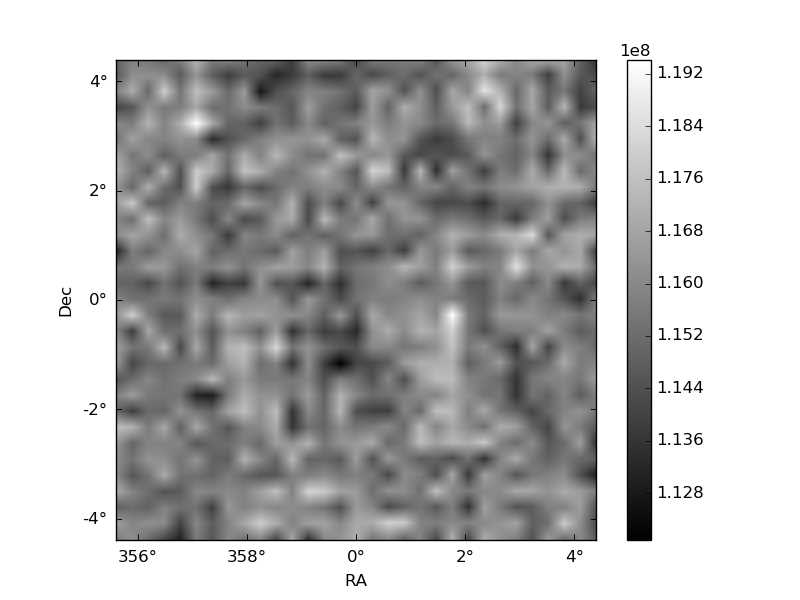
Quadrant B |
|---|---|---|---|
| Quadrant D | 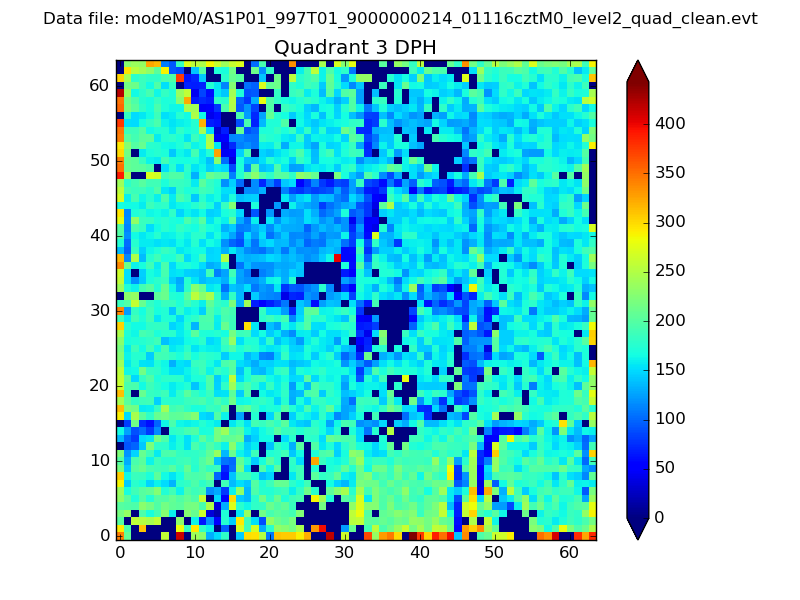 |
 |
Quadrant C |
| Plot type | Count rate plots | Images |
|---|---|---|
| Comparison with Poisson distribution Blue bars denote a histogram of data divided into 1 sec bins. Red curve is a Poisson curve with rate = median count rate of data. |
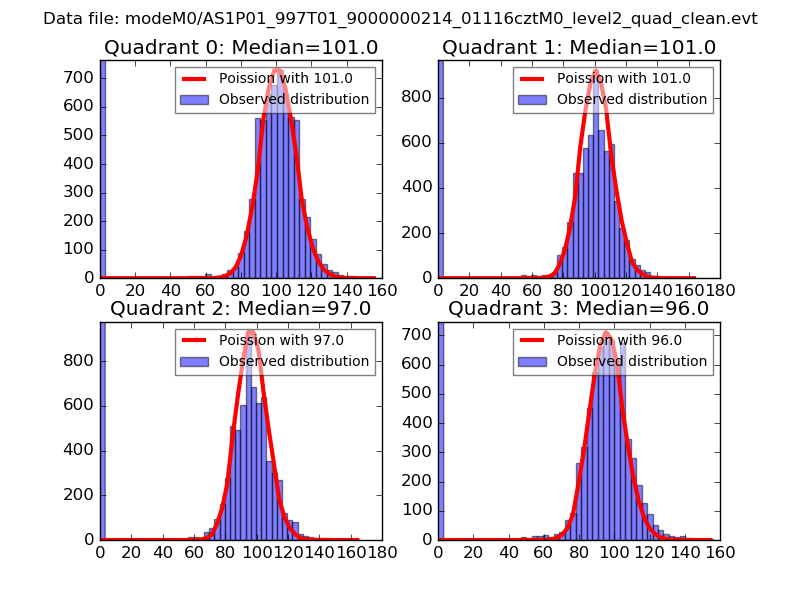 |
 |
| Quadrant-wise count rates Data is divided into 100 sec bins |
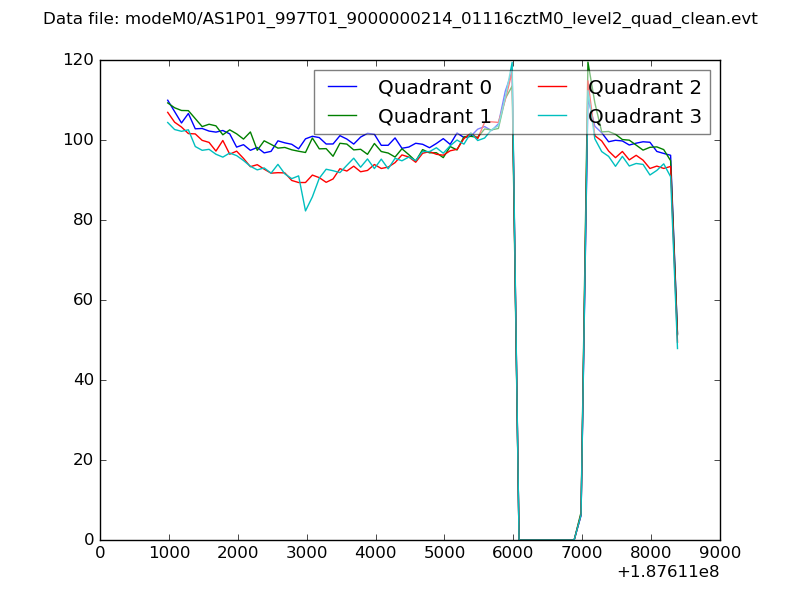 |
|
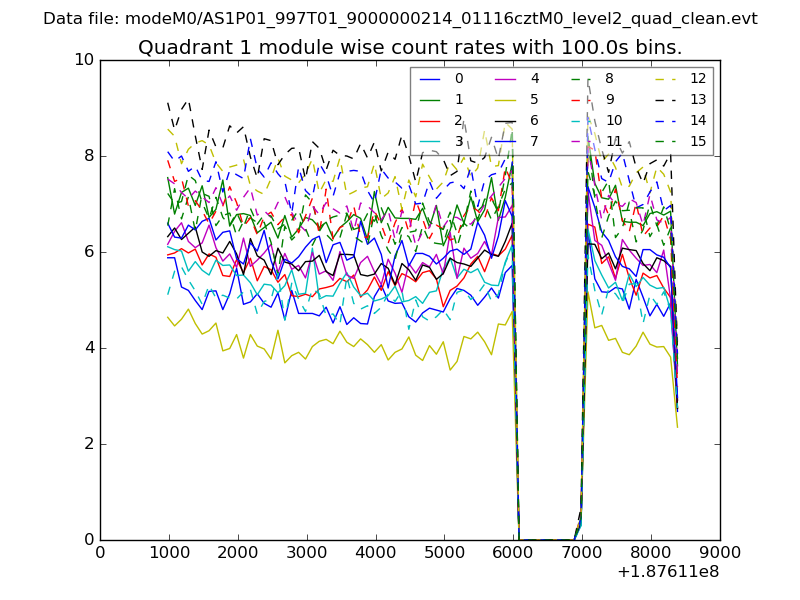
| Module-wise count rates for Quadrant A Data is divided into 100 sec bins |
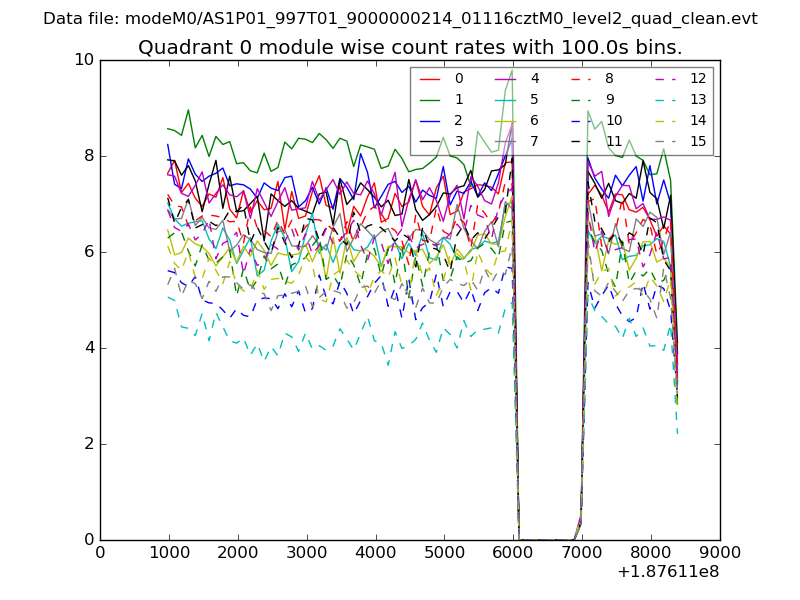 |
 |
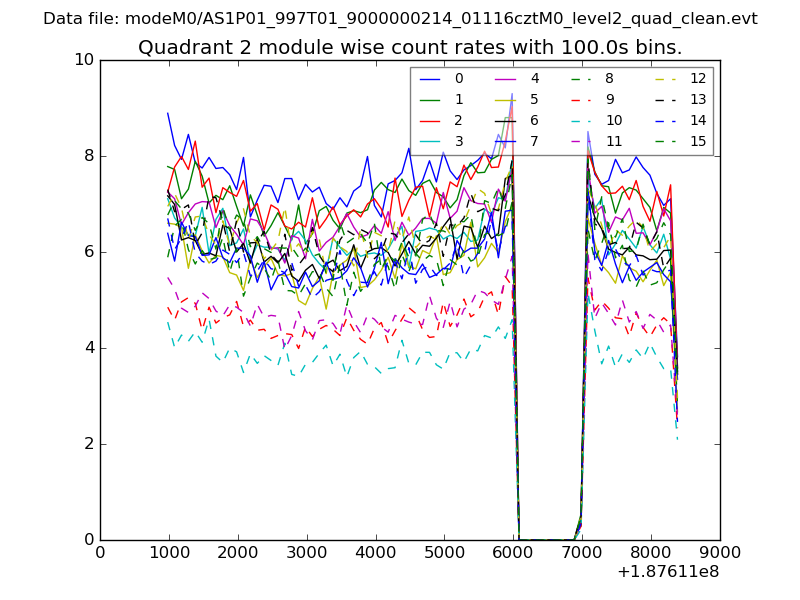
| Module-wise count rates for Quadrant B Data is divided into 100 sec bins |
 |
 |
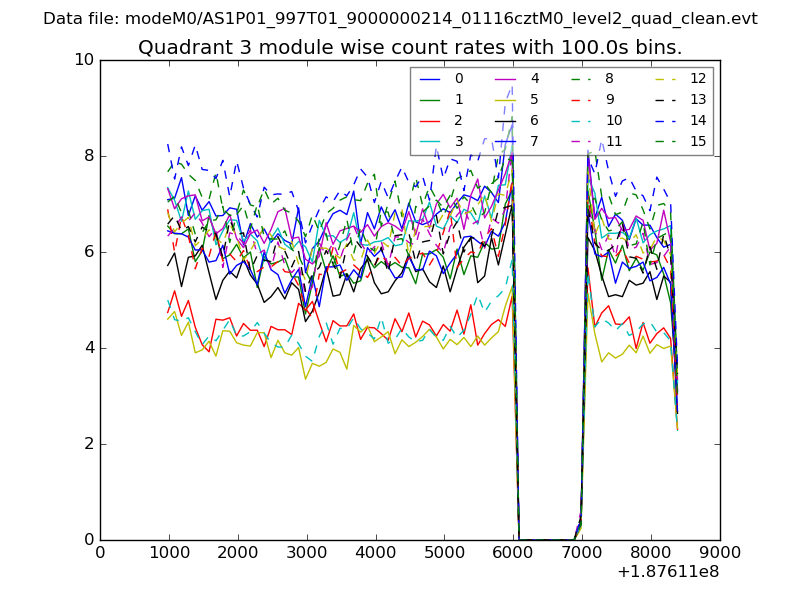
| Module-wise count rates for Quadrant C Data is divided into 100 sec bins |
 |
 |
| Module-wise count rates for Quadrant D Data is divided into 100 sec bins |
 |
 |
| Parameter | Plot |
|---|---|
| CZT HV Monitor | 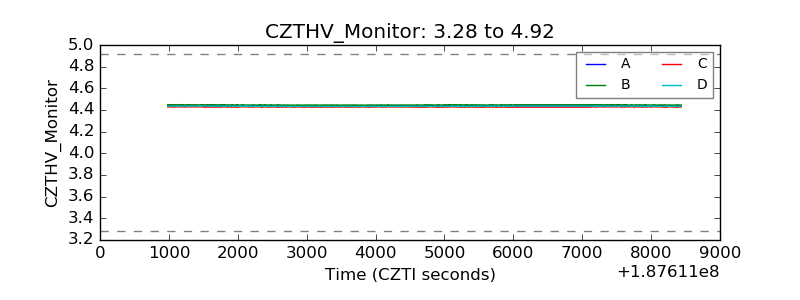 |
| D_VDD | 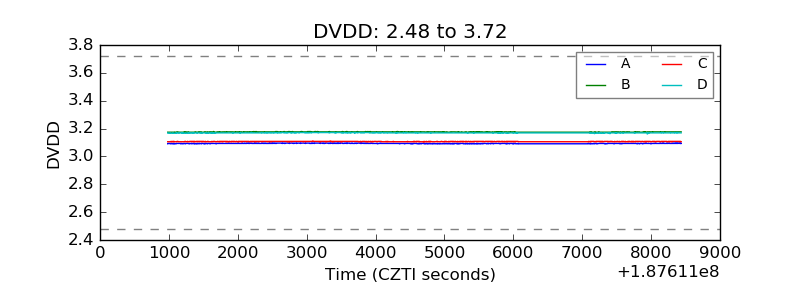 |
| Temperature 1 | 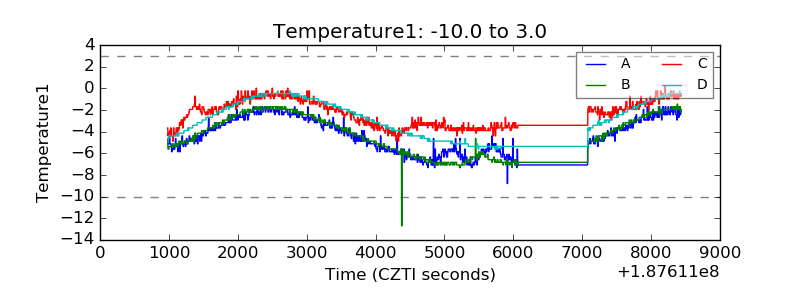 |
| Veto HV Monitor | 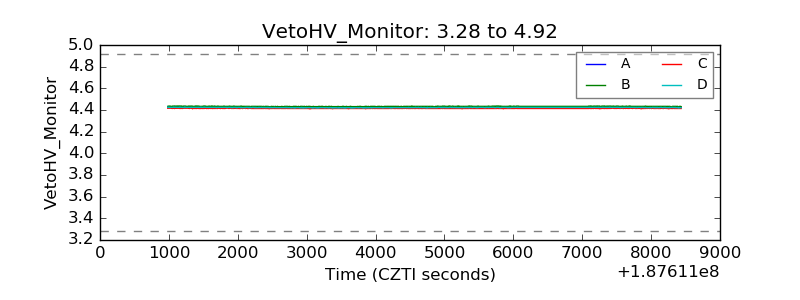 |
| Veto LLD | 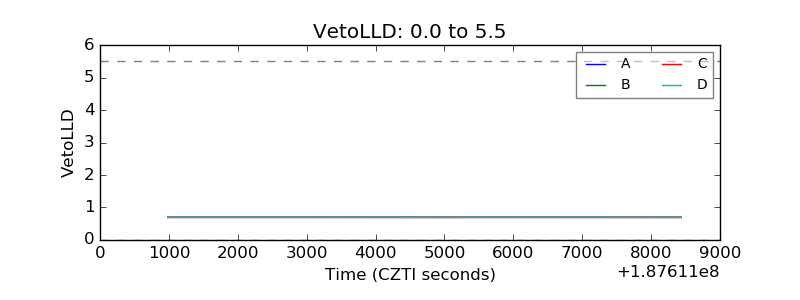 |
| Alpha Counter | 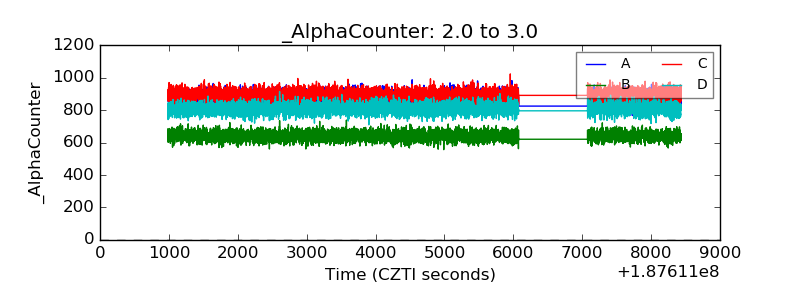 |
| _CPM_Rate | 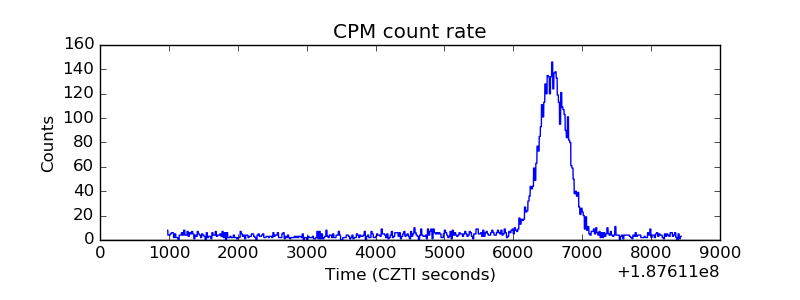 |
| CZT Counter | 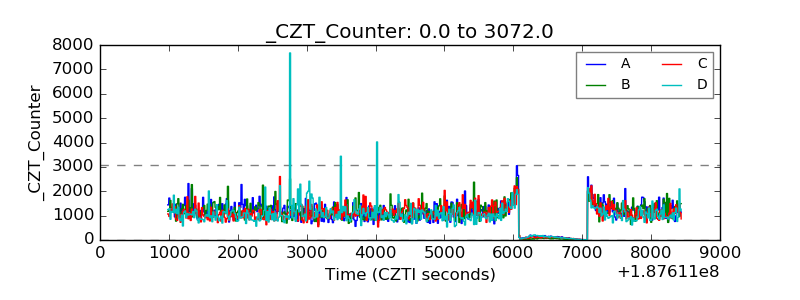 |
| +2.5 Volts monitor | 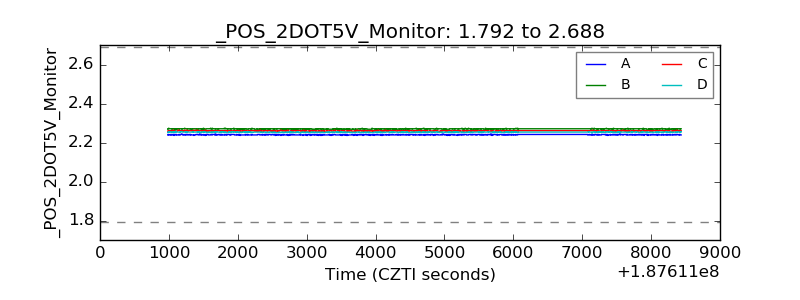 |
| +5 Volts monitor | 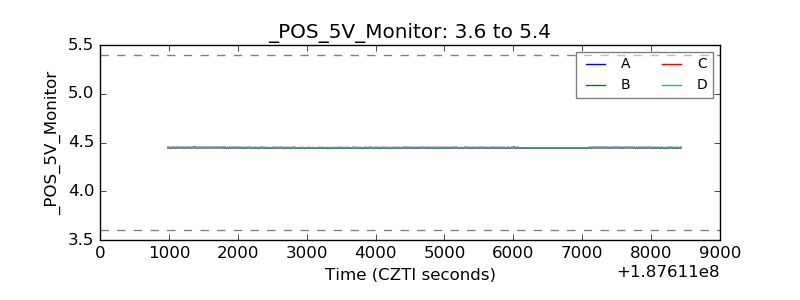 |
| _ROLL_ROT | 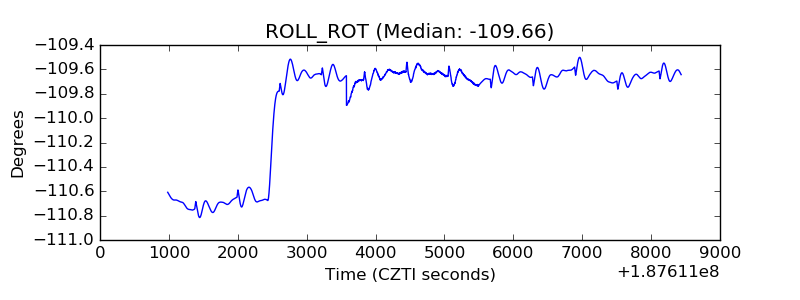 |
| _Roll_DEC | 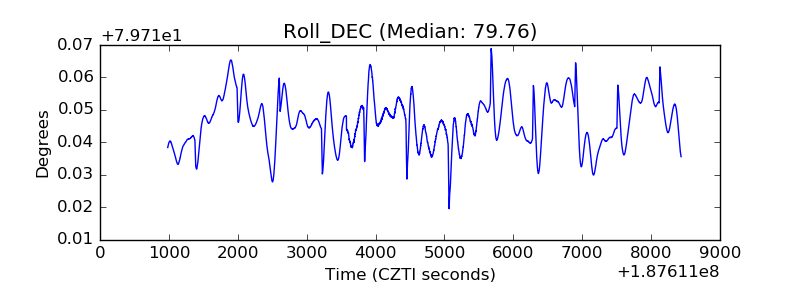 |
| _Roll_RA | 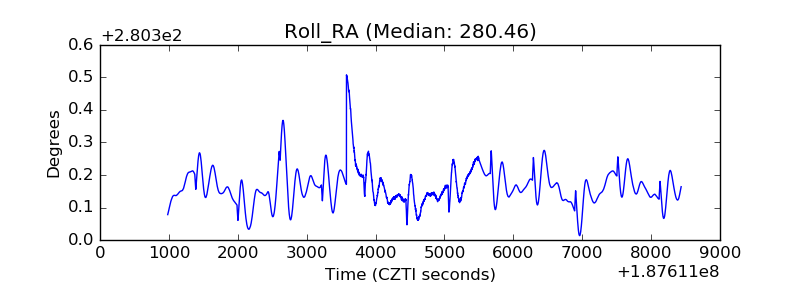 |
| Veto Counter | 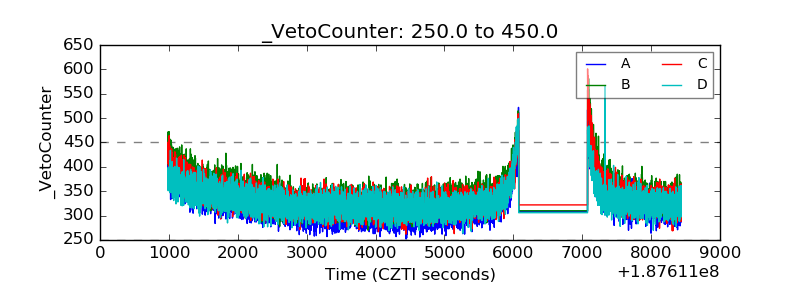 |