| Param | Original file | Final file |
|---|---|---|
| Filename | modeM0/AS1P01_997T01_9000000214_01117cztM0_level2.evt | modeM0/AS1P01_997T01_9000000214_01117cztM0_level2_quad_clean.evt |
| Size (bytes) | 1,076,558,400 | 100,601,280 |
| Size | 1.0 GB | 95.9 MB |
| Events in quadrant A | 7,890,321 | 662,677 |
| Events in quadrant B | 8,466,432 | 655,603 |
| Events in quadrant C | 8,162,898 | 630,552 |
| Events in quadrant D | 7,640,845 | 631,823 |
| Mode M9 | |||
|---|---|---|---|
| Quadrant | BADHDUFLAG | Total packets | Discarded packets |
| A | 0 | 6 | 0 |
| B | 0 | 6 | 0 |
| C | 0 | 6 | 0 |
| D | 0 | 6 | 0 |
| Mode M0 | |||
|---|---|---|---|
| Quadrant | BADHDUFLAG | Total packets | Discarded packets |
| A | 0 | 28207 | 2 |
| B | 0 | 29920 | 1 |
| C | 0 | 29037 | 1 |
| D | 0 | 27500 | 1 |
| Mode SS | |||
|---|---|---|---|
| Quadrant | BADHDUFLAG | Total packets | Discarded packets |
| A | 0 | 136 | 0 |
| B | 0 | 136 | 0 |
| C | 0 | 136 | 0 |
| D | 0 | 136 | 0 |
| Quadrant | Total seconds | Saturated seconds | Saturation percentage |
|---|---|---|---|
| A | 6682 | 55 | 0.823107% |
| B | 6682 | 32 | 0.478899% |
| C | 6682 | 87 | 1.302005% |
| D | 6682 | 128 | 1.915594% |
Noise dominated data is calculated using 1-second bins in cleaned event files. If a bin has >2000 counts, and if more than 50% of those come from <1% of pixels, then it is considered to be noise-dominated and hence unusable.
| Quadrant | # 1 sec bins | Bins with >0 counts | Bins with >2000 counts | High rate bins dominated by noise | Noise dominated (total time) | Noise dominated (detector-on time) | Marked lightcurve |
|---|---|---|---|---|---|---|---|
| A | 7287 | 6683 | 249 | 249 | 3.42% | 3.73% | 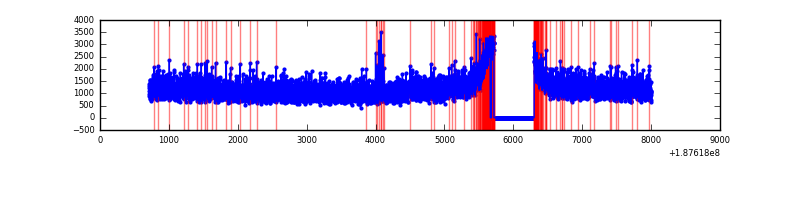 |
| B | 7287 | 6684 | 313 | 313 | 4.30% | 4.68% | 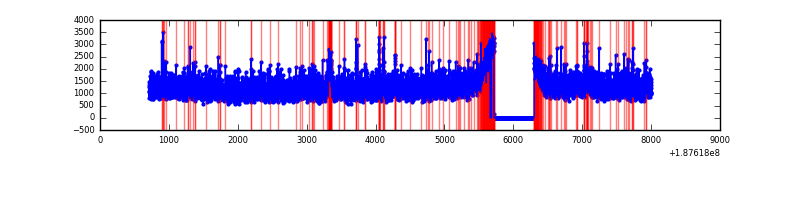 |
| C | 7287 | 6683 | 295 | 295 | 4.05% | 4.41% | 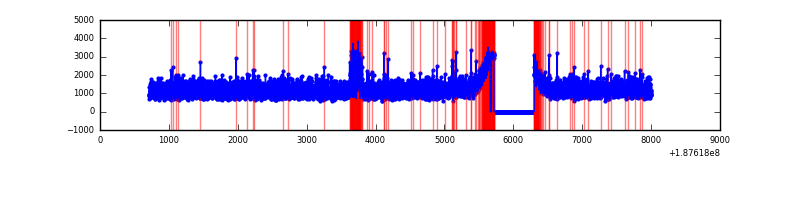 |
| D | 7287 | 6683 | 313 | 313 | 4.30% | 4.68% | 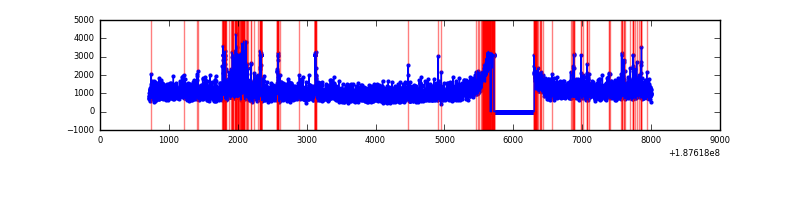 |
Top three noisy pixels from each quadrant. If the there are fewer than three noisy pixels in the level2.evt file, extra rows are filled as -1
| Pixel properties | Quadrant properties | ||||||
|---|---|---|---|---|---|---|---|
| Quadrant | DetID | PixID | Counts | Sigma | Mean | Median | Sigma |
| A | 12 | 243 | 23971 | 44.31 | 2045 | 2058 | 494.5 |
| A | 10 | 229 | 10545 | 17.16 | 2045 | 2058 | 494.5 |
| A | 0 | 253 | 8361 | 12.74 | 2045 | 2058 | 494.5 |
| B | 2 | 32 | 266866 | 533.13 | 2102 | 2109 | 496.6 |
| B | 5 | 249 | 53828 | 104.15 | 2102 | 2109 | 496.6 |
| B | 0 | 230 | 52553 | 101.58 | 2102 | 2109 | 496.6 |
| C | 15 | 241 | 332500 | 617.21 | 1933 | 2001 | 535.5 |
| C | 5 | 234 | 208884 | 386.36 | 1933 | 2001 | 535.5 |
| C | 3 | 79 | 28357 | 49.22 | 1933 | 2001 | 535.5 |
| D | 10 | 125 | 153832 | 273.64 | 1949 | 1981 | 554.9 |
| D | 2 | 16 | 80811 | 142.05 | 1949 | 1981 | 554.9 |
| D | 13 | 73 | 74949 | 131.49 | 1949 | 1981 | 554.9 |
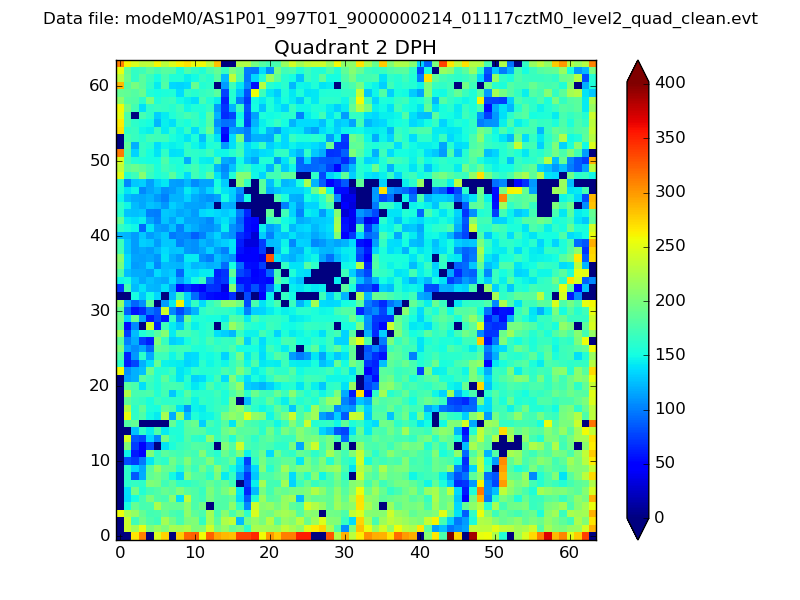
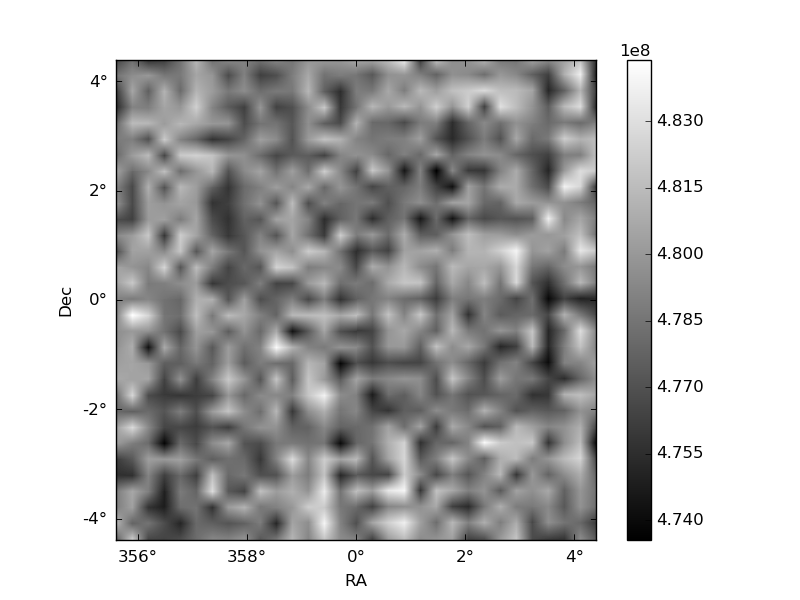
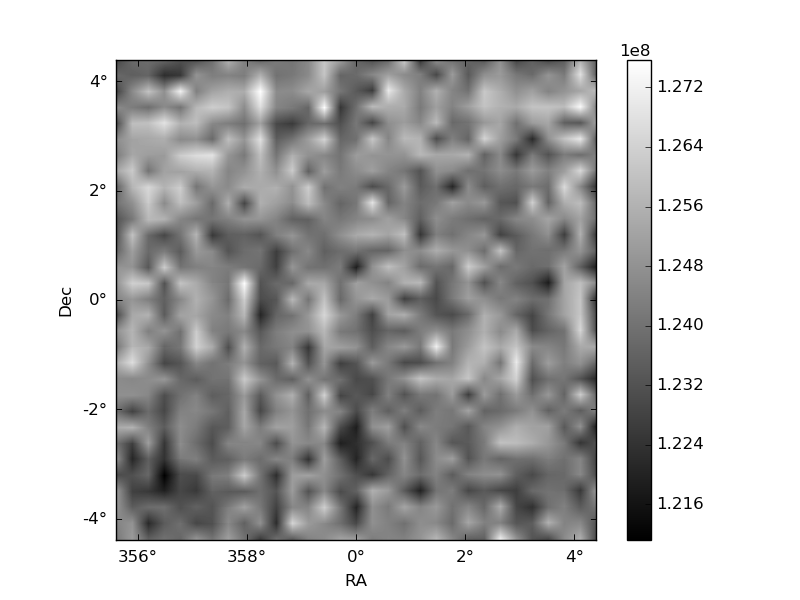
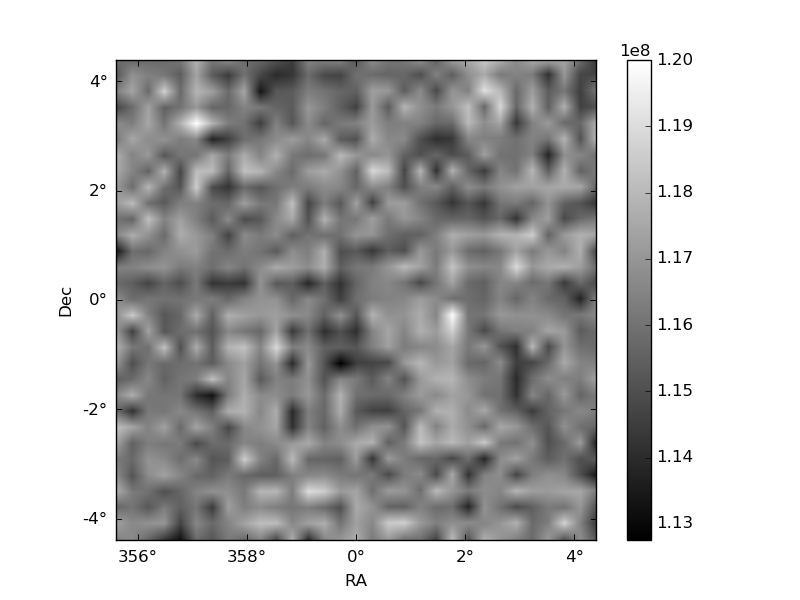
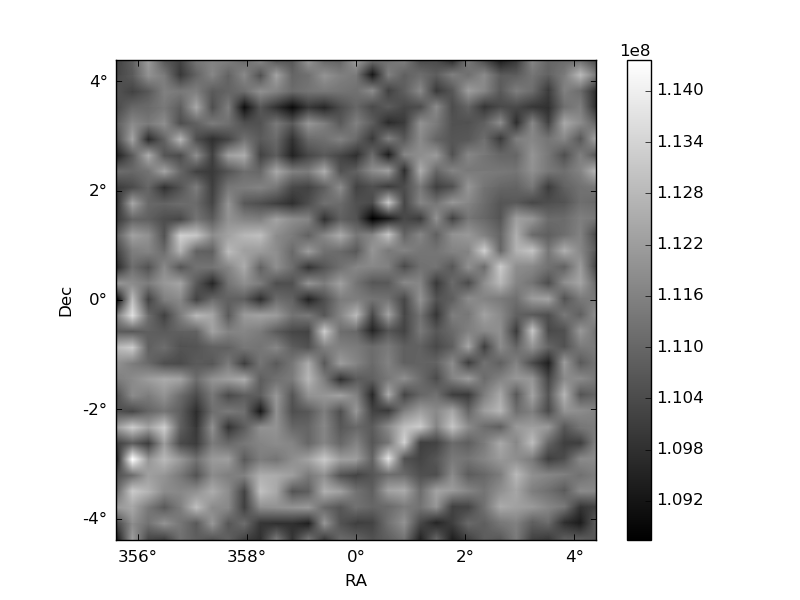
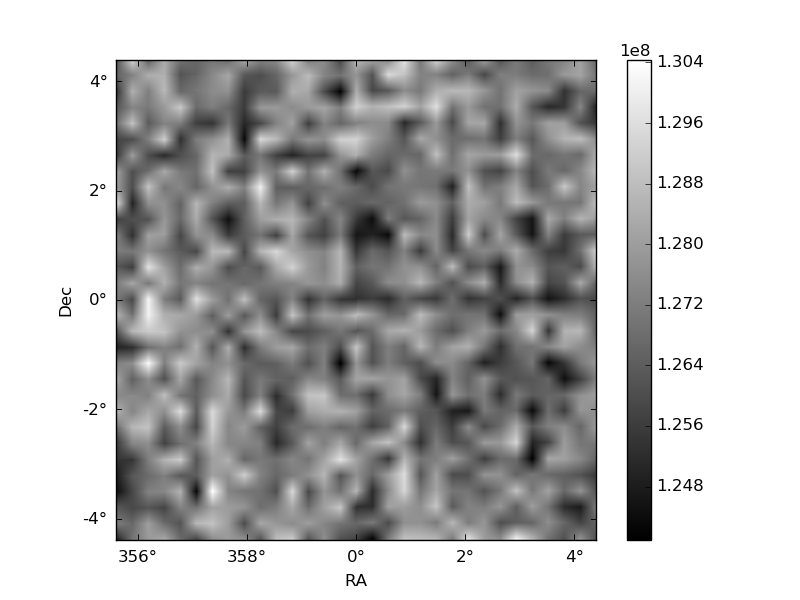
Histogram calculated using DETX and DETY for each event in the final _common_clean file
| Quadrant A | 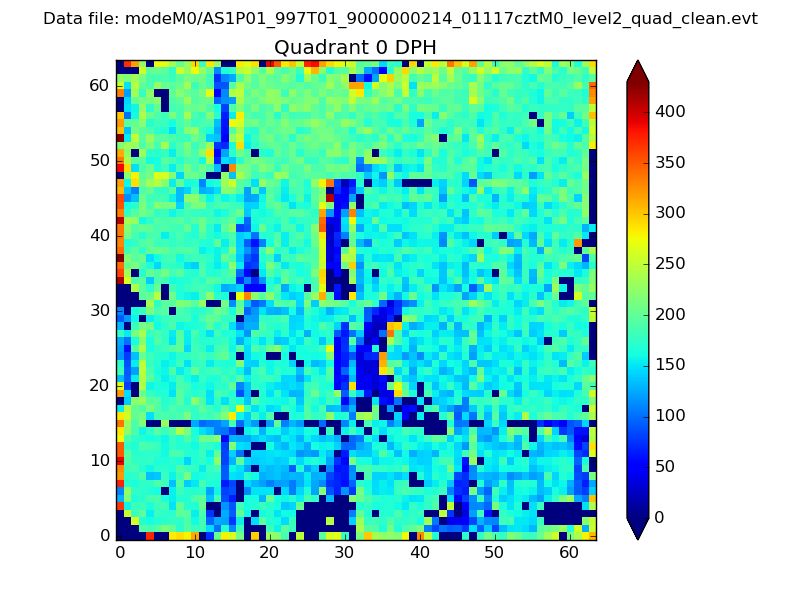 |
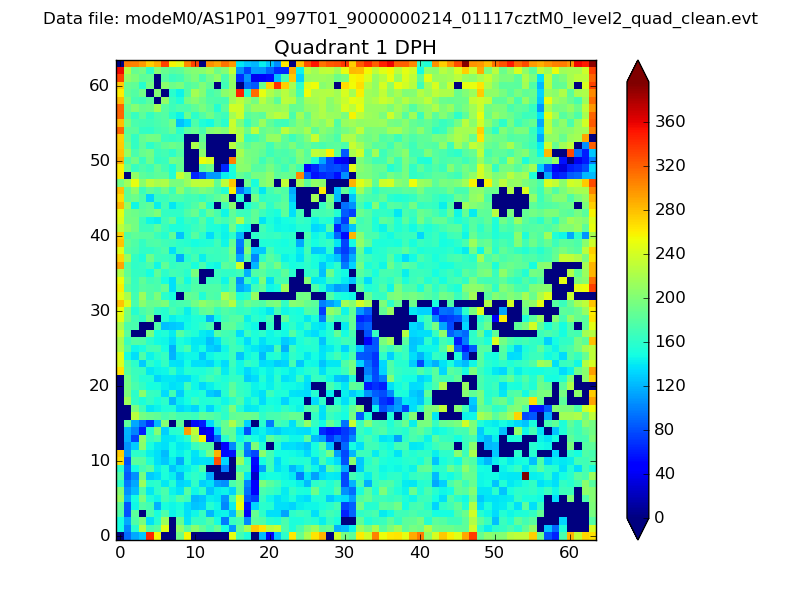 |
Quadrant B |
|---|---|---|---|
| Quadrant D | 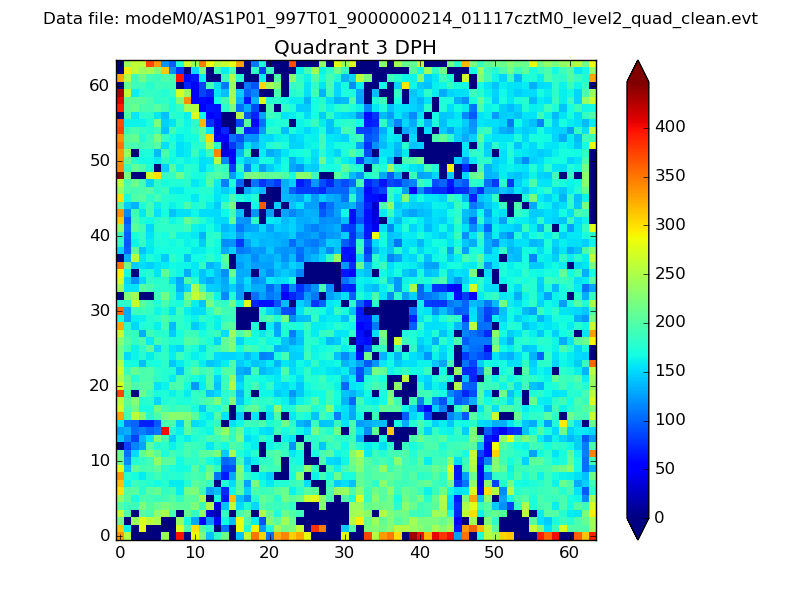 |
 |
Quadrant C |
| Plot type | Count rate plots | Images |
|---|---|---|
| Comparison with Poisson distribution Blue bars denote a histogram of data divided into 1 sec bins. Red curve is a Poisson curve with rate = median count rate of data. |
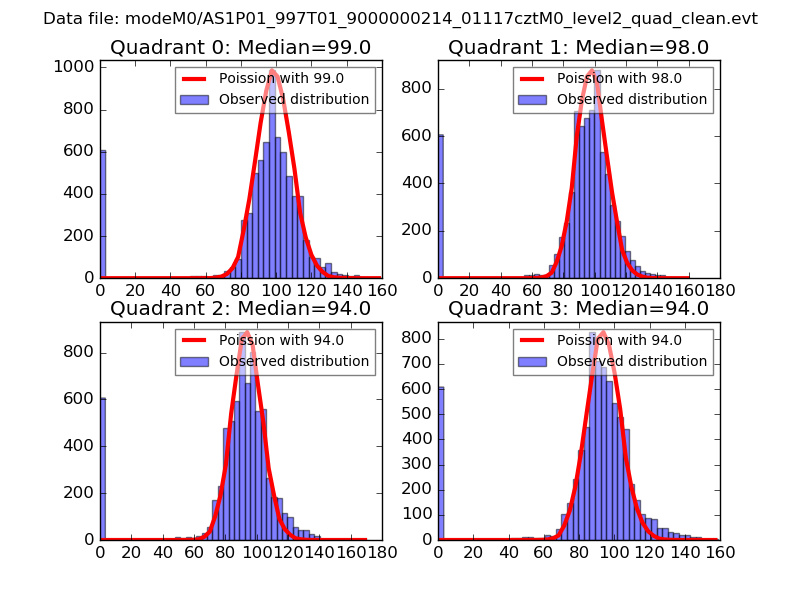 |
 |
| Quadrant-wise count rates Data is divided into 100 sec bins |
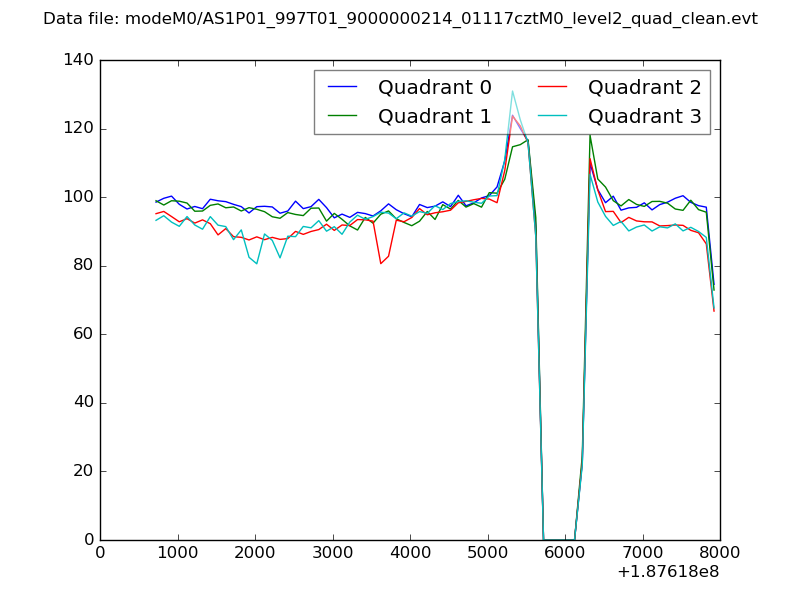 |
|
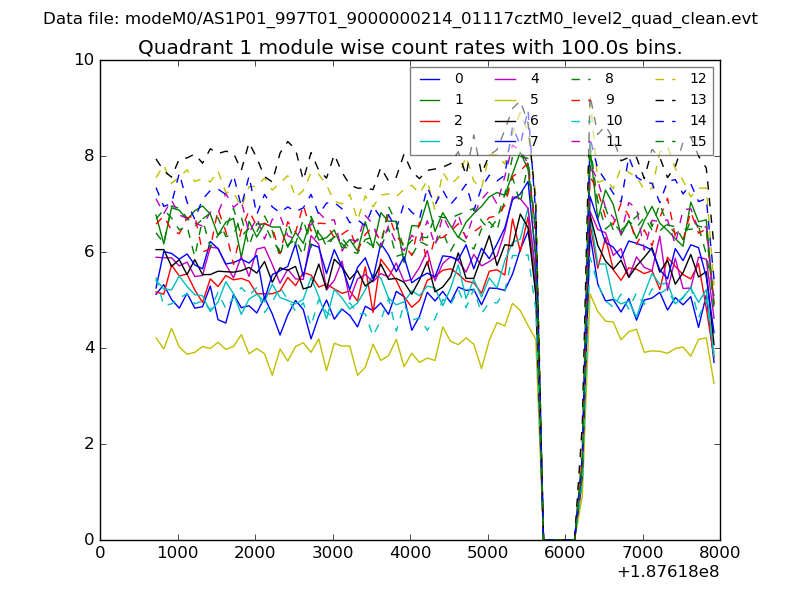
| Module-wise count rates for Quadrant A Data is divided into 100 sec bins |
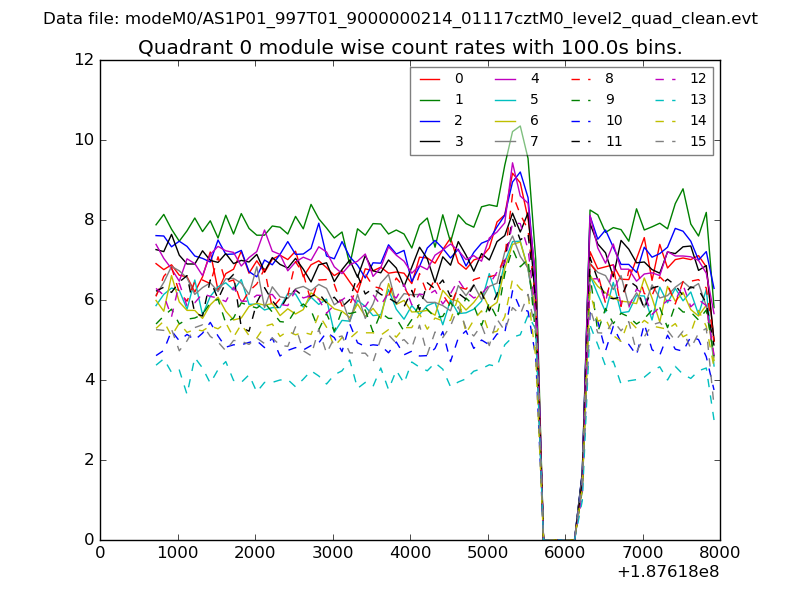 |
 |
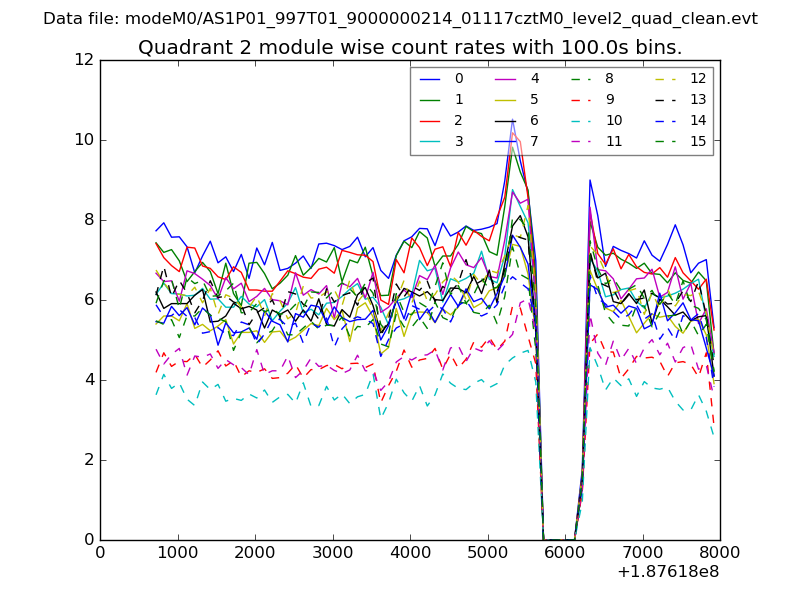
| Module-wise count rates for Quadrant B Data is divided into 100 sec bins |
 |
 |
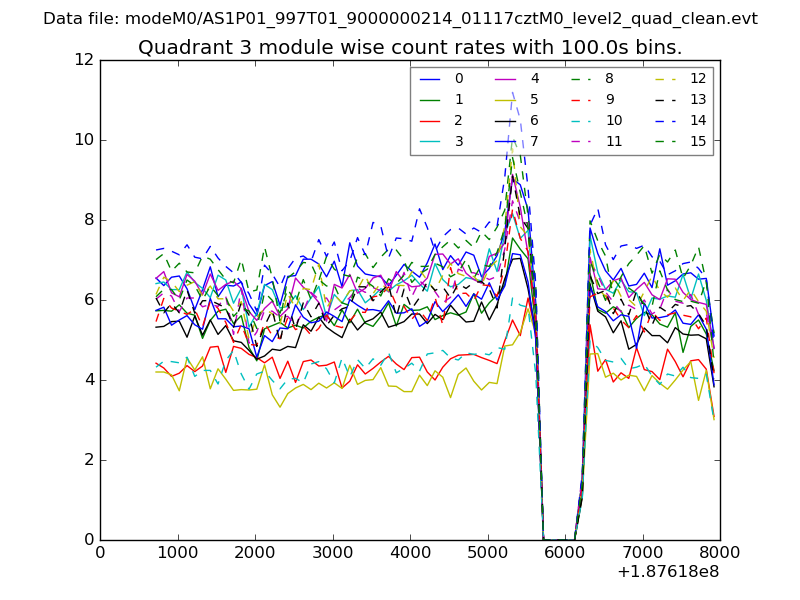
| Module-wise count rates for Quadrant C Data is divided into 100 sec bins |
 |
 |
| Module-wise count rates for Quadrant D Data is divided into 100 sec bins |
 |
 |
| Parameter | Plot |
|---|---|
| CZT HV Monitor | 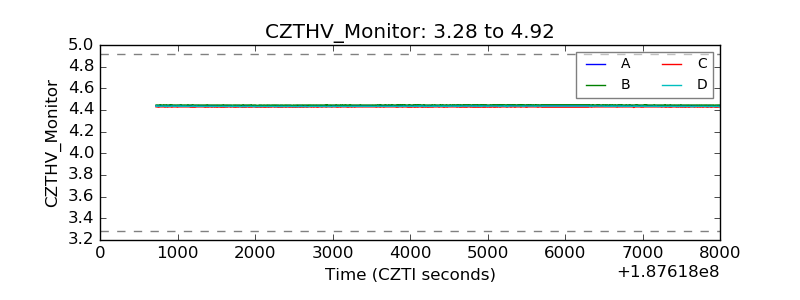 |
| D_VDD | 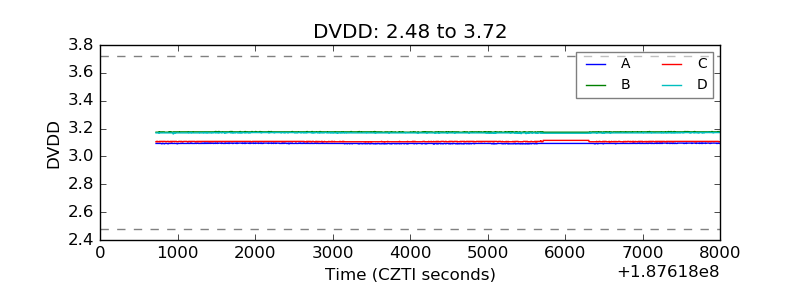 |
| Temperature 1 | 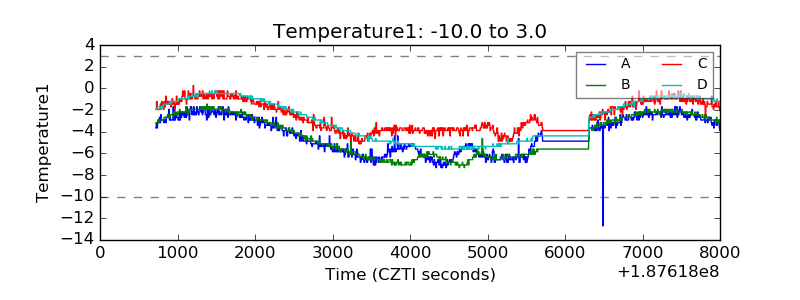 |
| Veto HV Monitor | 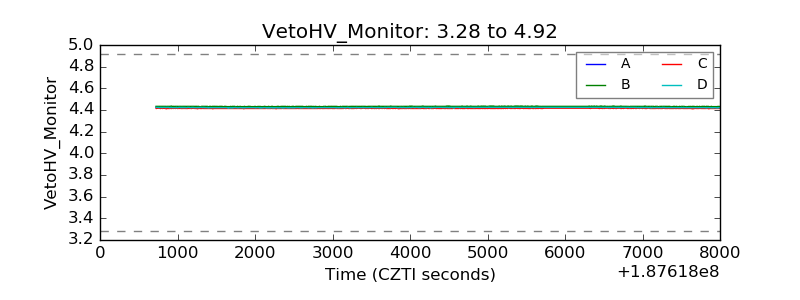 |
| Veto LLD | 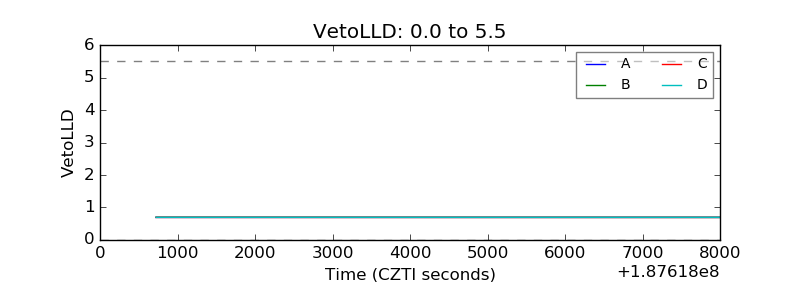 |
| Alpha Counter | 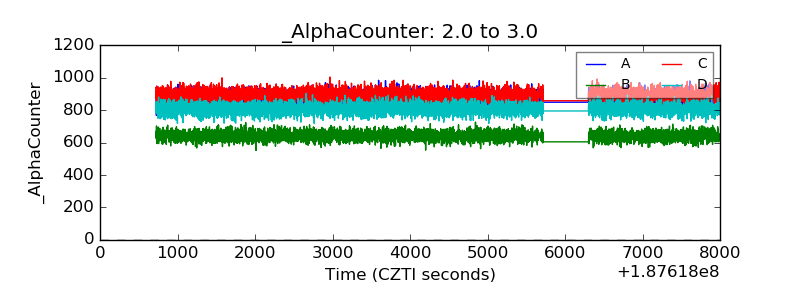 |
| _CPM_Rate | 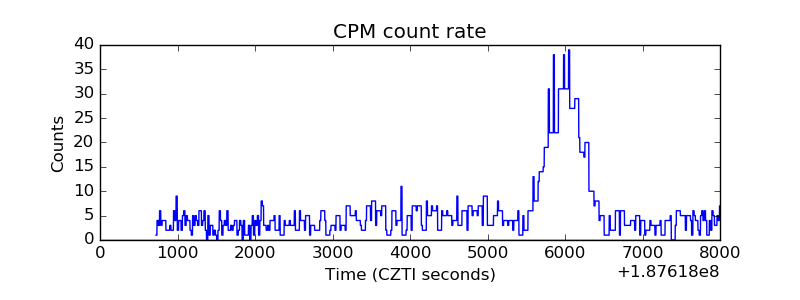 |
| CZT Counter | 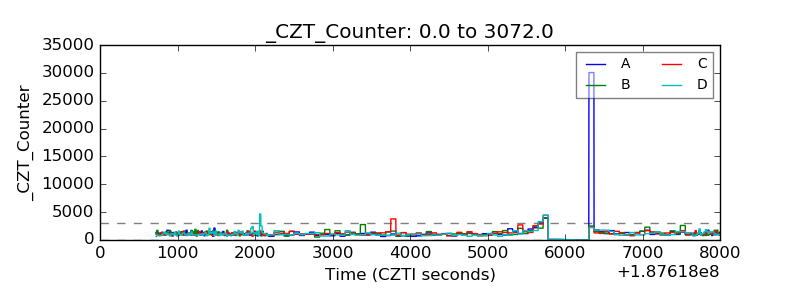 |
| +2.5 Volts monitor |  |
| +5 Volts monitor |  |
| _ROLL_ROT | 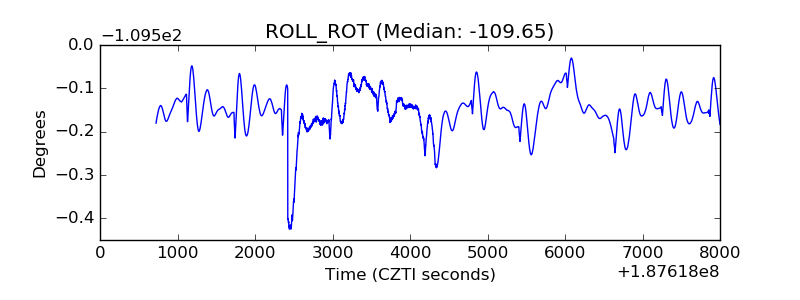 |
| _Roll_DEC | 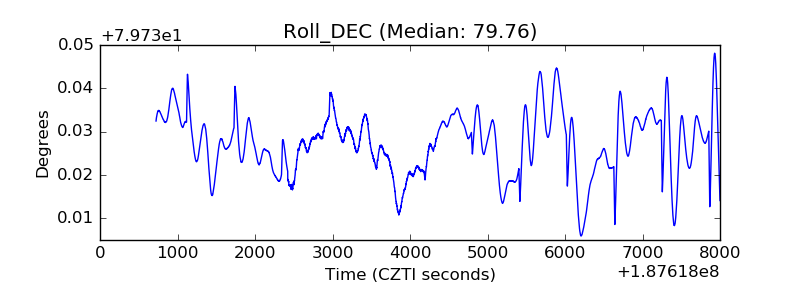 |
| _Roll_RA | 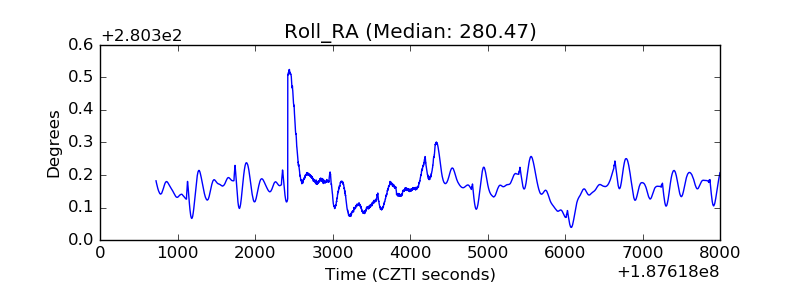 |
| Veto Counter | 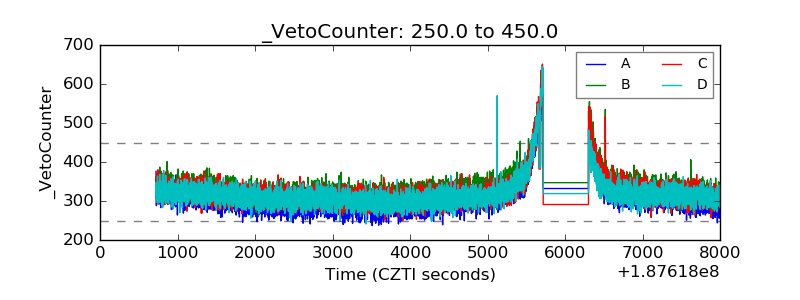 |