| Param | Original file | Final file |
|---|---|---|
| Filename | modeM0/AS1P01_997T01_9000000214_01118cztM0_level2.evt | modeM0/AS1P01_997T01_9000000214_01118cztM0_level2_quad_clean.evt |
| Size (bytes) | 1,114,395,840 | 100,998,720 |
| Size | 1.0 GB | 96.3 MB |
| Events in quadrant A | 8,076,854 | 664,475 |
| Events in quadrant B | 9,164,354 | 654,041 |
| Events in quadrant C | 8,323,221 | 635,314 |
| Events in quadrant D | 7,736,803 | 633,113 |
| Mode M9 | |||
|---|---|---|---|
| Quadrant | BADHDUFLAG | Total packets | Discarded packets |
| A | 0 | 2 | 0 |
| B | 0 | 2 | 0 |
| C | 0 | 2 | 0 |
| D | 0 | 2 | 0 |
| Mode M0 | |||
|---|---|---|---|
| Quadrant | BADHDUFLAG | Total packets | Discarded packets |
| A | 0 | 28822 | 2 |
| B | 0 | 32022 | 1 |
| C | 0 | 29541 | 1 |
| D | 0 | 27841 | 1 |
| Mode SS | |||
|---|---|---|---|
| Quadrant | BADHDUFLAG | Total packets | Discarded packets |
| A | 0 | 136 | 0 |
| B | 0 | 136 | 0 |
| C | 0 | 136 | 0 |
| D | 0 | 136 | 0 |
| Quadrant | Total seconds | Saturated seconds | Saturation percentage |
|---|---|---|---|
| A | 6775 | 8 | 0.118081% |
| B | 6775 | 80 | 1.180812% |
| C | 6775 | 41 | 0.605166% |
| D | 6775 | 66 | 0.974170% |
Noise dominated data is calculated using 1-second bins in cleaned event files. If a bin has >2000 counts, and if more than 50% of those come from <1% of pixels, then it is considered to be noise-dominated and hence unusable.
| Quadrant | # 1 sec bins | Bins with >0 counts | Bins with >2000 counts | High rate bins dominated by noise | Noise dominated (total time) | Noise dominated (detector-on time) | Marked lightcurve |
|---|---|---|---|---|---|---|---|
| A | 6945 | 6777 | 278 | 278 | 4.00% | 4.10% | 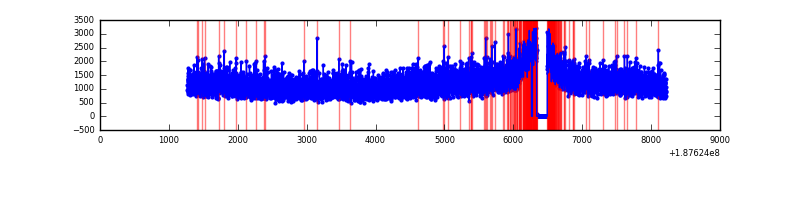 |
| B | 6945 | 6777 | 535 | 535 | 7.70% | 7.89% | 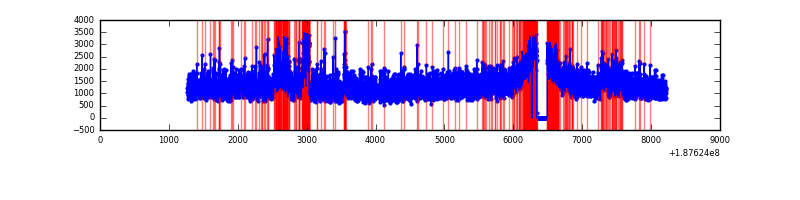 |
| C | 6945 | 6777 | 311 | 311 | 4.48% | 4.59% | 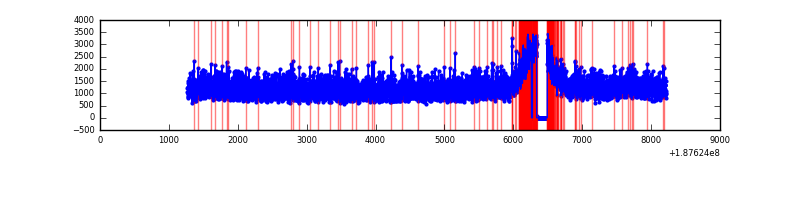 |
| D | 6945 | 6777 | 329 | 329 | 4.74% | 4.85% | 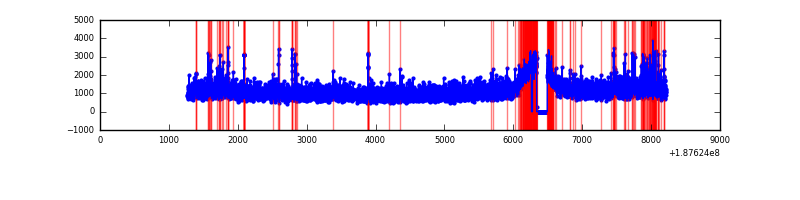 |
Top three noisy pixels from each quadrant. If the there are fewer than three noisy pixels in the level2.evt file, extra rows are filled as -1
| Pixel properties | Quadrant properties | ||||||
|---|---|---|---|---|---|---|---|
| Quadrant | DetID | PixID | Counts | Sigma | Mean | Median | Sigma |
| A | 10 | 229 | 10686 | 16.96 | 2099 | 2110 | 505.7 |
| A | 12 | 243 | 9820 | 15.25 | 2099 | 2110 | 505.7 |
| A | 11 | 79 | 7937 | 11.52 | 2099 | 2110 | 505.7 |
| B | 2 | 32 | 681538 | 1332.36 | 2174 | 2186 | 509.9 |
| B | 15 | 22 | 59815 | 113.02 | 2174 | 2186 | 509.9 |
| B | 0 | 187 | 36595 | 67.48 | 2174 | 2186 | 509.9 |
| C | 15 | 241 | 342985 | 605.74 | 2014 | 2086 | 562.8 |
| C | 10 | 207 | 29319 | 48.39 | 2014 | 2086 | 562.8 |
| C | 3 | 111 | 28393 | 46.74 | 2014 | 2086 | 562.8 |
| D | 2 | 16 | 121533 | 208.21 | 2007 | 2044 | 573.9 |
| D | 10 | 125 | 52311 | 87.59 | 2007 | 2044 | 573.9 |
| D | 13 | 73 | 24886 | 39.8 | 2007 | 2044 | 573.9 |
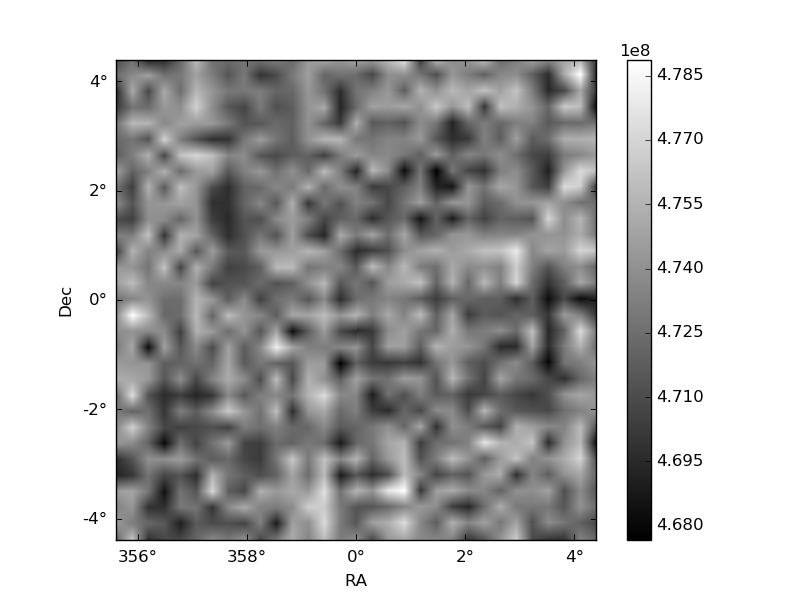
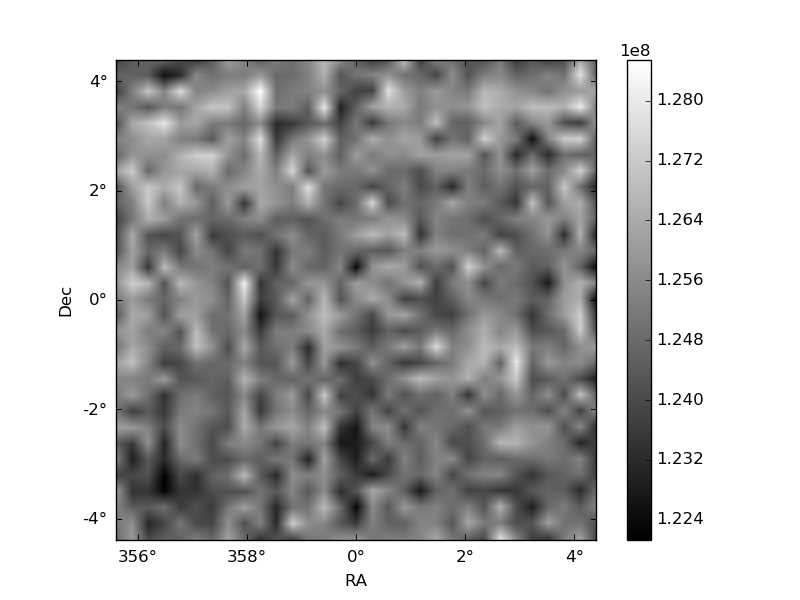
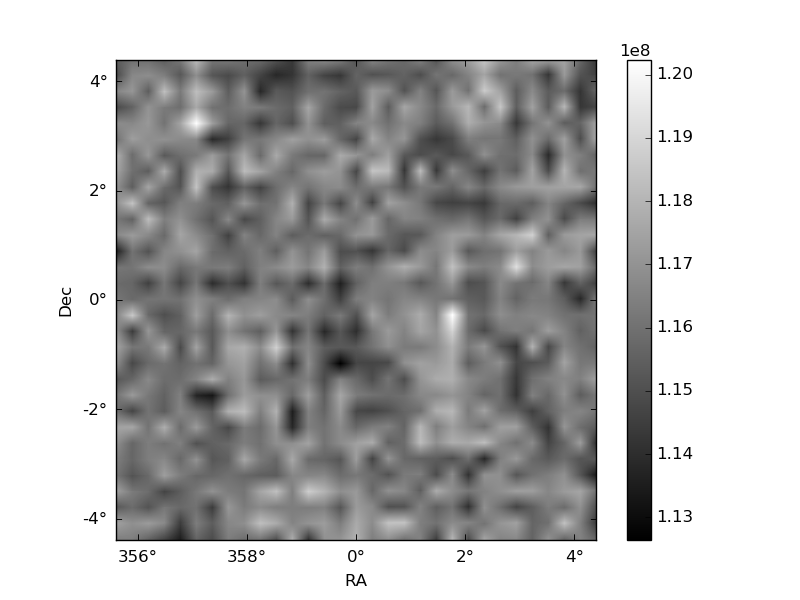
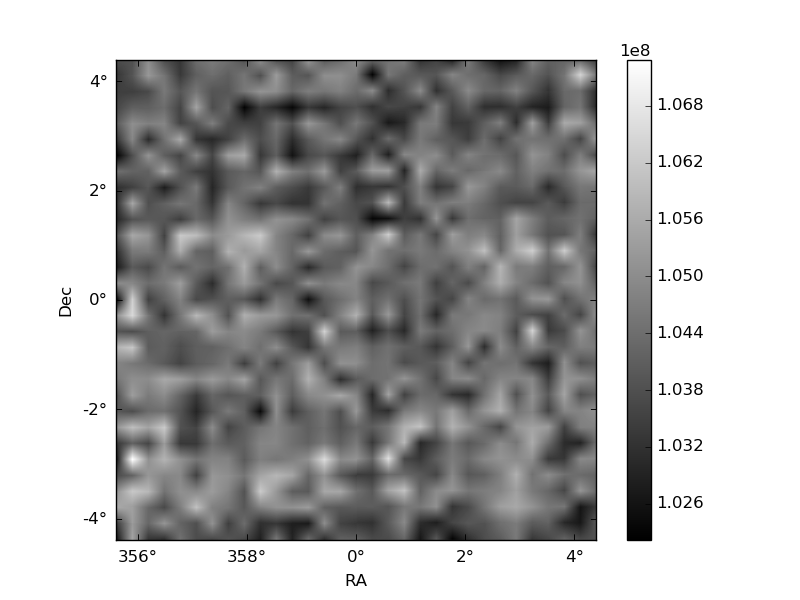
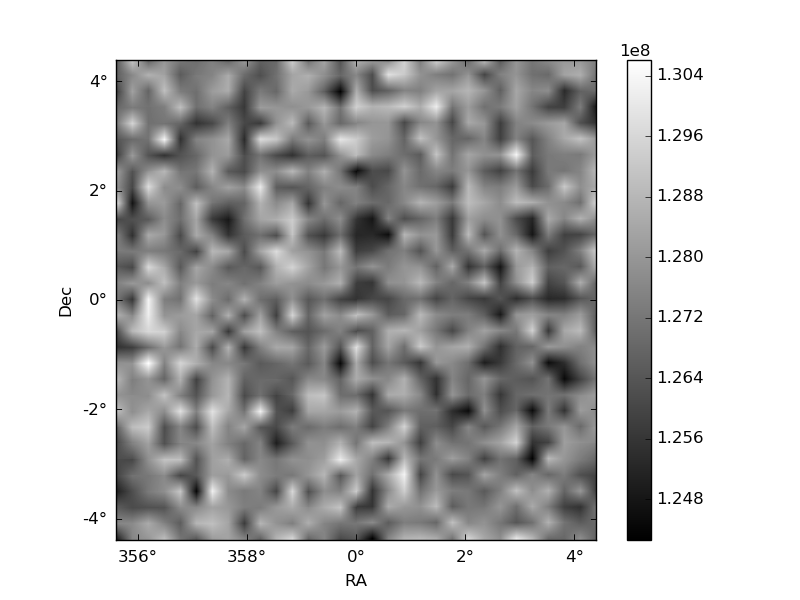
Histogram calculated using DETX and DETY for each event in the final _common_clean file
| Quadrant A | 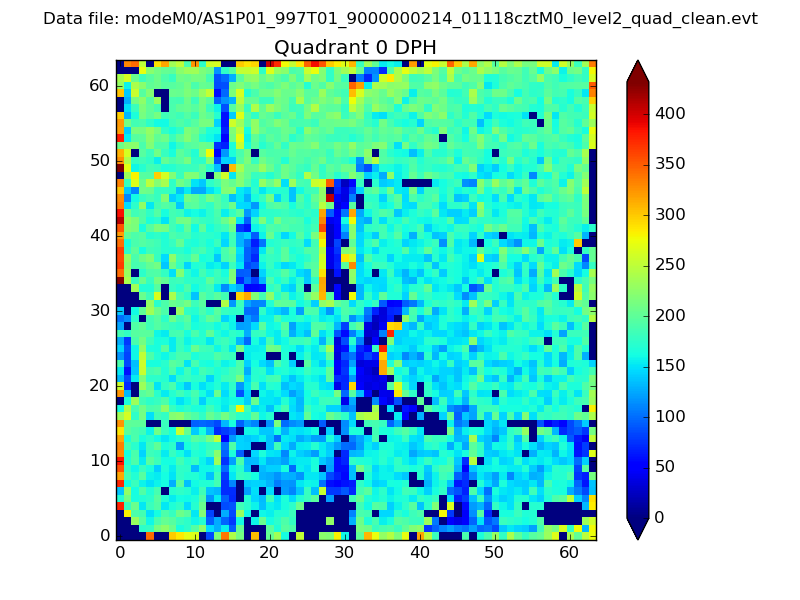 |
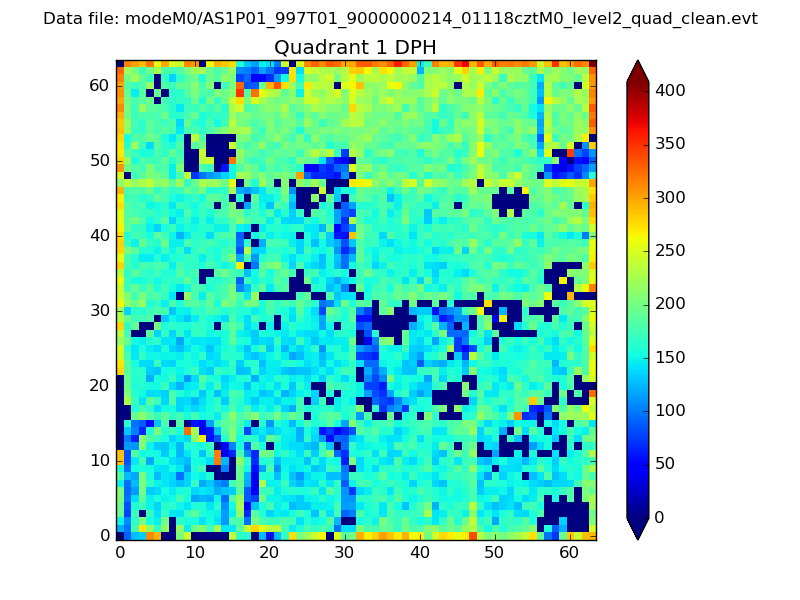 |
Quadrant B |
|---|---|---|---|
| Quadrant D | 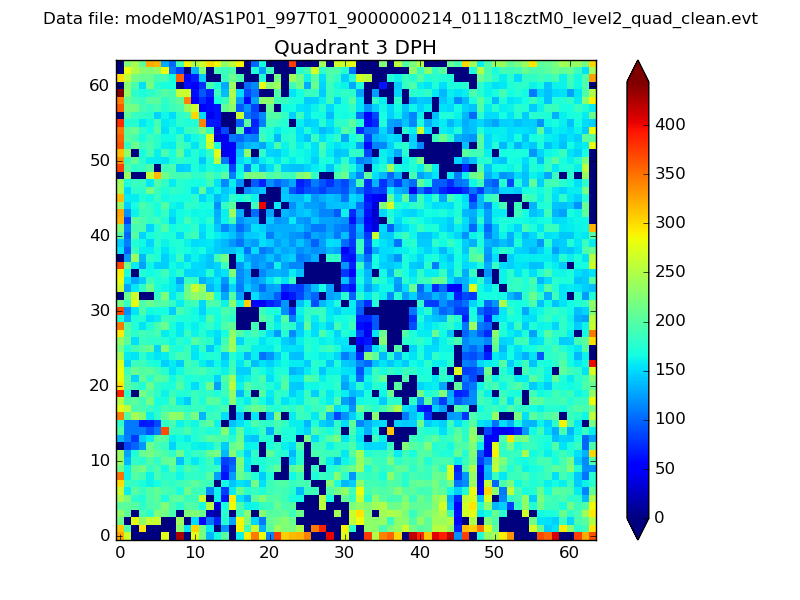 |
 |
Quadrant C |
| Plot type | Count rate plots | Images |
|---|---|---|
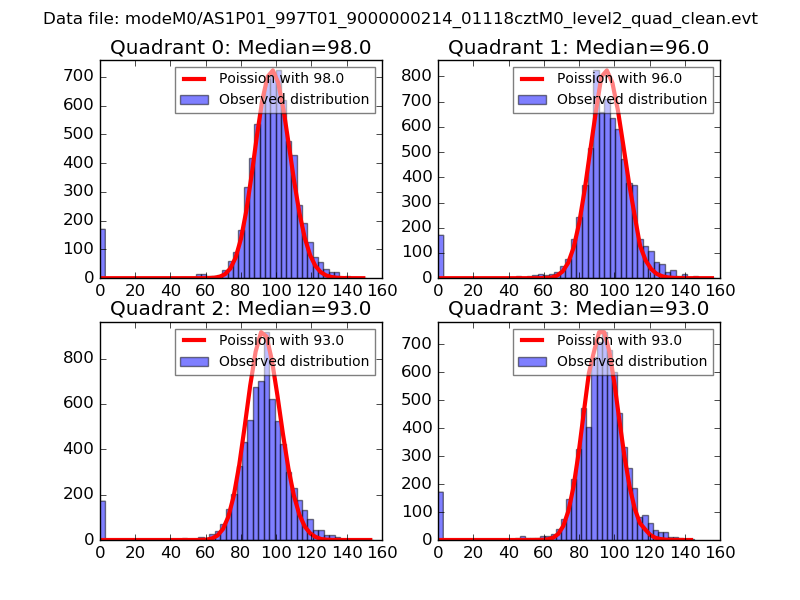
| Comparison with Poisson distribution Blue bars denote a histogram of data divided into 1 sec bins. Red curve is a Poisson curve with rate = median count rate of data. |
 |
 |
| Quadrant-wise count rates Data is divided into 100 sec bins |
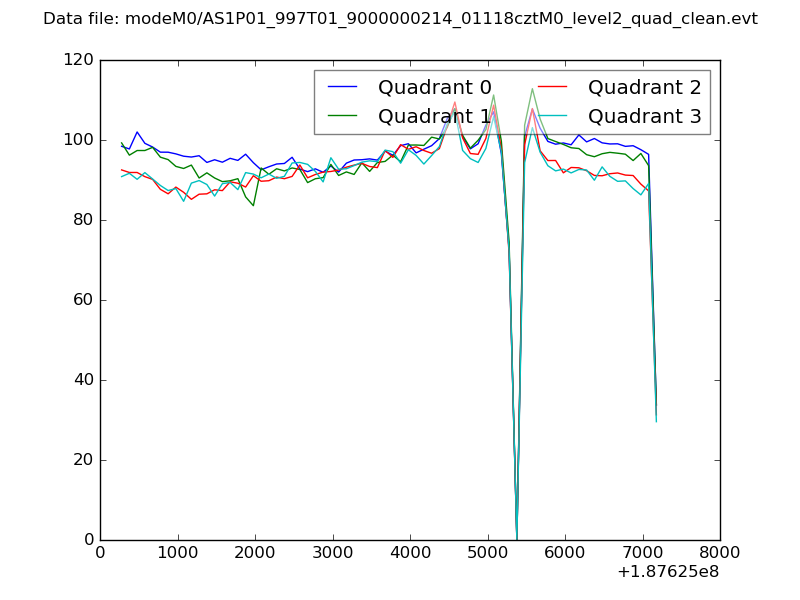 |
|
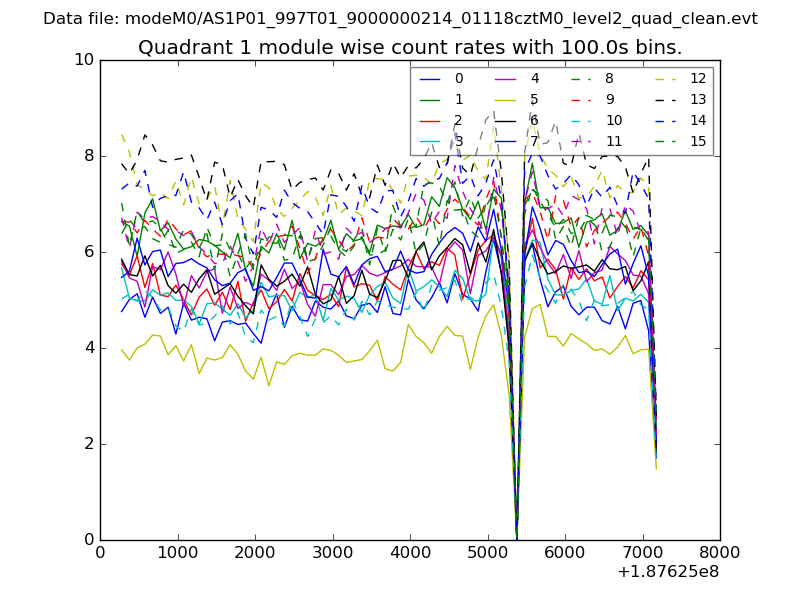
| Module-wise count rates for Quadrant A Data is divided into 100 sec bins |
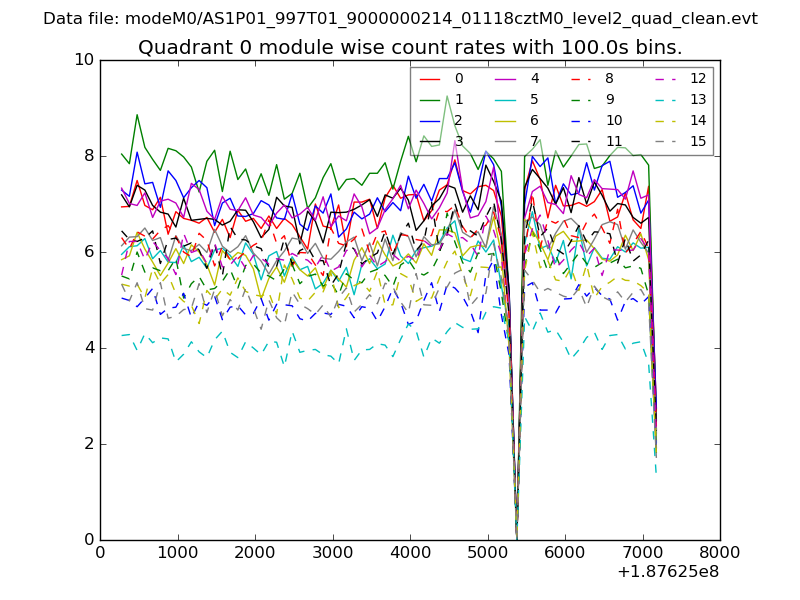 |
 |
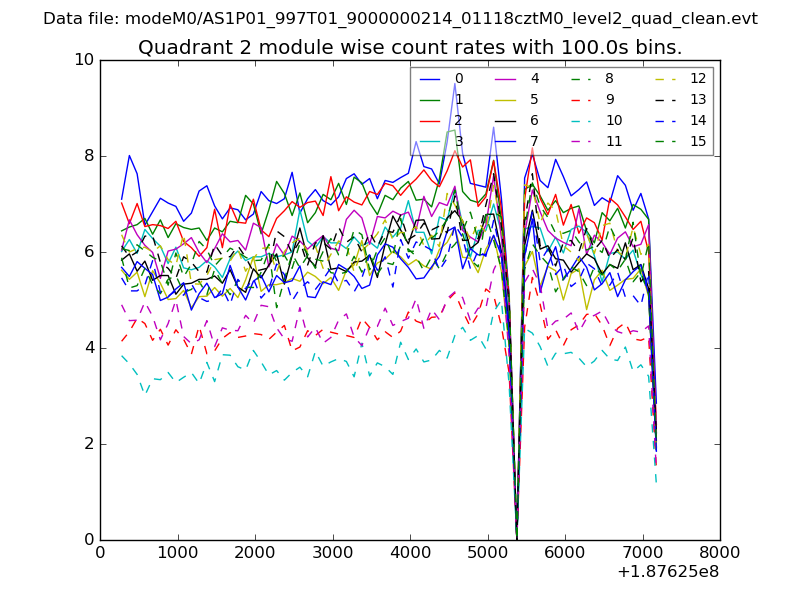
| Module-wise count rates for Quadrant B Data is divided into 100 sec bins |
 |
 |
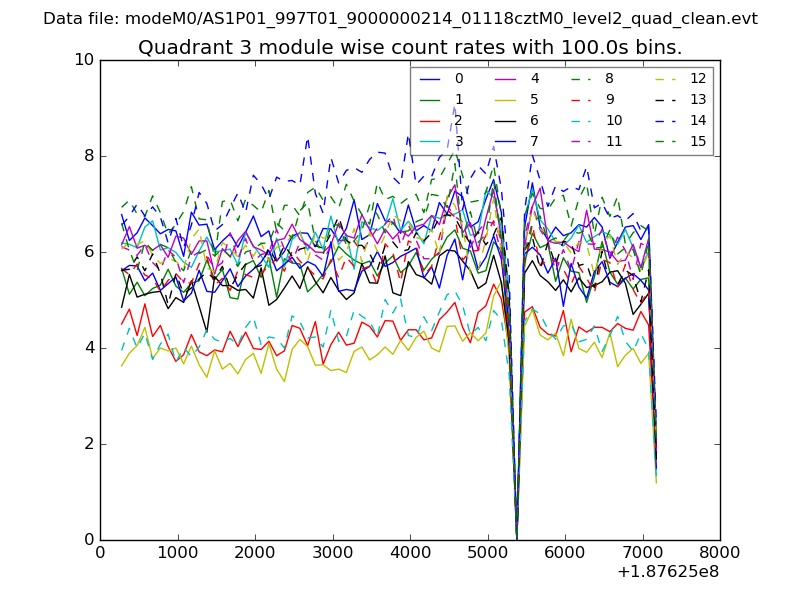
| Module-wise count rates for Quadrant C Data is divided into 100 sec bins |
 |
 |
| Module-wise count rates for Quadrant D Data is divided into 100 sec bins |
 |
 |
| Parameter | Plot |
|---|---|
| CZT HV Monitor | 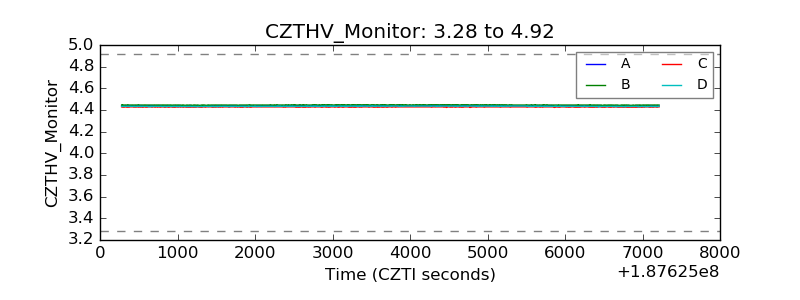 |
| D_VDD | 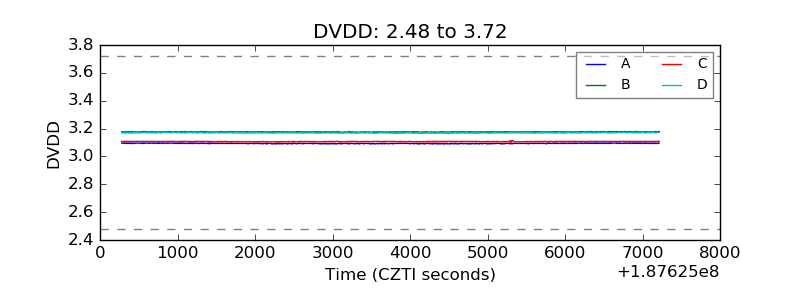 |
| Temperature 1 | 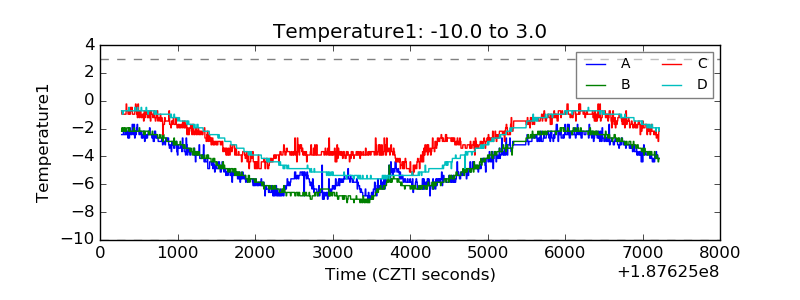 |
| Veto HV Monitor | 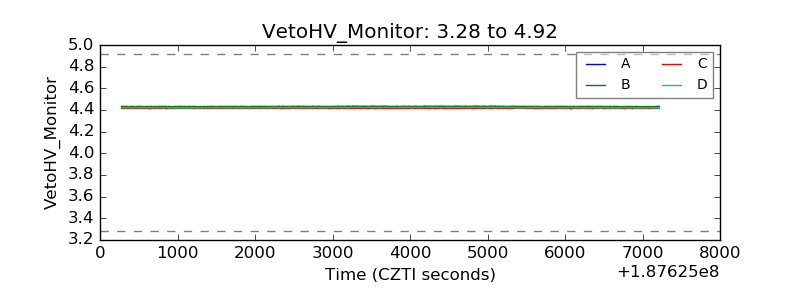 |
| Veto LLD | 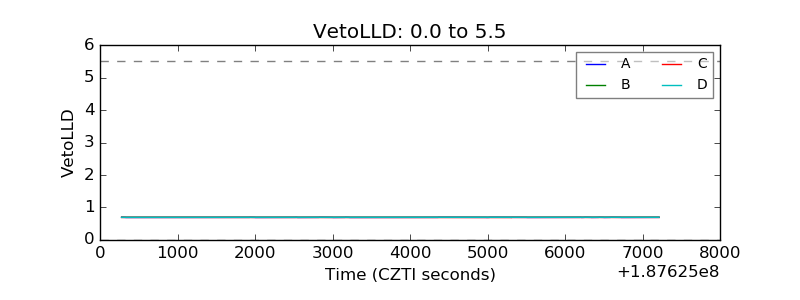 |
| Alpha Counter |  |
| _CPM_Rate |  |
| CZT Counter | 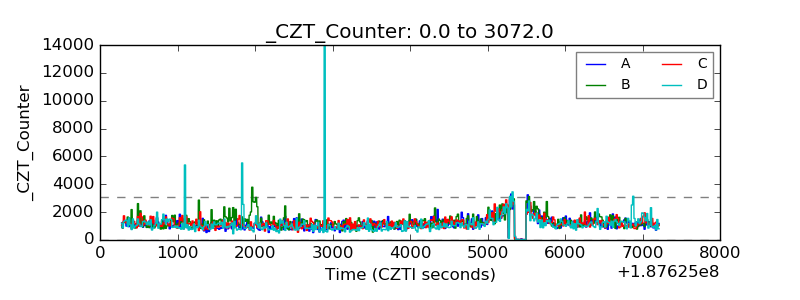 |
| +2.5 Volts monitor |  |
| +5 Volts monitor |  |
| _ROLL_ROT | 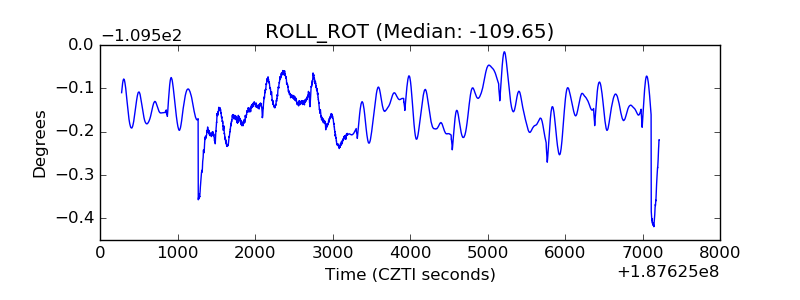 |
| _Roll_DEC | 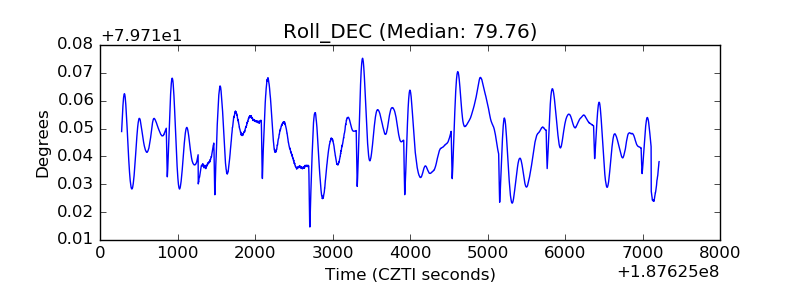 |
| _Roll_RA | 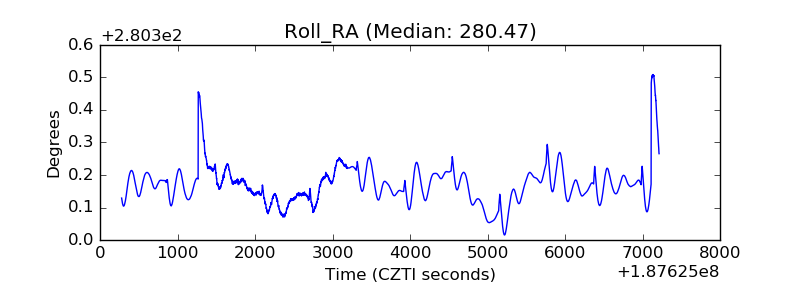 |
| Veto Counter | 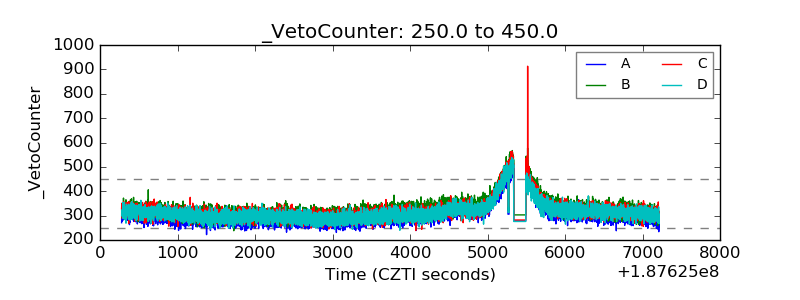 |