| Param | Original file | Final file |
|---|---|---|
| Filename | modeM0/AS1P01_997T01_9000000214_01119cztM0_level2.evt | modeM0/AS1P01_997T01_9000000214_01119cztM0_level2_quad_clean.evt |
| Size (bytes) | 1,232,902,080 | 109,437,120 |
| Size | 1.1 GB | 104.4 MB |
| Events in quadrant A | 8,837,950 | 723,503 |
| Events in quadrant B | 9,367,653 | 717,648 |
| Events in quadrant C | 9,152,942 | 692,548 |
| Events in quadrant D | 9,491,429 | 666,546 |
| Mode M0 | |||
|---|---|---|---|
| Quadrant | BADHDUFLAG | Total packets | Discarded packets |
| A | 0 | 31536 | 3 |
| B | 0 | 33081 | 2 |
| C | 0 | 32460 | 2 |
| D | 0 | 33592 | 2 |
| Mode SS | |||
|---|---|---|---|
| Quadrant | BADHDUFLAG | Total packets | Discarded packets |
| A | 0 | 148 | 0 |
| B | 0 | 148 | 0 |
| C | 0 | 148 | 0 |
| D | 0 | 148 | 0 |
| Quadrant | Total seconds | Saturated seconds | Saturation percentage |
|---|---|---|---|
| A | 7383 | 9 | 0.121902% |
| B | 7383 | 10 | 0.135446% |
| C | 7383 | 17 | 0.230259% |
| D | 7383 | 435 | 5.891914% |
Noise dominated data is calculated using 1-second bins in cleaned event files. If a bin has >2000 counts, and if more than 50% of those come from <1% of pixels, then it is considered to be noise-dominated and hence unusable.
| Quadrant | # 1 sec bins | Bins with >0 counts | Bins with >2000 counts | High rate bins dominated by noise | Noise dominated (total time) | Noise dominated (detector-on time) | Marked lightcurve |
|---|---|---|---|---|---|---|---|
| A | 7433 | 7385 | 284 | 284 | 3.82% | 3.85% | 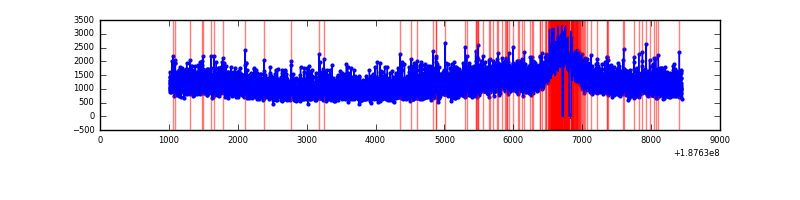 |
| B | 7433 | 7385 | 381 | 381 | 5.13% | 5.16% | 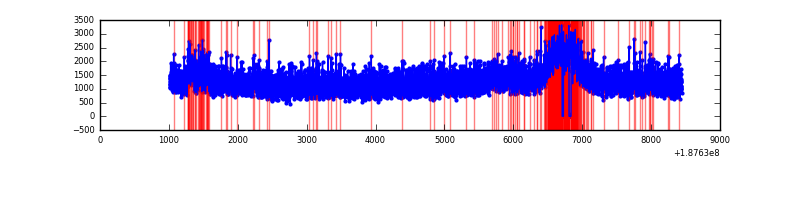 |
| C | 7433 | 7385 | 354 | 354 | 4.76% | 4.79% | 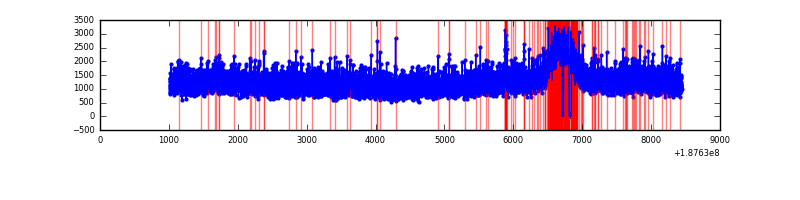 |
| D | 7433 | 7385 | 872 | 872 | 11.73% | 11.81% | 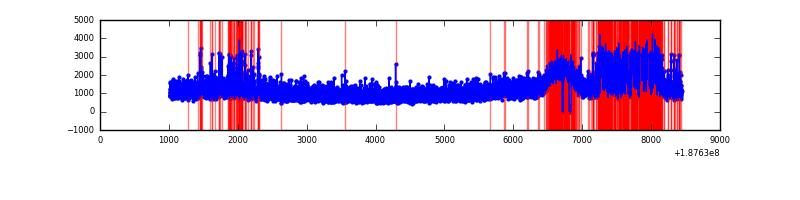 |
Top three noisy pixels from each quadrant. If the there are fewer than three noisy pixels in the level2.evt file, extra rows are filled as -1
| Pixel properties | Quadrant properties | ||||||
|---|---|---|---|---|---|---|---|
| Quadrant | DetID | PixID | Counts | Sigma | Mean | Median | Sigma |
| A | 12 | 243 | 10009 | 13.9 | 2300 | 2312 | 553.6 |
| A | 11 | 79 | 9176 | 12.4 | 2300 | 2312 | 553.6 |
| A | 3 | 111 | 7004 | 8.48 | 2300 | 2312 | 553.6 |
| B | 2 | 32 | 106060 | 185.23 | 2381 | 2390 | 559.7 |
| B | 15 | 22 | 60598 | 104.0 | 2381 | 2390 | 559.7 |
| B | 8 | 234 | 47876 | 81.27 | 2381 | 2390 | 559.7 |
| C | 15 | 241 | 377990 | 610.42 | 2199 | 2278 | 615.5 |
| C | 9 | 68 | 50055 | 77.62 | 2199 | 2278 | 615.5 |
| C | 10 | 207 | 48299 | 74.77 | 2199 | 2278 | 615.5 |
| D | 2 | 16 | 37148 | 54.87 | 2165 | 2219 | 636.5 |
| D | 10 | 125 | 34511 | 50.73 | 2165 | 2219 | 636.5 |
| D | 2 | 14 | 26742 | 38.53 | 2165 | 2219 | 636.5 |
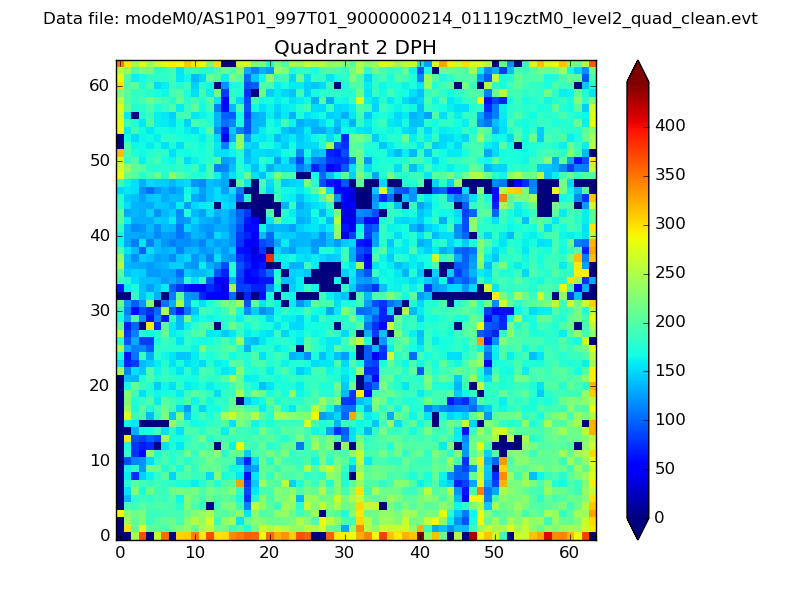
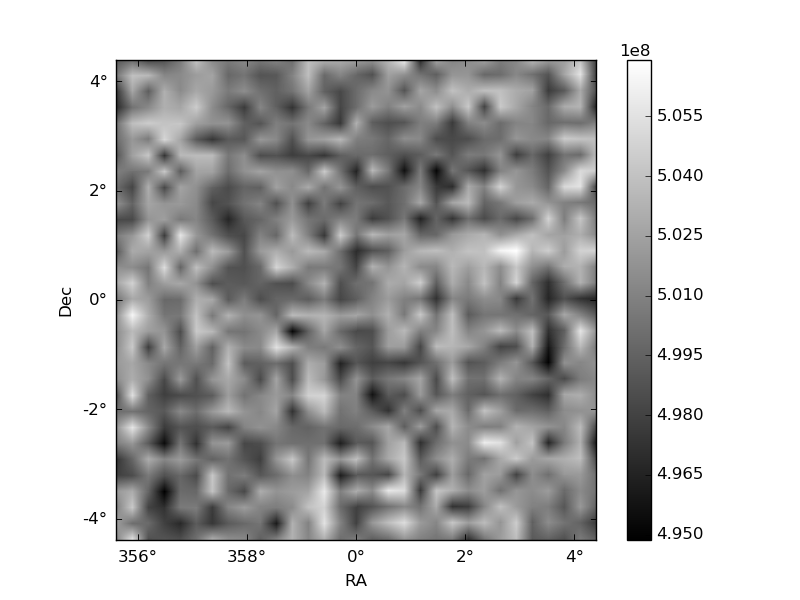
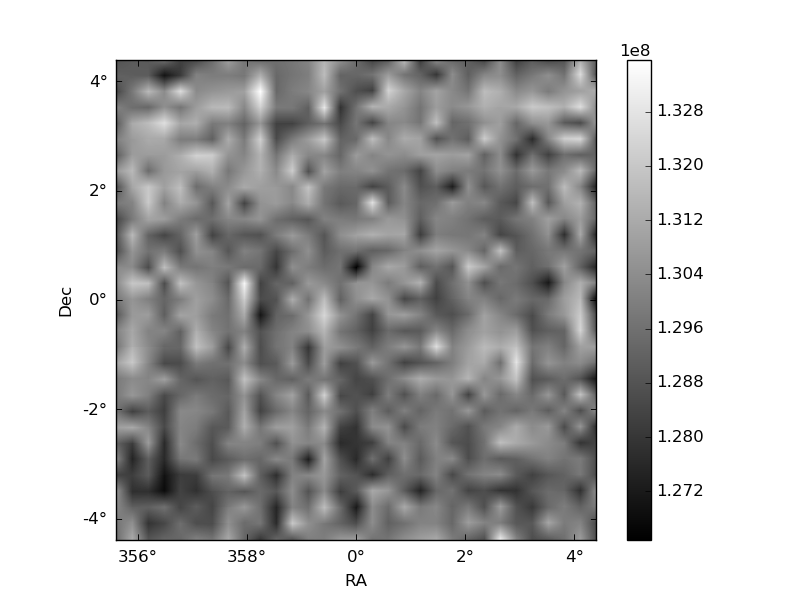
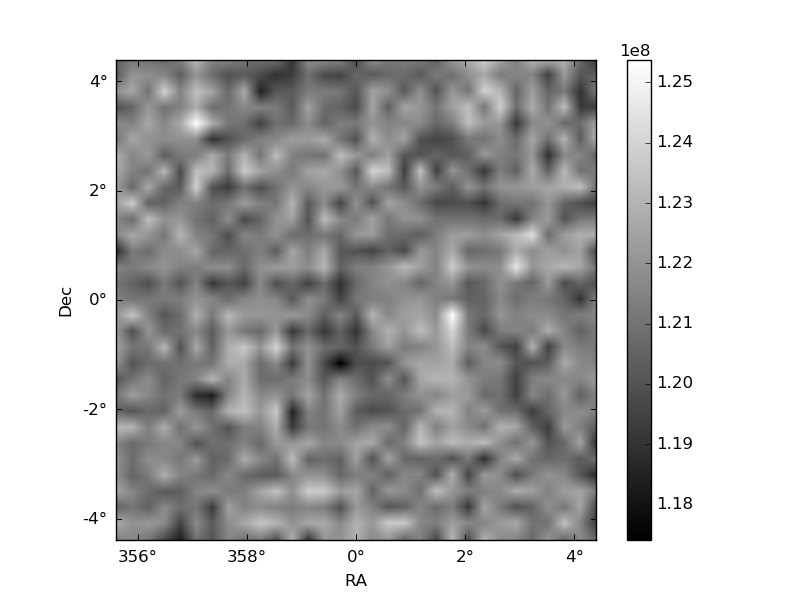
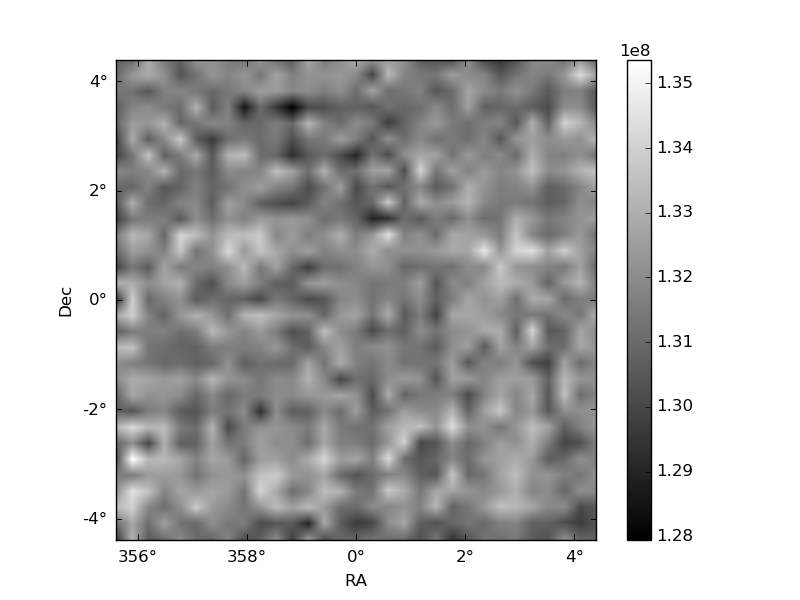
Histogram calculated using DETX and DETY for each event in the final _common_clean file
| Quadrant A | 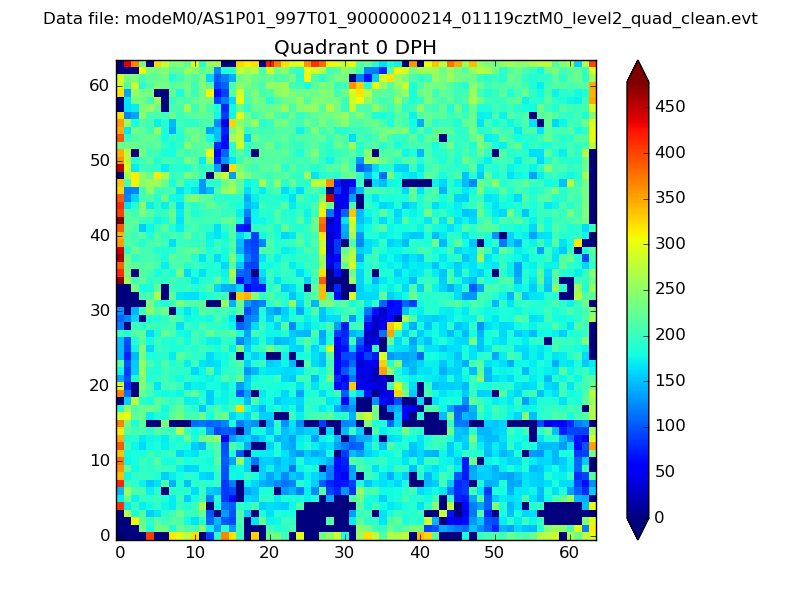 |
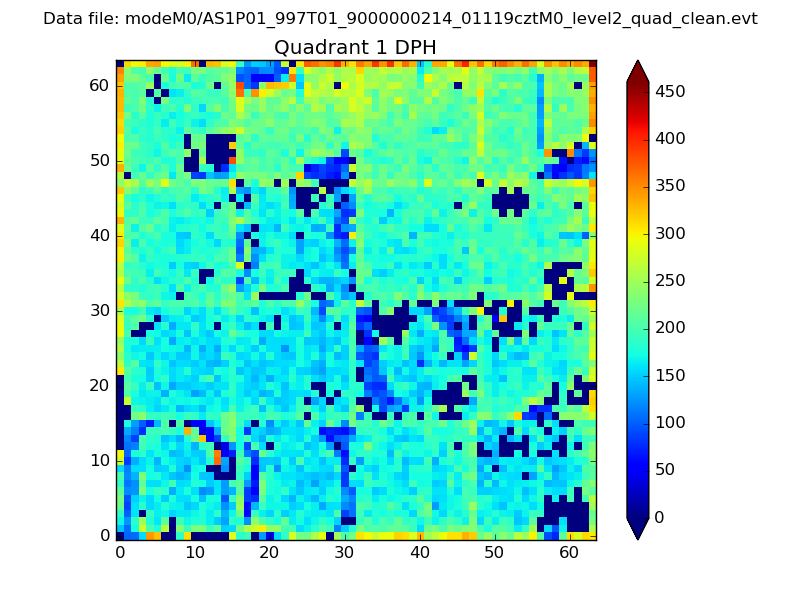 |
Quadrant B |
|---|---|---|---|
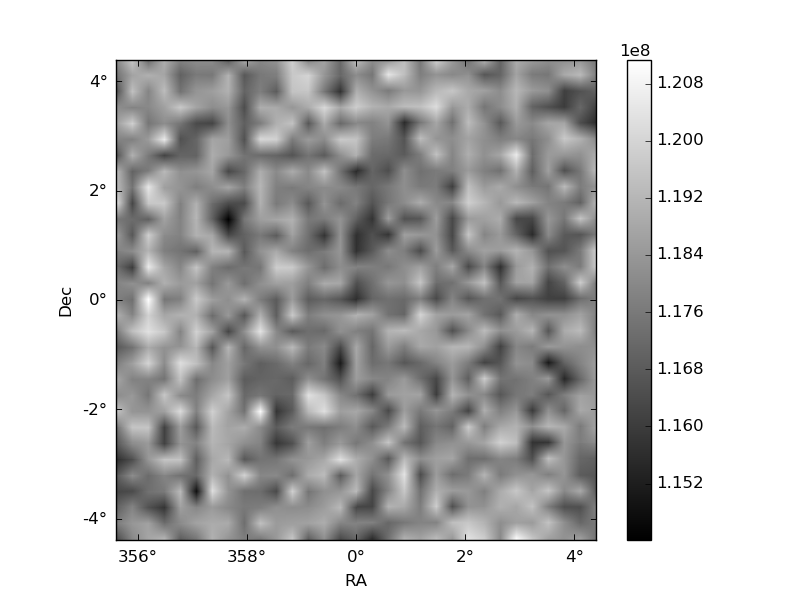
| Quadrant D | 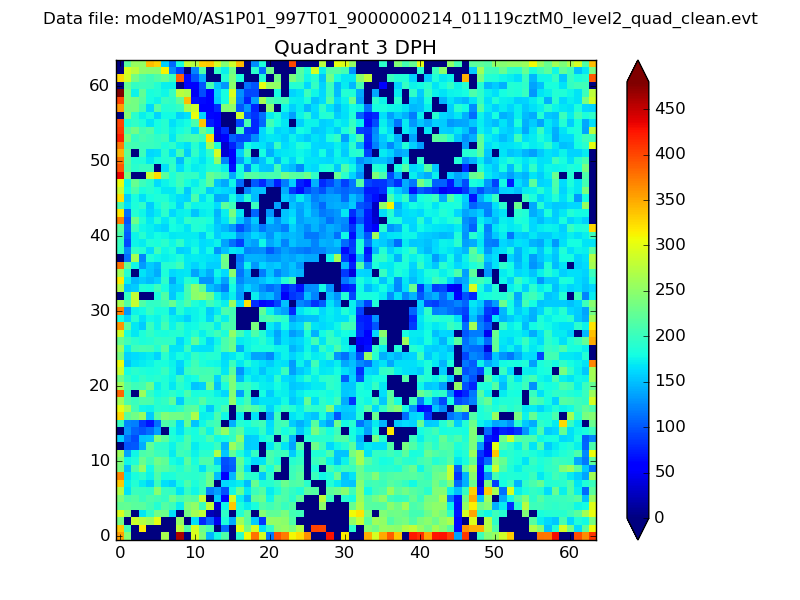 |
 |
Quadrant C |
| Plot type | Count rate plots | Images |
|---|---|---|
| Comparison with Poisson distribution Blue bars denote a histogram of data divided into 1 sec bins. Red curve is a Poisson curve with rate = median count rate of data. |
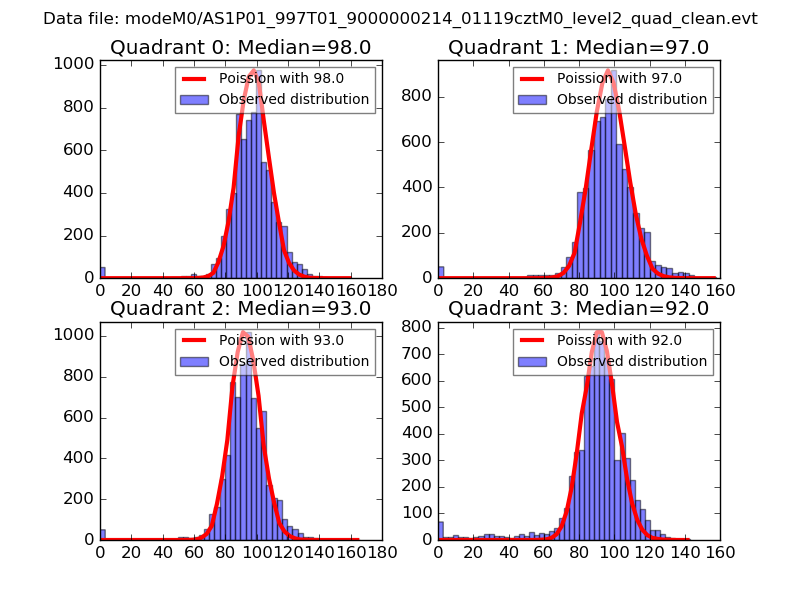 |
 |
| Quadrant-wise count rates Data is divided into 100 sec bins |
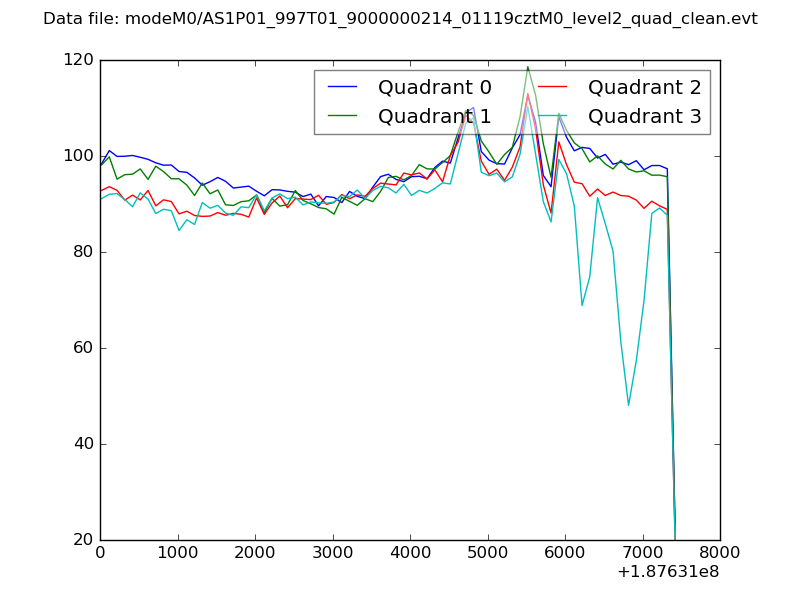 |
|
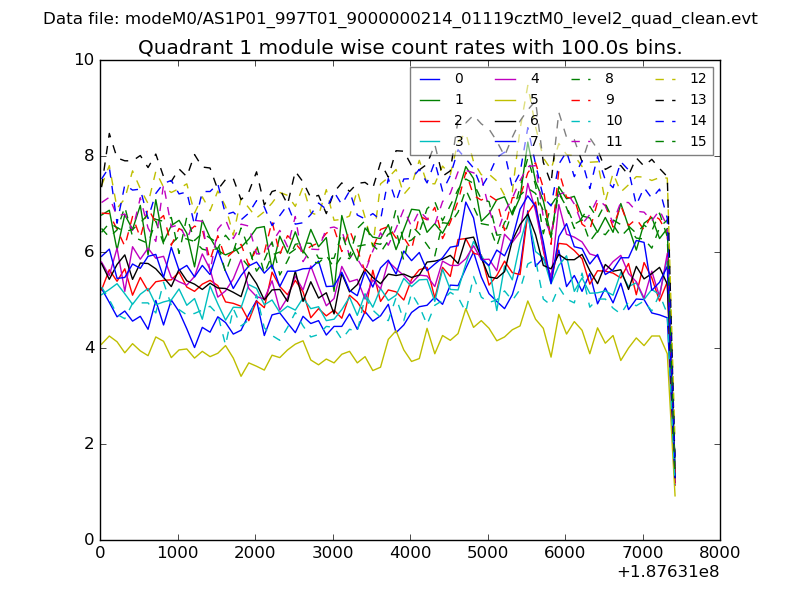
| Module-wise count rates for Quadrant A Data is divided into 100 sec bins |
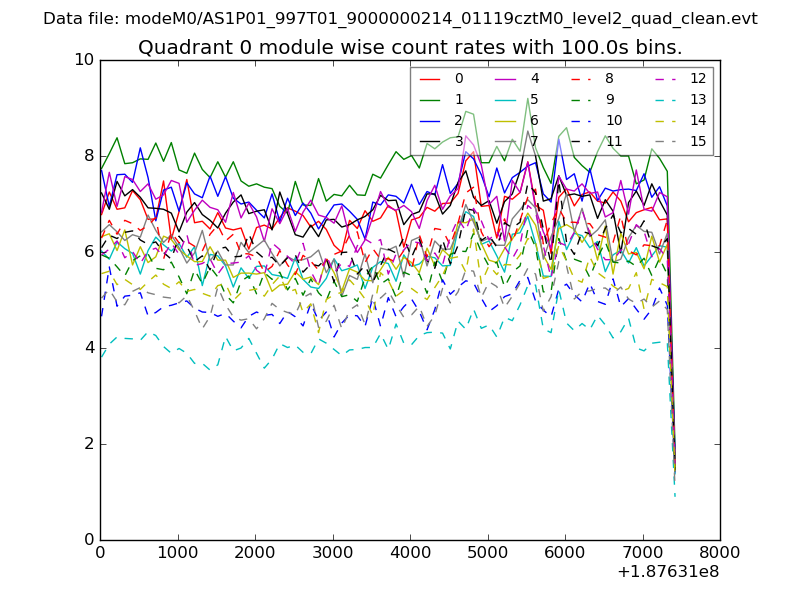 |
 |
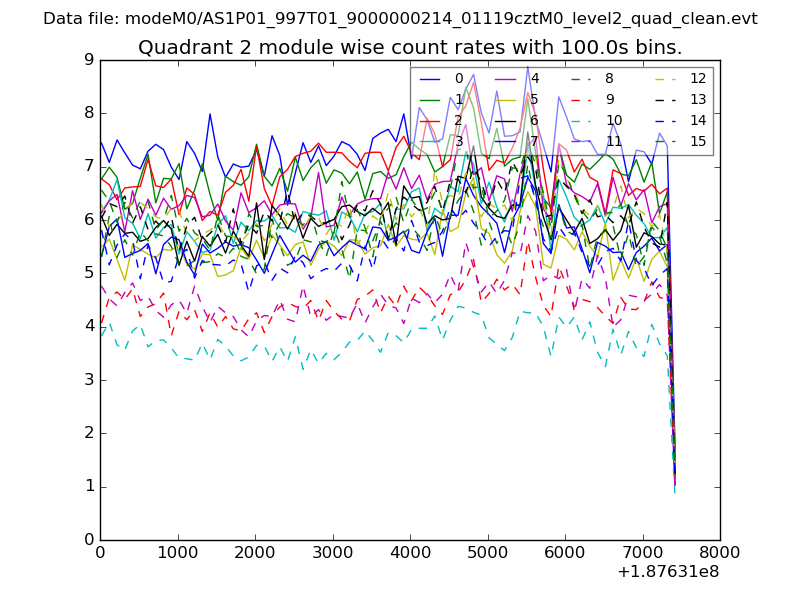
| Module-wise count rates for Quadrant B Data is divided into 100 sec bins |
 |
 |
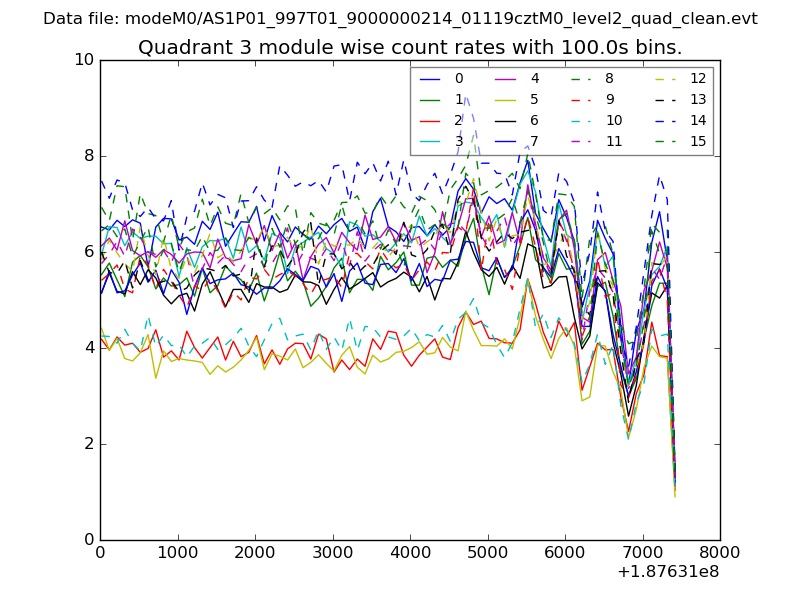
| Module-wise count rates for Quadrant C Data is divided into 100 sec bins |
 |
 |
| Module-wise count rates for Quadrant D Data is divided into 100 sec bins |
 |
 |
| Parameter | Plot |
|---|---|
| CZT HV Monitor | 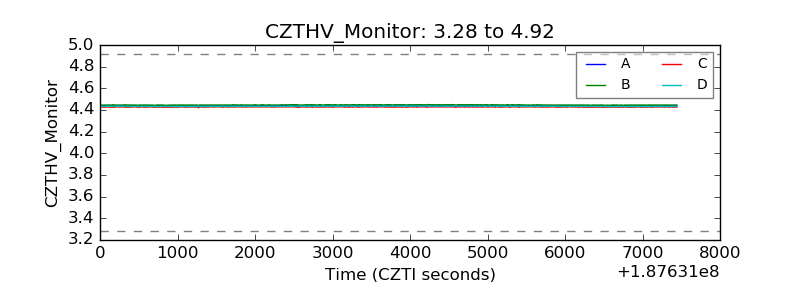 |
| D_VDD | 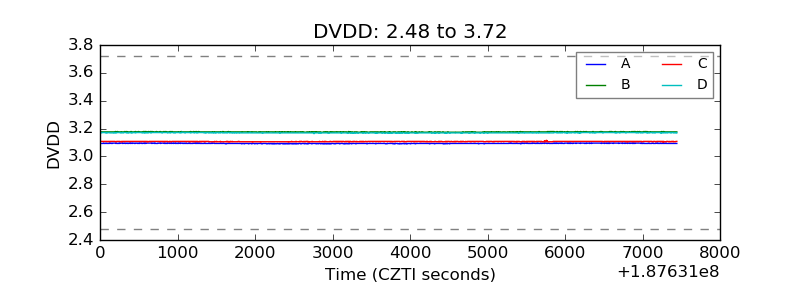 |
| Temperature 1 | 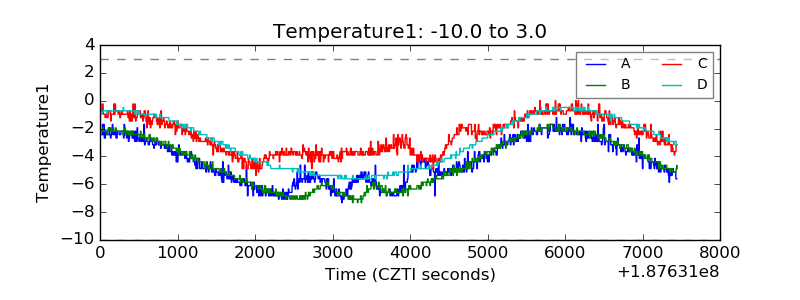 |
| Veto HV Monitor | 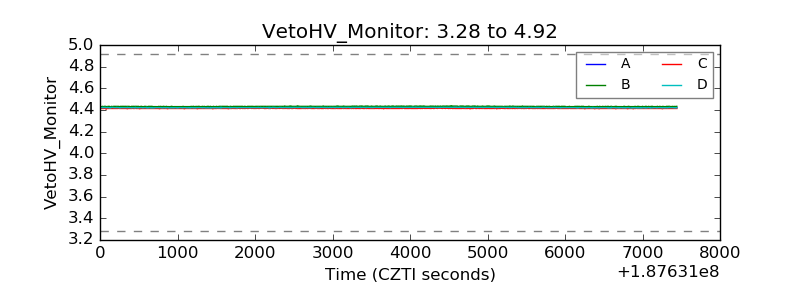 |
| Veto LLD | 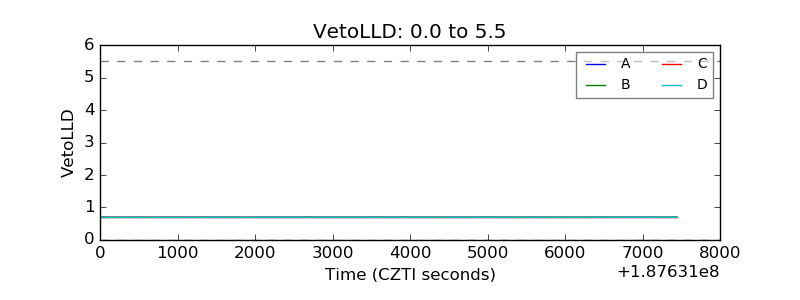 |
| Alpha Counter | 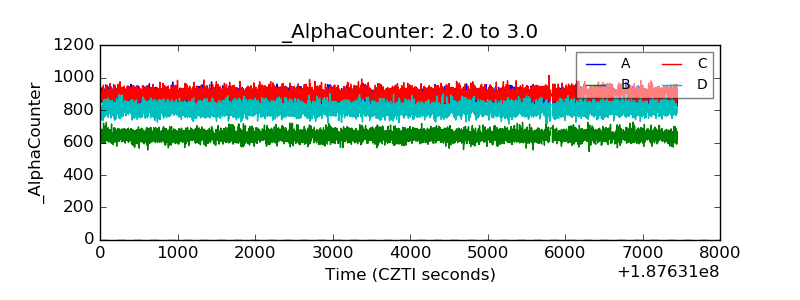 |
| _CPM_Rate | 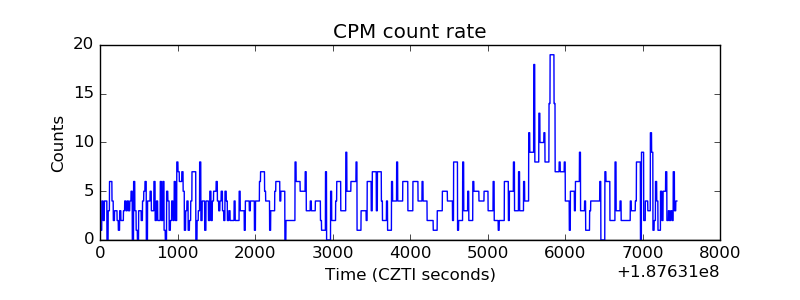 |
| CZT Counter | 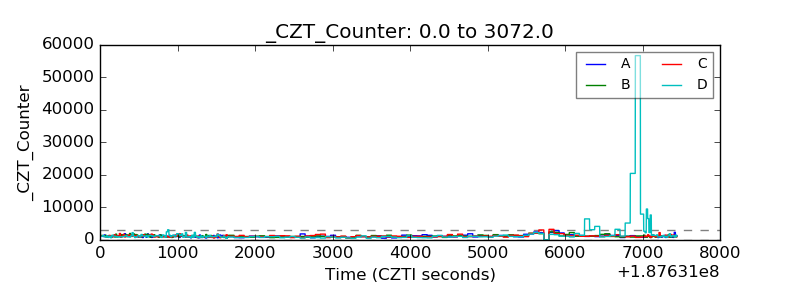 |
| +2.5 Volts monitor |  |
| +5 Volts monitor | 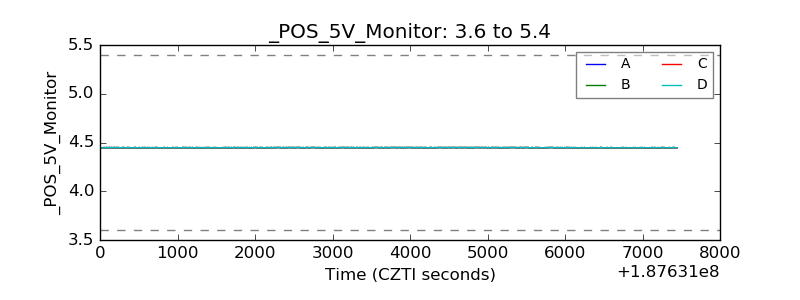 |
| _ROLL_ROT | 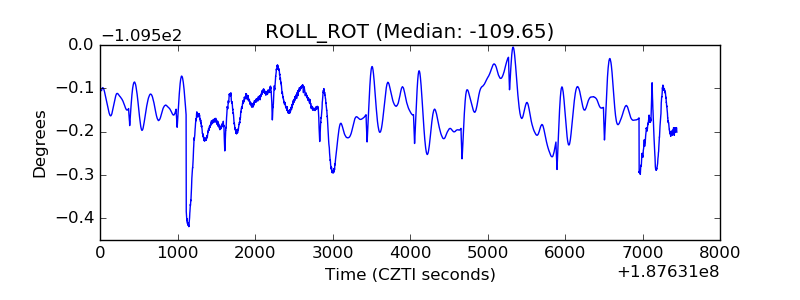 |
| _Roll_DEC | 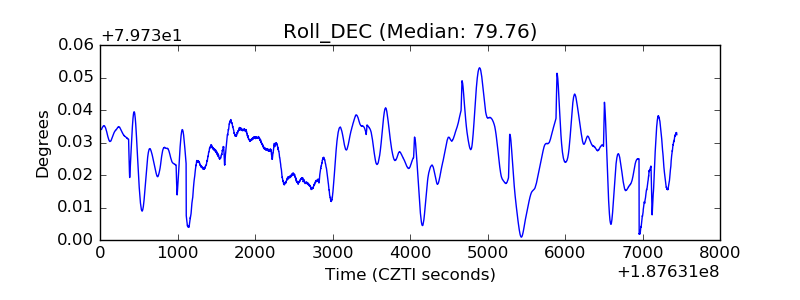 |
| _Roll_RA | 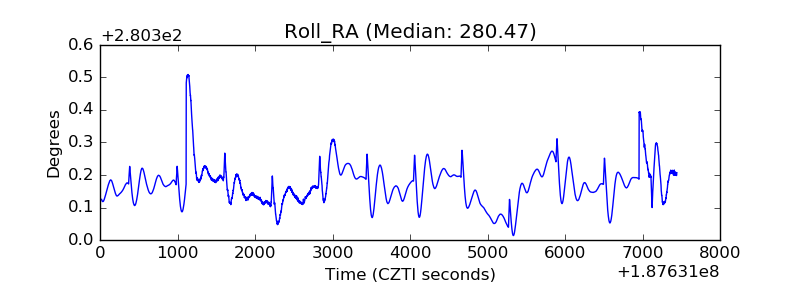 |
| Veto Counter | 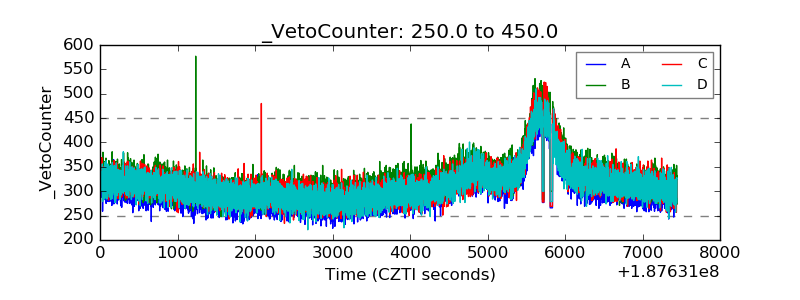 |