| Param | Original file | Final file |
|---|---|---|
| Filename | modeM0/AS1P01_997T01_9000000214_01120cztM0_level2.evt | modeM0/AS1P01_997T01_9000000214_01120cztM0_level2_quad_clean.evt |
| Size (bytes) | 1,196,622,720 | 102,591,360 |
| Size | 1.1 GB | 97.8 MB |
| Events in quadrant A | 8,211,097 | 678,676 |
| Events in quadrant B | 8,569,739 | 673,043 |
| Events in quadrant C | 9,961,554 | 635,780 |
| Events in quadrant D | 9,032,655 | 630,077 |
| Mode M9 | |||
|---|---|---|---|
| Quadrant | BADHDUFLAG | Total packets | Discarded packets |
| A | 0 | 4 | 0 |
| B | 0 | 4 | 0 |
| C | 0 | 4 | 0 |
| D | 0 | 4 | 0 |
| Mode M0 | |||
|---|---|---|---|
| Quadrant | BADHDUFLAG | Total packets | Discarded packets |
| A | 0 | 29372 | 2 |
| B | 0 | 30462 | 1 |
| C | 0 | 34656 | 1 |
| D | 0 | 31935 | 1 |
| Mode SS | |||
|---|---|---|---|
| Quadrant | BADHDUFLAG | Total packets | Discarded packets |
| A | 0 | 142 | 0 |
| B | 0 | 142 | 0 |
| C | 0 | 142 | 0 |
| D | 0 | 142 | 0 |
| Quadrant | Total seconds | Saturated seconds | Saturation percentage |
|---|---|---|---|
| A | 7025 | 11 | 0.156584% |
| B | 7025 | 8 | 0.113879% |
| C | 7025 | 382 | 5.437722% |
| D | 7025 | 410 | 5.836299% |
Noise dominated data is calculated using 1-second bins in cleaned event files. If a bin has >2000 counts, and if more than 50% of those come from <1% of pixels, then it is considered to be noise-dominated and hence unusable.
| Quadrant | # 1 sec bins | Bins with >0 counts | Bins with >2000 counts | High rate bins dominated by noise | Noise dominated (total time) | Noise dominated (detector-on time) | Marked lightcurve |
|---|---|---|---|---|---|---|---|
| A | 7380 | 7026 | 190 | 190 | 2.57% | 2.70% | 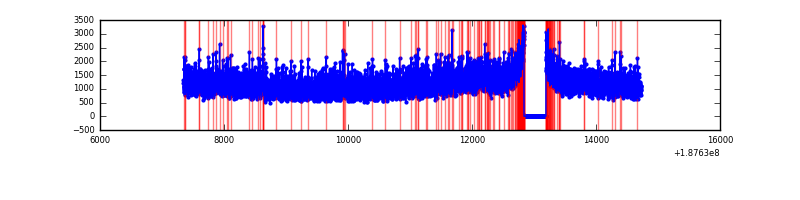 |
| B | 7380 | 7026 | 200 | 200 | 2.71% | 2.85% | 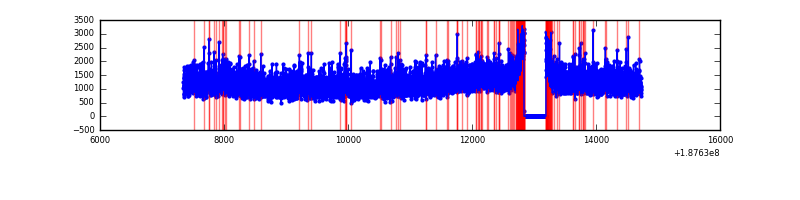 |
| C | 7380 | 7026 | 991 | 991 | 13.43% | 14.10% | 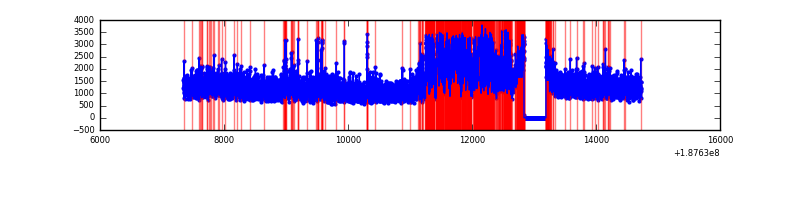 |
| D | 7380 | 7026 | 829 | 829 | 11.23% | 11.80% | 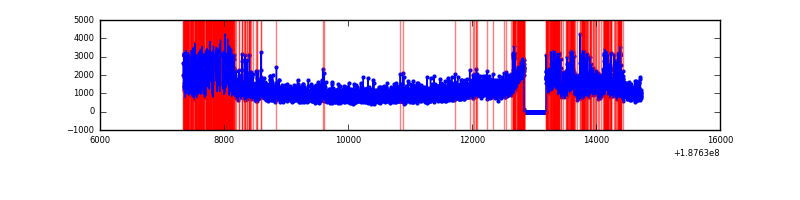 |
Top three noisy pixels from each quadrant. If the there are fewer than three noisy pixels in the level2.evt file, extra rows are filled as -1
| Pixel properties | Quadrant properties | ||||||
|---|---|---|---|---|---|---|---|
| Quadrant | DetID | PixID | Counts | Sigma | Mean | Median | Sigma |
| A | 0 | 175 | 37516 | 69.82 | 2113 | 2125 | 506.9 |
| A | 12 | 243 | 27441 | 49.95 | 2113 | 2125 | 506.9 |
| A | 10 | 229 | 20434 | 36.12 | 2113 | 2125 | 506.9 |
| B | 15 | 22 | 49603 | 90.7 | 2209 | 2216 | 522.5 |
| B | 8 | 234 | 47752 | 87.16 | 2209 | 2216 | 522.5 |
| B | 0 | 190 | 25230 | 44.05 | 2209 | 2216 | 522.5 |
| C | 5 | 234 | 1679470 | 3001.16 | 2000 | 2072 | 558.9 |
| C | 15 | 241 | 352670 | 627.28 | 2000 | 2072 | 558.9 |
| C | 10 | 207 | 42725 | 72.74 | 2000 | 2072 | 558.9 |
| D | 2 | 16 | 187663 | 312.25 | 1996 | 2038 | 594.5 |
| D | 12 | 22 | 127972 | 211.84 | 1996 | 2038 | 594.5 |
| D | 14 | 34 | 98621 | 162.47 | 1996 | 2038 | 594.5 |
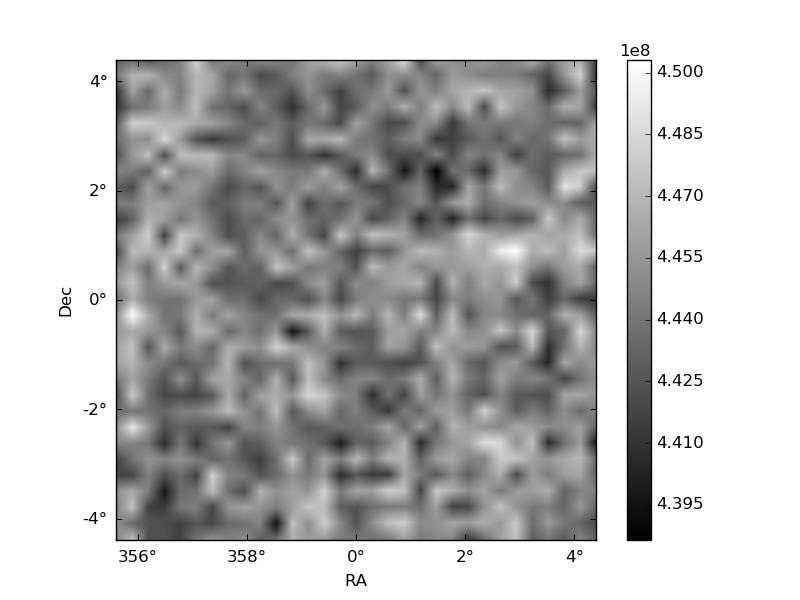
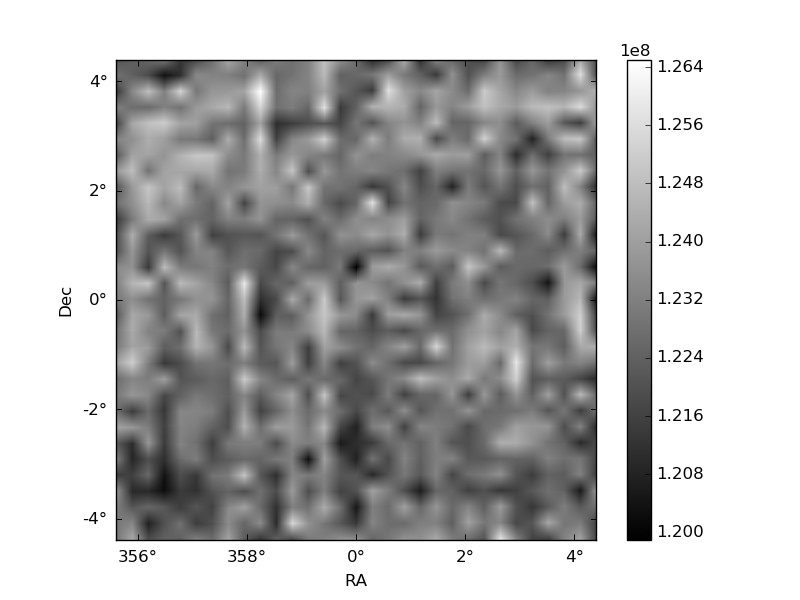
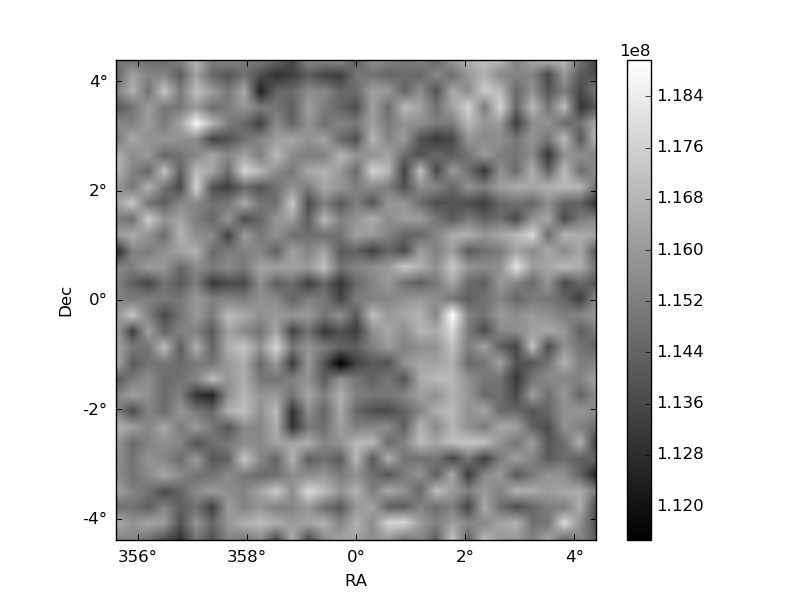
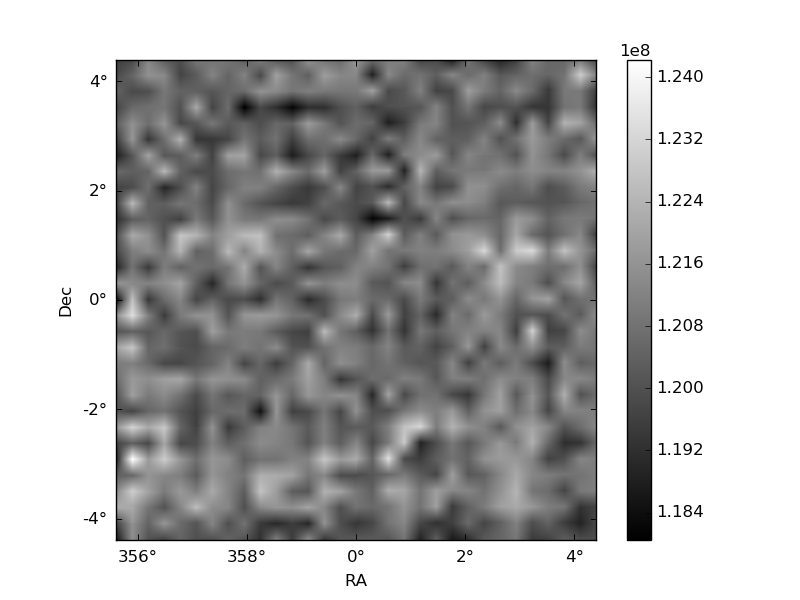
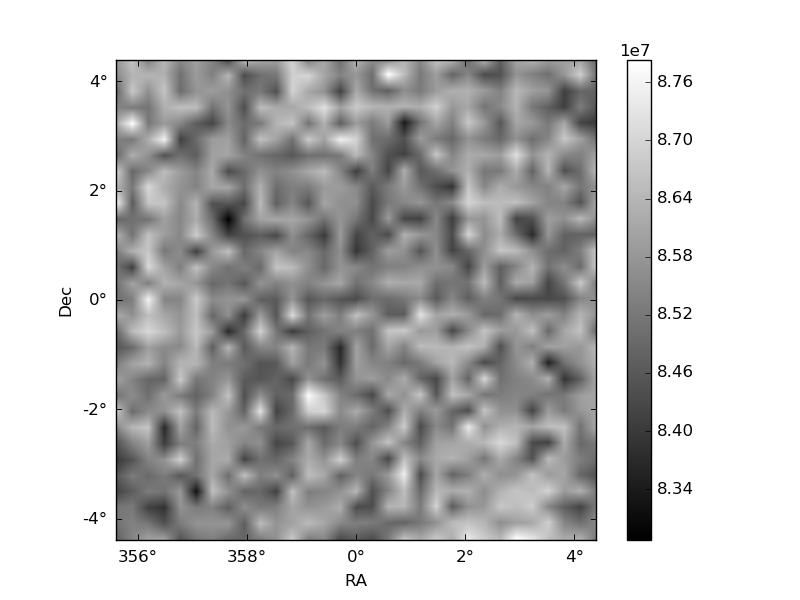
Histogram calculated using DETX and DETY for each event in the final _common_clean file
| Quadrant A | 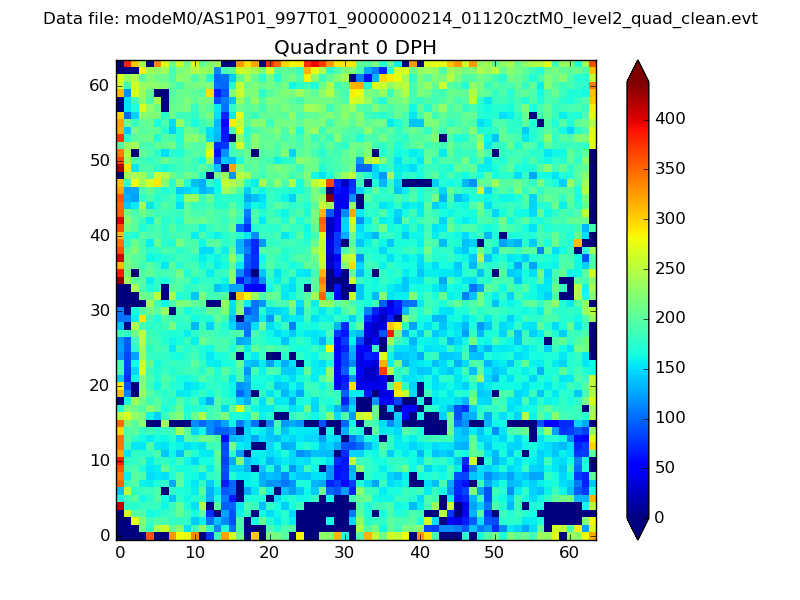 |
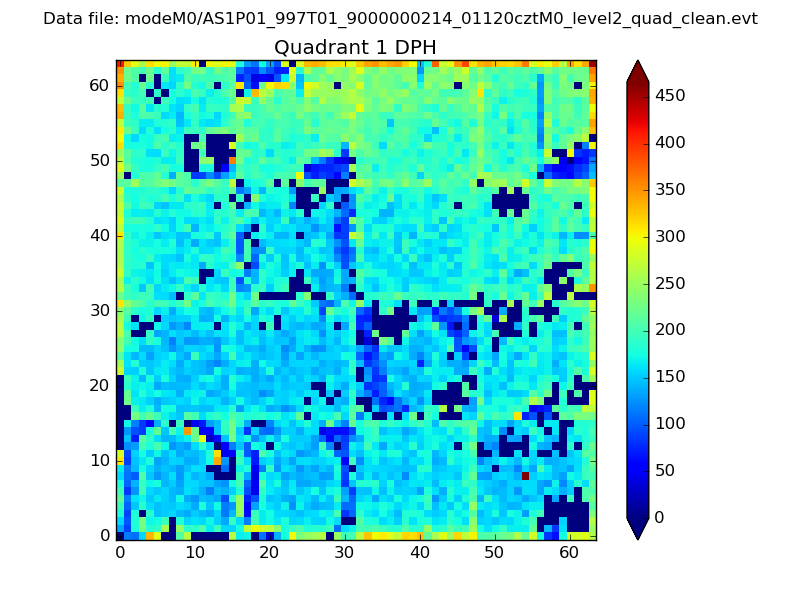 |
Quadrant B |
|---|---|---|---|
| Quadrant D | 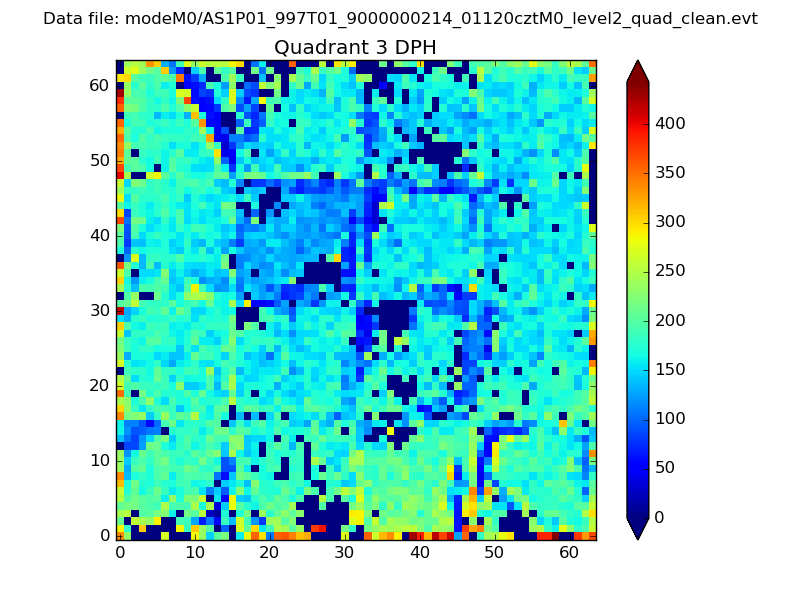 |
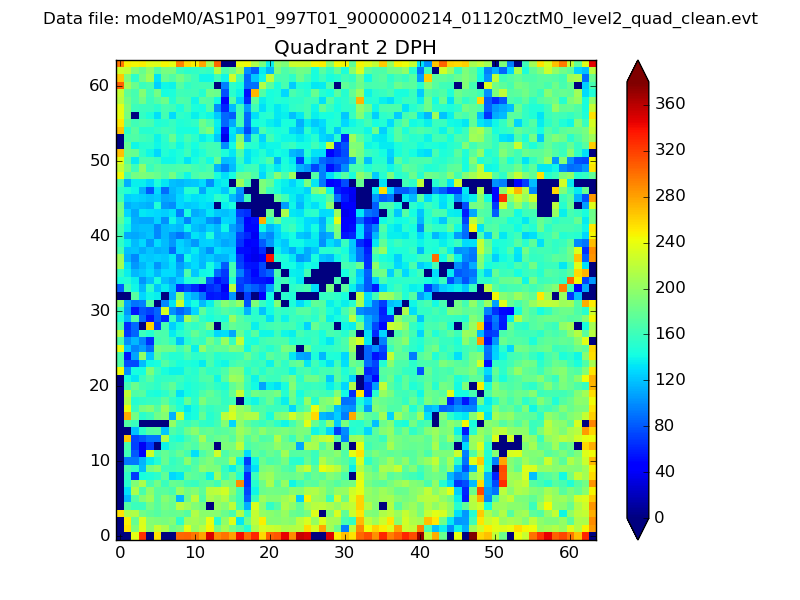 |
Quadrant C |
| Plot type | Count rate plots | Images |
|---|---|---|
| Comparison with Poisson distribution Blue bars denote a histogram of data divided into 1 sec bins. Red curve is a Poisson curve with rate = median count rate of data. |
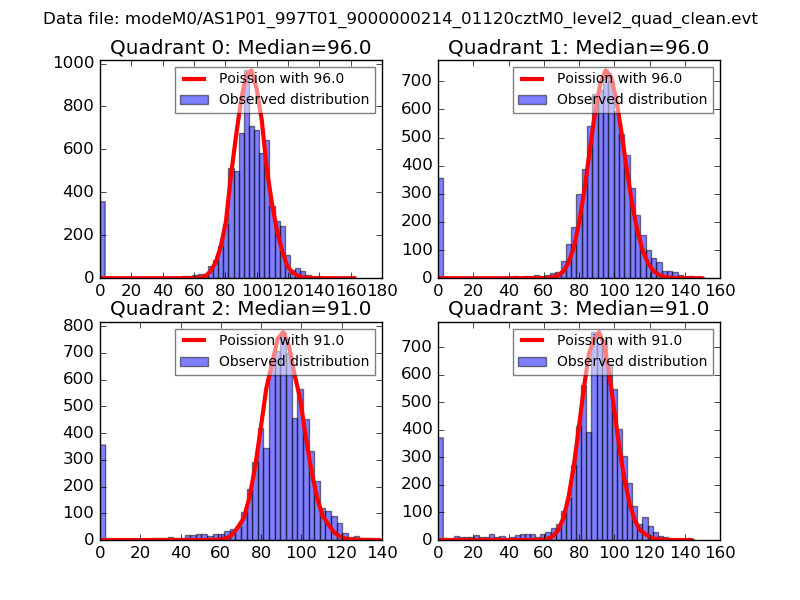 |
 |
| Quadrant-wise count rates Data is divided into 100 sec bins |
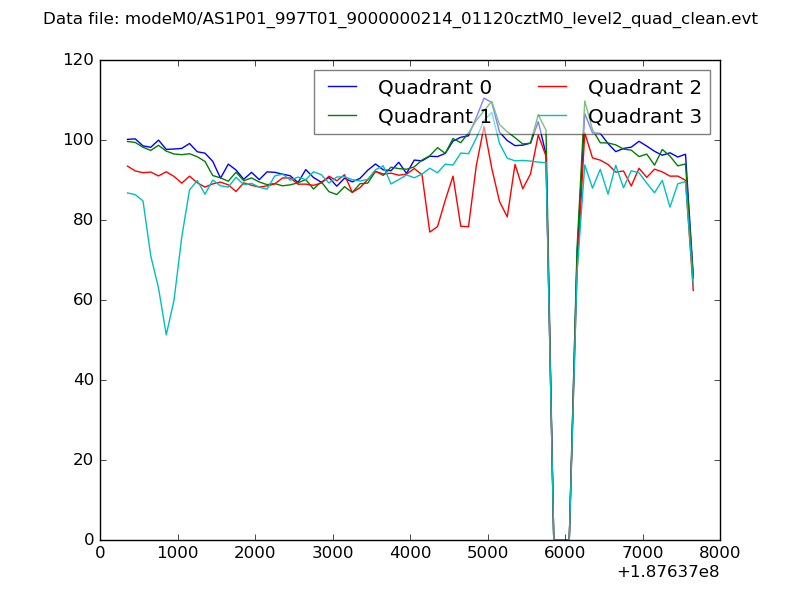 |
|
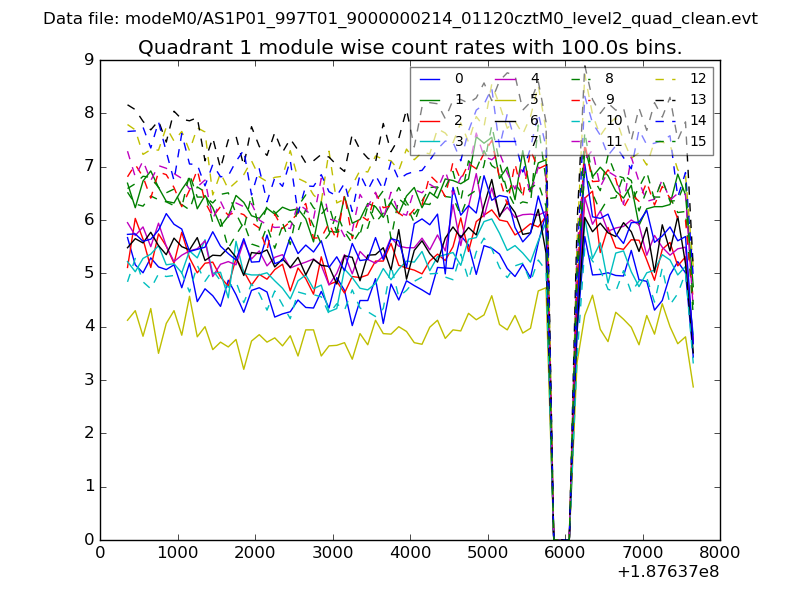
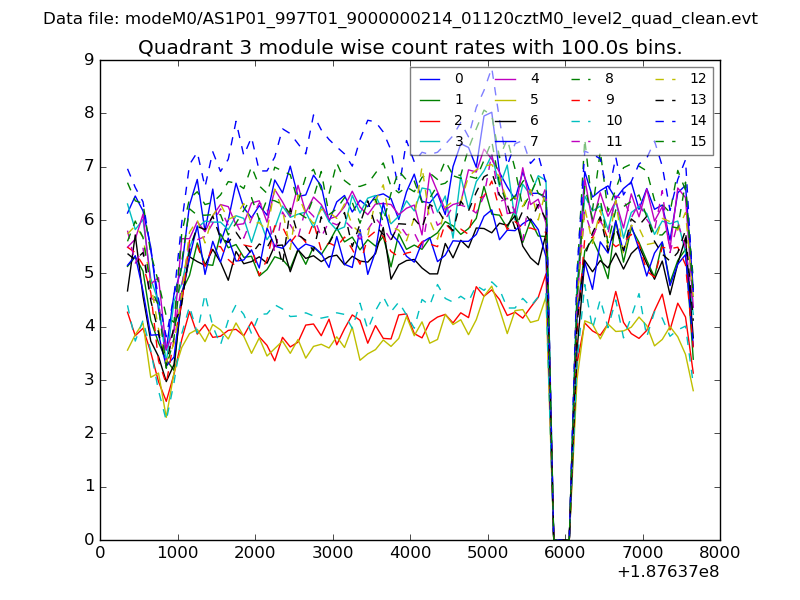
| Module-wise count rates for Quadrant A Data is divided into 100 sec bins |
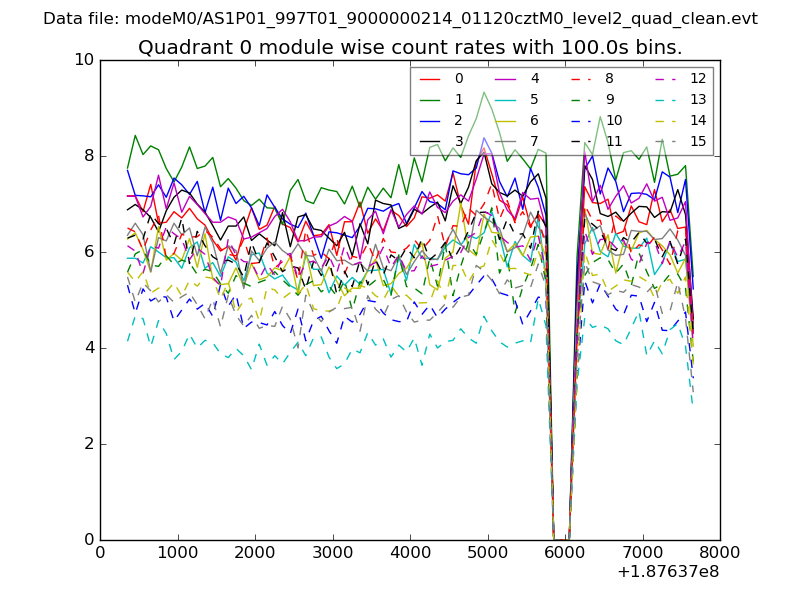 |
 |
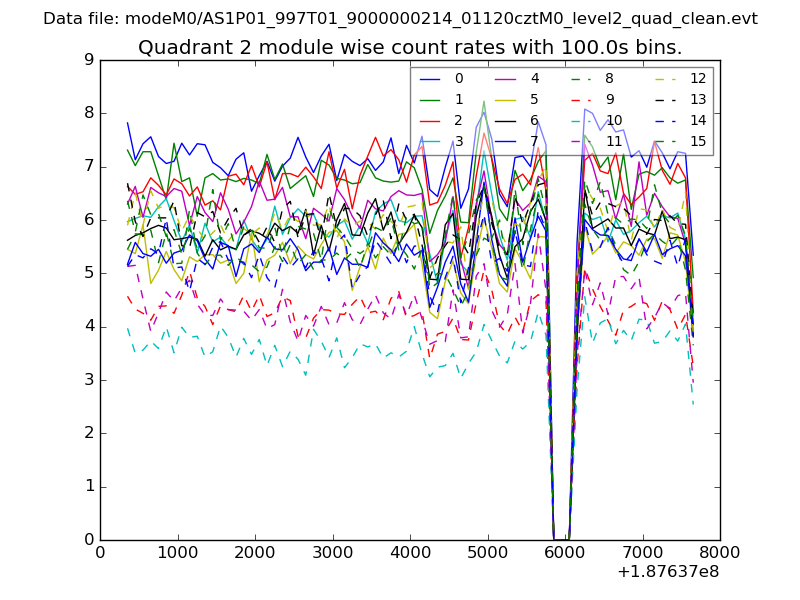
| Module-wise count rates for Quadrant B Data is divided into 100 sec bins |
 |
 |
| Module-wise count rates for Quadrant C Data is divided into 100 sec bins |
 |
 |
| Module-wise count rates for Quadrant D Data is divided into 100 sec bins |
 |
 |
| Parameter | Plot |
|---|---|
| CZT HV Monitor | 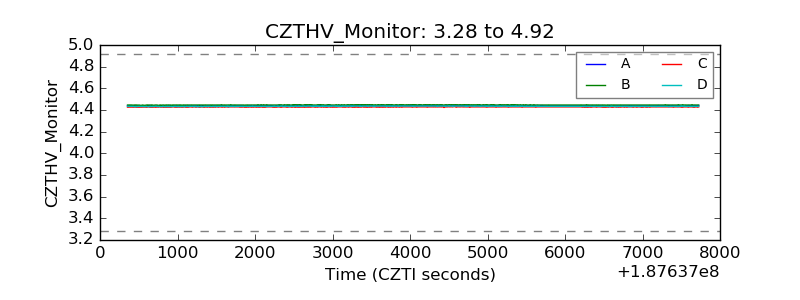 |
| D_VDD |  |
| Temperature 1 | 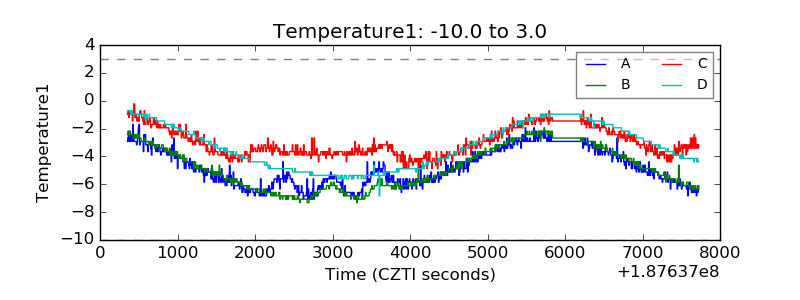 |
| Veto HV Monitor |  |
| Veto LLD | 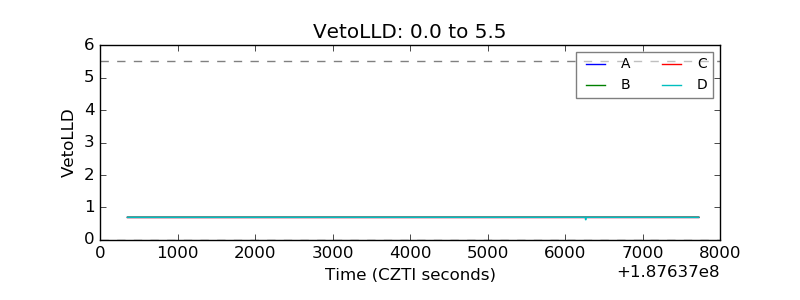 |
| Alpha Counter | 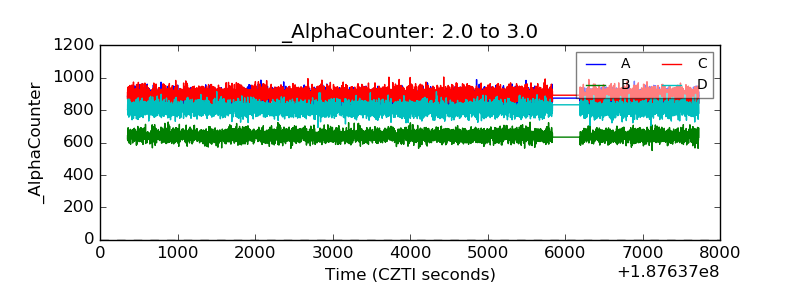 |
| _CPM_Rate | 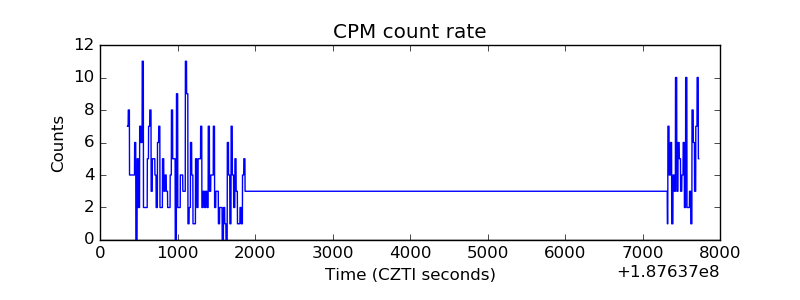 |
| CZT Counter | 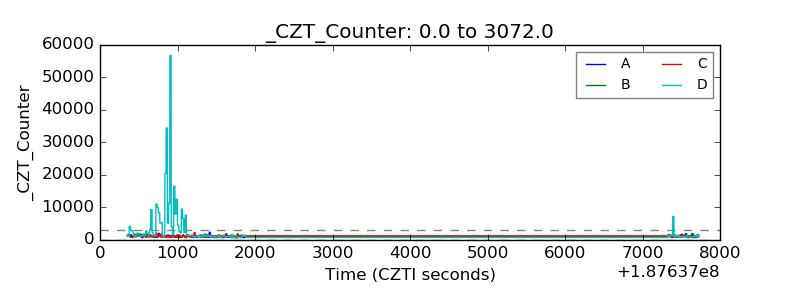 |
| +2.5 Volts monitor |  |
| +5 Volts monitor |  |
| _ROLL_ROT | 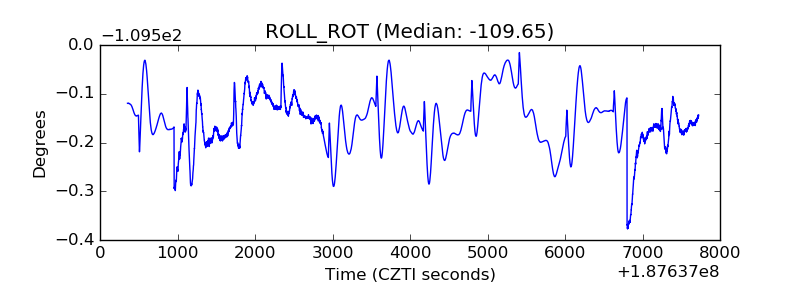 |
| _Roll_DEC | 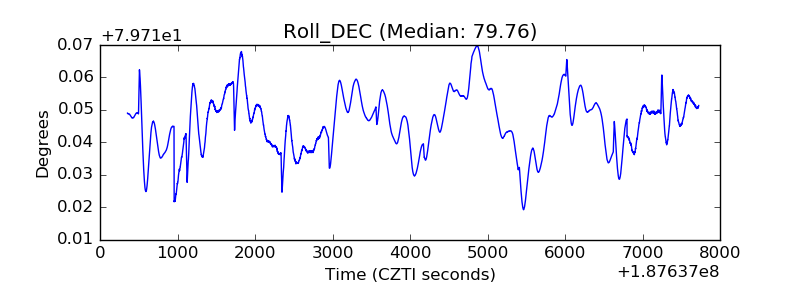 |
| _Roll_RA | 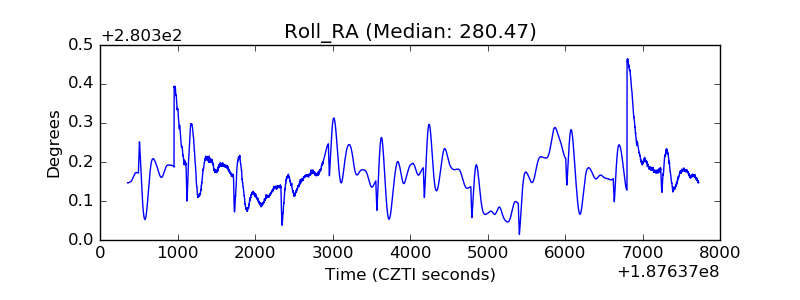 |
| Veto Counter | 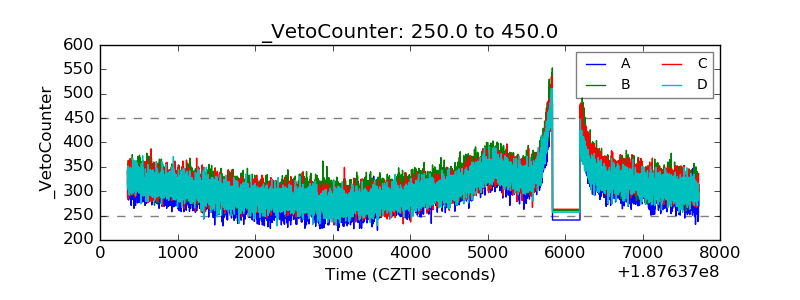 |