| Param | Original file | Final file |
|---|---|---|
| Filename | modeM0/AS1P01_997T01_9000000214_01123cztM0_level2.evt | modeM0/AS1P01_997T01_9000000214_01123cztM0_level2_quad_clean.evt |
| Size (bytes) | 1,024,482,240 | 98,078,400 |
| Size | 977.0 MB | 93.5 MB |
| Events in quadrant A | 7,597,498 | 635,208 |
| Events in quadrant B | 8,149,669 | 634,022 |
| Events in quadrant C | 8,083,632 | 620,035 |
| Events in quadrant D | 6,756,921 | 620,231 |
| Mode M9 | |||
|---|---|---|---|
| Quadrant | BADHDUFLAG | Total packets | Discarded packets |
| A | 0 | 9 | 0 |
| B | 0 | 9 | 0 |
| C | 0 | 9 | 0 |
| D | 0 | 9 | 0 |
| Mode M0 | |||
|---|---|---|---|
| Quadrant | BADHDUFLAG | Total packets | Discarded packets |
| A | 0 | 27308 | 2 |
| B | 0 | 28904 | 1 |
| C | 0 | 28704 | 1 |
| D | 0 | 24795 | 1 |
| Mode SS | |||
|---|---|---|---|
| Quadrant | BADHDUFLAG | Total packets | Discarded packets |
| A | 0 | 134 | 0 |
| B | 0 | 134 | 0 |
| C | 0 | 134 | 0 |
| D | 0 | 134 | 0 |
| Quadrant | Total seconds | Saturated seconds | Saturation percentage |
|---|---|---|---|
| A | 6610 | 1 | 0.015129% |
| B | 6610 | 10 | 0.151286% |
| C | 6610 | 40 | 0.605144% |
| D | 6610 | 1 | 0.015129% |
Noise dominated data is calculated using 1-second bins in cleaned event files. If a bin has >2000 counts, and if more than 50% of those come from <1% of pixels, then it is considered to be noise-dominated and hence unusable.
| Quadrant | # 1 sec bins | Bins with >0 counts | Bins with >2000 counts | High rate bins dominated by noise | Noise dominated (total time) | Noise dominated (detector-on time) | Marked lightcurve |
|---|---|---|---|---|---|---|---|
| A | 7510 | 6611 | 112 | 112 | 1.49% | 1.69% | 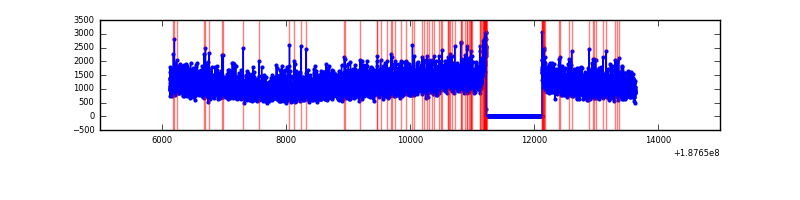 |
| B | 7510 | 6611 | 168 | 168 | 2.24% | 2.54% | 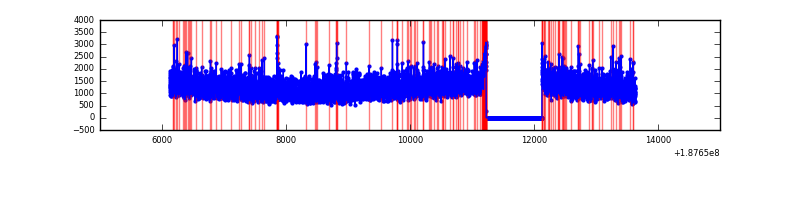 |
| C | 7510 | 6611 | 232 | 232 | 3.09% | 3.51% |  |
| D | 7510 | 6611 | 45 | 45 | 0.60% | 0.68% | 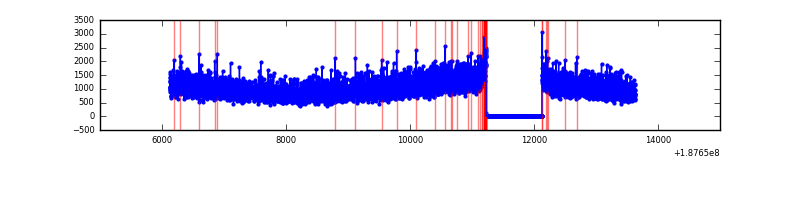 |
Top three noisy pixels from each quadrant. If the there are fewer than three noisy pixels in the level2.evt file, extra rows are filled as -1
| Pixel properties | Quadrant properties | ||||||
|---|---|---|---|---|---|---|---|
| Quadrant | DetID | PixID | Counts | Sigma | Mean | Median | Sigma |
| A | 11 | 79 | 8301 | 13.24 | 1977 | 1997 | 476.1 |
| A | 12 | 251 | 8043 | 12.7 | 1977 | 1997 | 476.1 |
| A | 3 | 111 | 6394 | 9.23 | 1977 | 1997 | 476.1 |
| B | 0 | 216 | 76025 | 151.68 | 2080 | 2089 | 487.4 |
| B | 15 | 22 | 40093 | 77.97 | 2080 | 2089 | 487.4 |
| B | 0 | 190 | 34121 | 65.71 | 2080 | 2089 | 487.4 |
| C | 15 | 241 | 336922 | 635.55 | 1884 | 1951 | 527.1 |
| C | 9 | 54 | 183666 | 344.77 | 1884 | 1951 | 527.1 |
| C | 5 | 234 | 162709 | 305.01 | 1884 | 1951 | 527.1 |
| D | 10 | 125 | 23940 | 39.74 | 1798 | 1855 | 555.7 |
| D | 2 | 16 | 10385 | 15.35 | 1798 | 1855 | 555.7 |
| D | 13 | 189 | 8522 | 12.0 | 1798 | 1855 | 555.7 |
Histogram calculated using DETX and DETY for each event in the final _common_clean file
| Quadrant A | 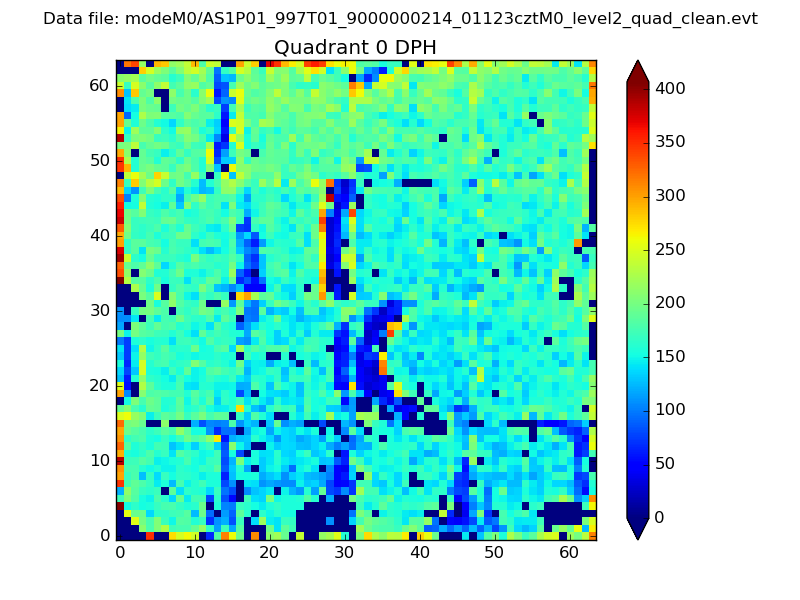 |
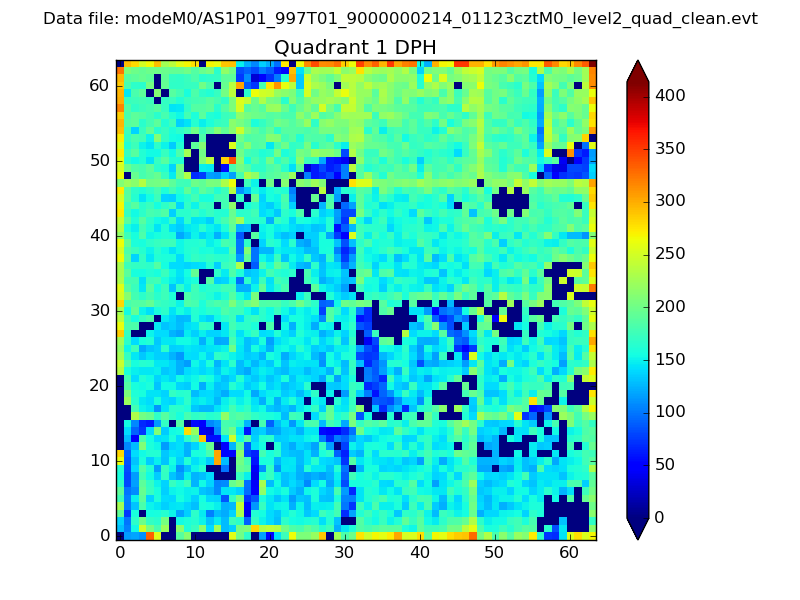 |
Quadrant B |
|---|---|---|---|
| Quadrant D | 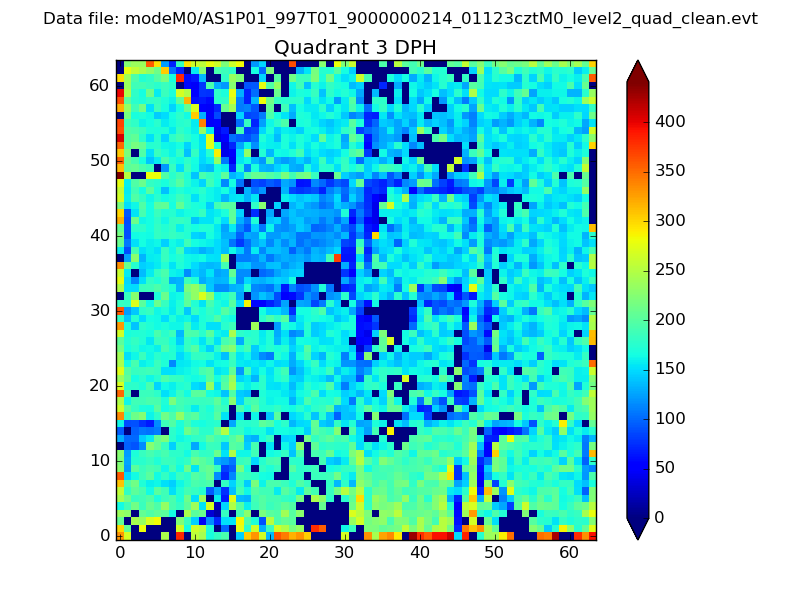 |
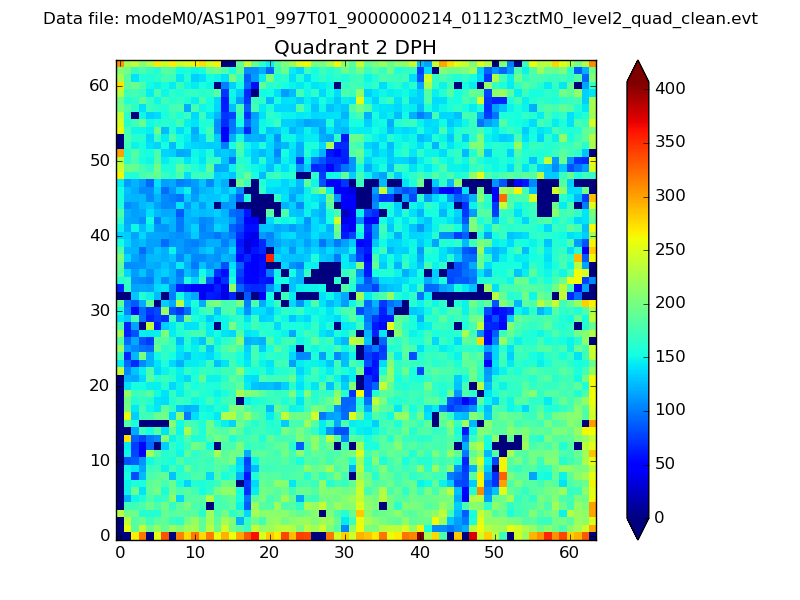 |
Quadrant C |
| Plot type | Count rate plots | Images |
|---|---|---|
| Comparison with Poisson distribution Blue bars denote a histogram of data divided into 1 sec bins. Red curve is a Poisson curve with rate = median count rate of data. |
 |
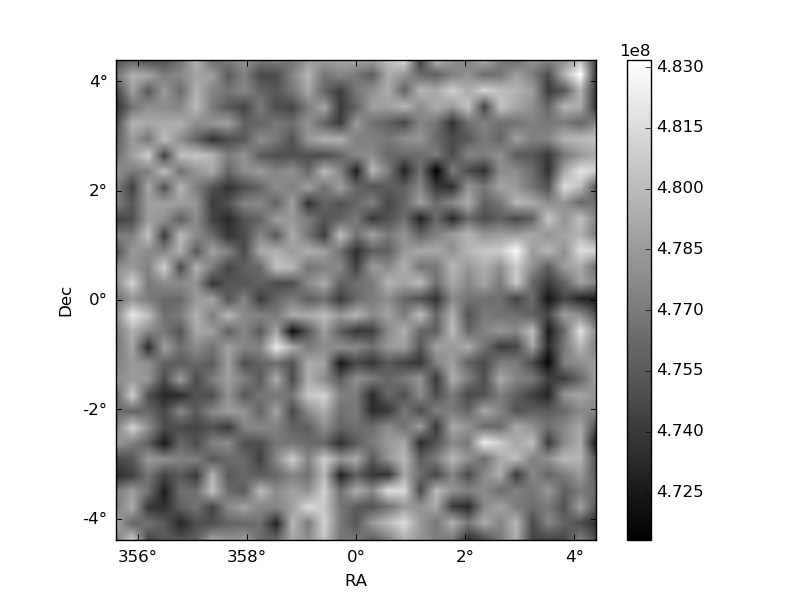 |
| Quadrant-wise count rates Data is divided into 100 sec bins |
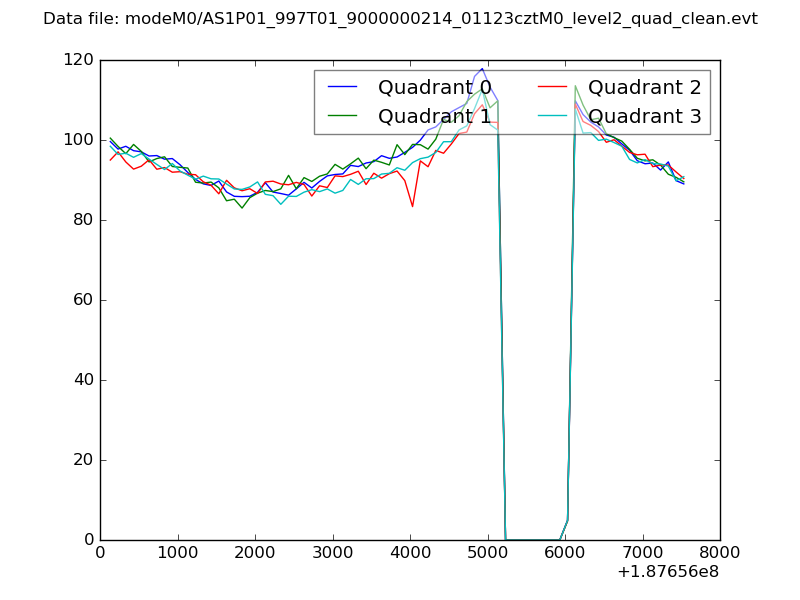 |
|
| Module-wise count rates for Quadrant A Data is divided into 100 sec bins |
 |
 |
| Module-wise count rates for Quadrant B Data is divided into 100 sec bins |
 |
 |
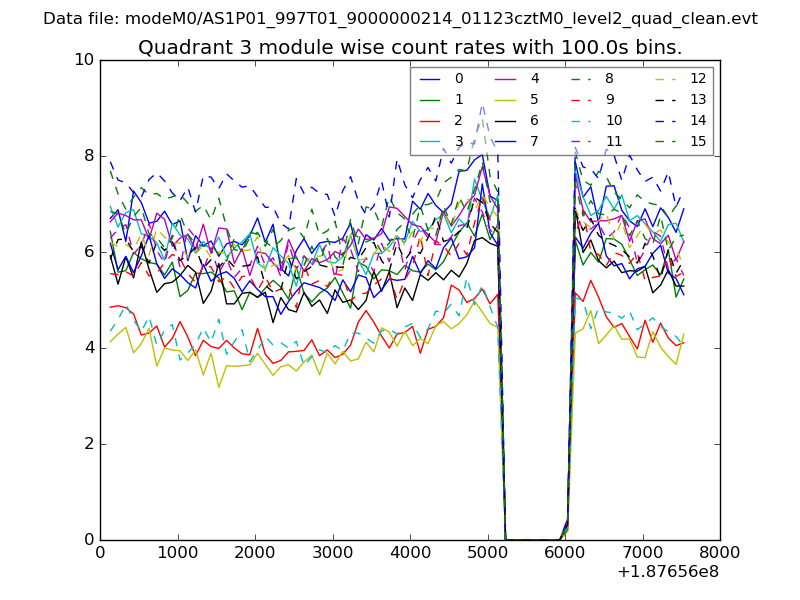
| Module-wise count rates for Quadrant C Data is divided into 100 sec bins |
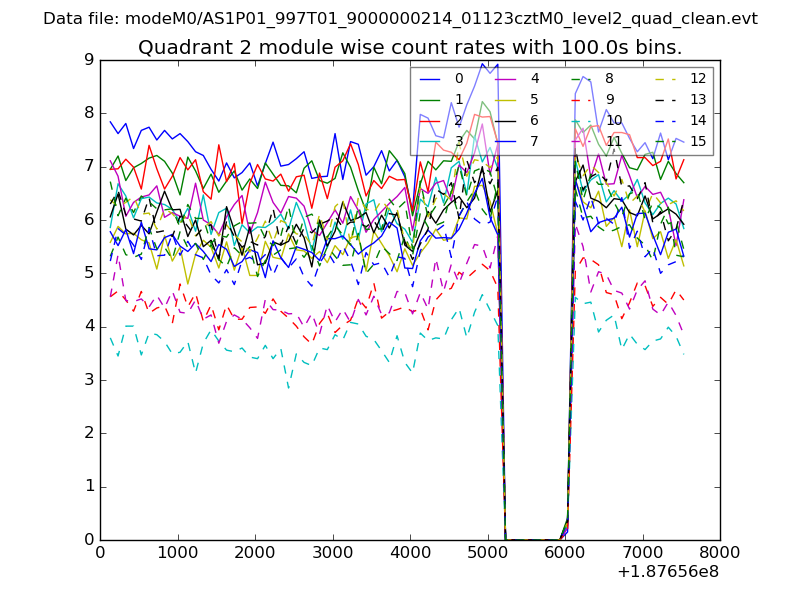 |
 |
| Module-wise count rates for Quadrant D Data is divided into 100 sec bins |
 |
 |
| Parameter | Plot |
|---|---|
| CZT HV Monitor | 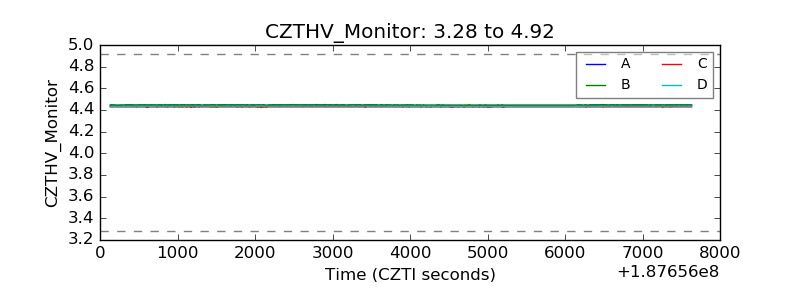 |
| D_VDD | 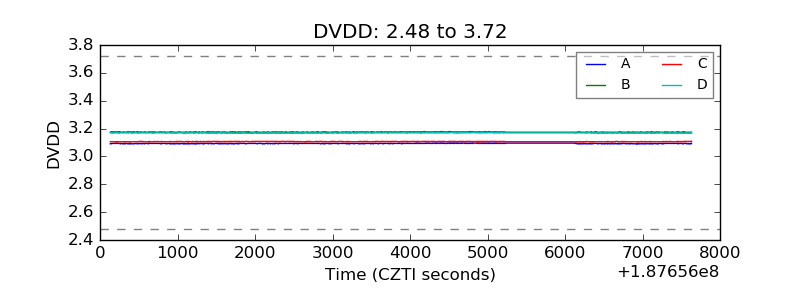 |
| Temperature 1 | 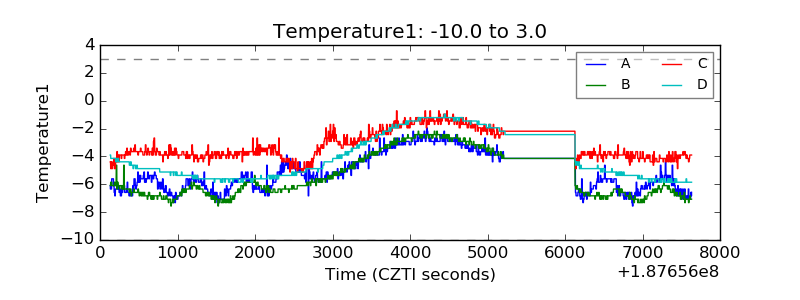 |
| Veto HV Monitor | 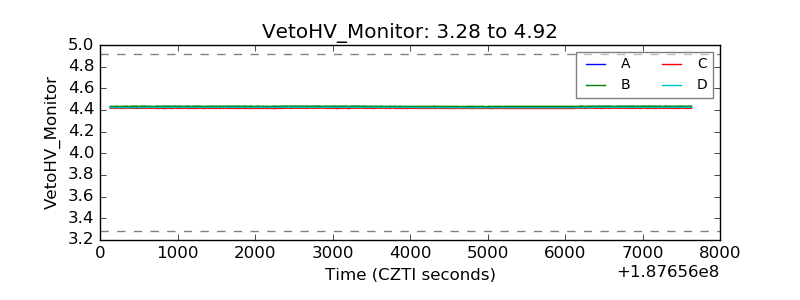 |
| Veto LLD | 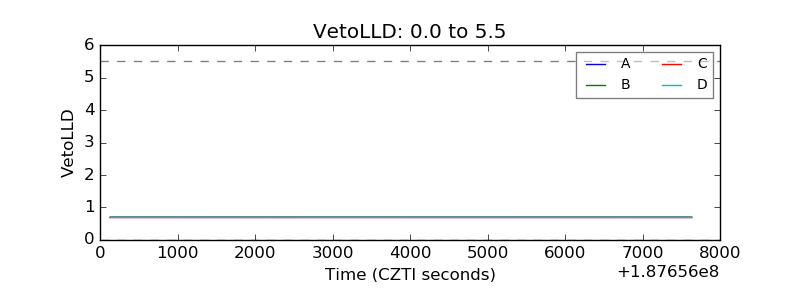 |
| Alpha Counter | 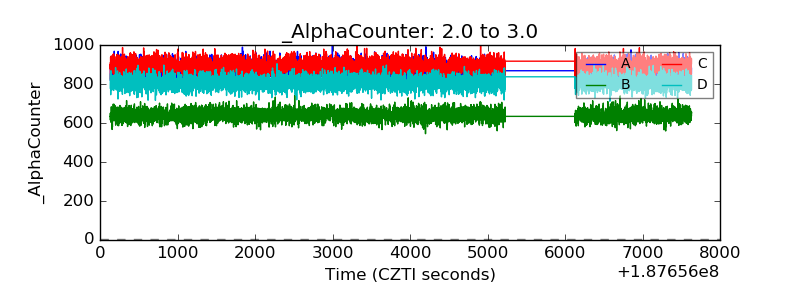 |
| _CPM_Rate | 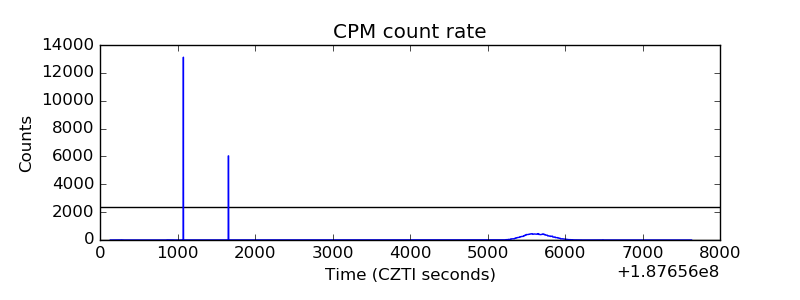 |
| CZT Counter | 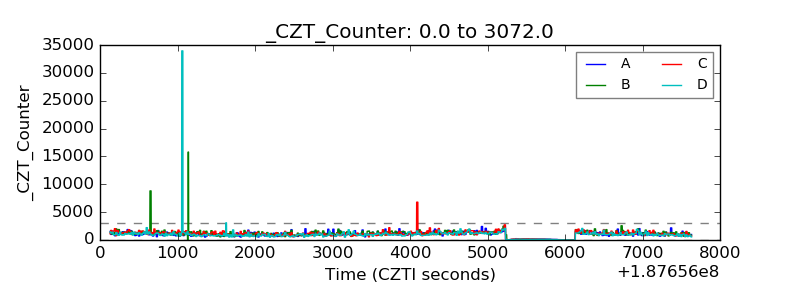 |
| +2.5 Volts monitor |  |
| +5 Volts monitor |  |
| _ROLL_ROT | 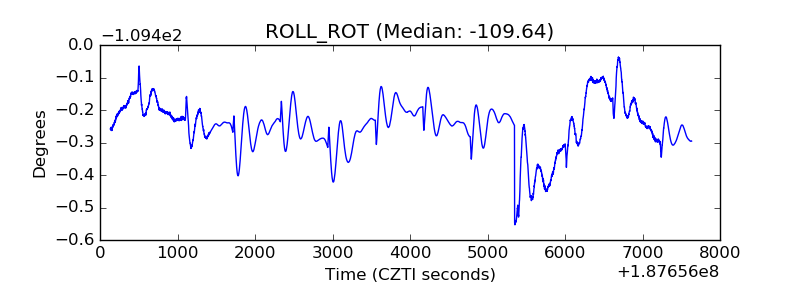 |
| _Roll_DEC | 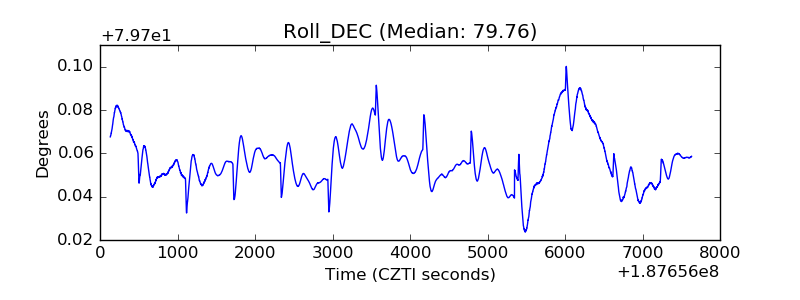 |
| _Roll_RA | 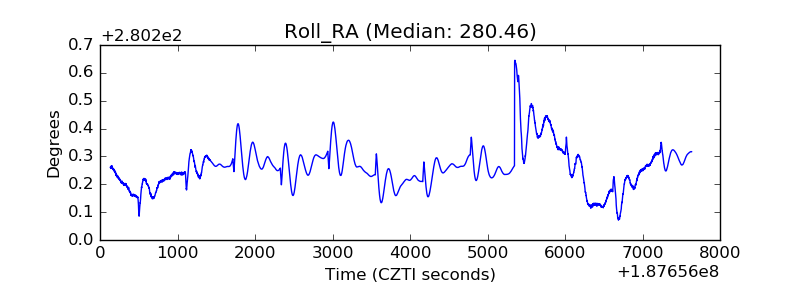 |
| Veto Counter | 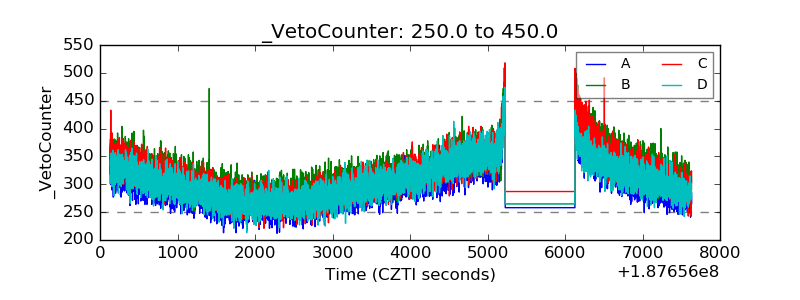 |