| Param | Original file | Final file |
|---|---|---|
| Filename | modeM0/AS1P01_997T01_9000000214_01127cztM0_level2.evt | modeM0/AS1P01_997T01_9000000214_01127cztM0_level2_quad_clean.evt |
| Size (bytes) | 4,245,462,720 | 414,403,200 |
| Size | 4.0 GB | 395.2 MB |
| Events in quadrant A | 31,818,794 | 2,708,585 |
| Events in quadrant B | 33,696,012 | 2,708,912 |
| Events in quadrant C | 32,669,245 | 2,635,159 |
| Events in quadrant D | 28,575,457 | 2,609,034 |
| Mode M9 | |||
|---|---|---|---|
| Quadrant | BADHDUFLAG | Total packets | Discarded packets |
| A | 0 | 50 | 0 |
| B | 0 | 50 | 0 |
| C | 0 | 50 | 0 |
| D | 0 | 50 | 0 |
| Mode M0 | |||
|---|---|---|---|
| Quadrant | BADHDUFLAG | Total packets | Discarded packets |
| A | 0 | 114046 | 6 |
| B | 0 | 119667 | 5 |
| C | 0 | 116564 | 5 |
| D | 0 | 104671 | 5 |
| Mode SS | |||
|---|---|---|---|
| Quadrant | BADHDUFLAG | Total packets | Discarded packets |
| A | 0 | 560 | 0 |
| B | 0 | 560 | 0 |
| C | 0 | 560 | 0 |
| D | 0 | 560 | 0 |
| Quadrant | Total seconds | Saturated seconds | Saturation percentage |
|---|---|---|---|
| A | 27505 | 21 | 0.076350% |
| B | 27505 | 82 | 0.298128% |
| C | 27505 | 65 | 0.236321% |
| D | 27505 | 81 | 0.294492% |
Noise dominated data is calculated using 1-second bins in cleaned event files. If a bin has >2000 counts, and if more than 50% of those come from <1% of pixels, then it is considered to be noise-dominated and hence unusable.
| Quadrant | # 1 sec bins | Bins with >0 counts | Bins with >2000 counts | High rate bins dominated by noise | Noise dominated (total time) | Noise dominated (detector-on time) | Marked lightcurve |
|---|---|---|---|---|---|---|---|
| A | 32495 | 27509 | 511 | 511 | 1.57% | 1.86% | 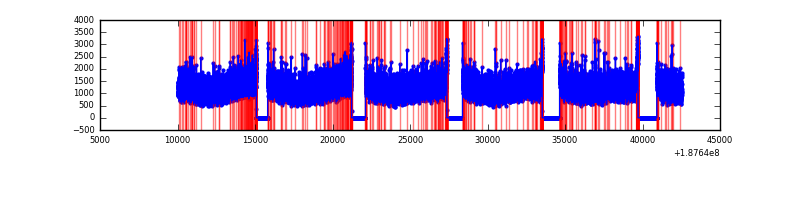 |
| B | 32495 | 27509 | 808 | 808 | 2.49% | 2.94% | 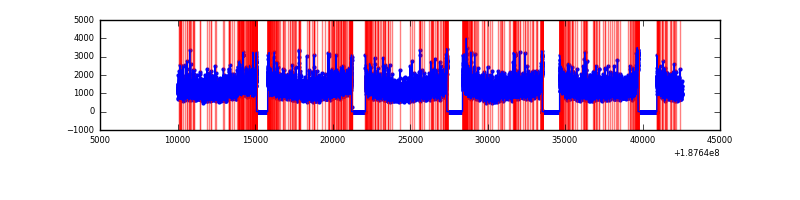 |
| C | 32495 | 27509 | 800 | 800 | 2.46% | 2.91% | 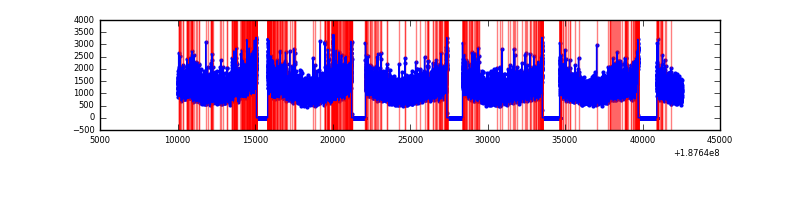 |
| D | 32495 | 27509 | 353 | 353 | 1.09% | 1.28% | 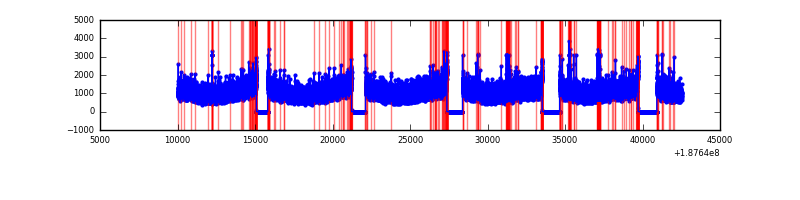 |
Top three noisy pixels from each quadrant. If the there are fewer than three noisy pixels in the level2.evt file, extra rows are filled as -1
| Pixel properties | Quadrant properties | ||||||
|---|---|---|---|---|---|---|---|
| Quadrant | DetID | PixID | Counts | Sigma | Mean | Median | Sigma |
| A | 15 | 233 | 35625 | 13.78 | 8264 | 8326 | 1980.5 |
| A | 0 | 175 | 35448 | 13.69 | 8264 | 8326 | 1980.5 |
| A | 11 | 79 | 30901 | 11.4 | 8264 | 8326 | 1980.5 |
| B | 8 | 4 | 268769 | 129.23 | 8603 | 8653 | 2012.8 |
| B | 15 | 22 | 242348 | 116.1 | 8603 | 8653 | 2012.8 |
| B | 0 | 190 | 116093 | 53.38 | 8603 | 8653 | 2012.8 |
| C | 15 | 241 | 1400700 | 647.58 | 7744 | 8003 | 2150.6 |
| C | 5 | 234 | 623002 | 285.96 | 7744 | 8003 | 2150.6 |
| C | 9 | 54 | 213084 | 95.36 | 7744 | 8003 | 2150.6 |
| D | 10 | 125 | 133348 | 56.43 | 7575 | 7790 | 2224.8 |
| D | 2 | 16 | 78856 | 31.94 | 7575 | 7790 | 2224.8 |
| D | 10 | 85 | 43726 | 16.15 | 7575 | 7790 | 2224.8 |
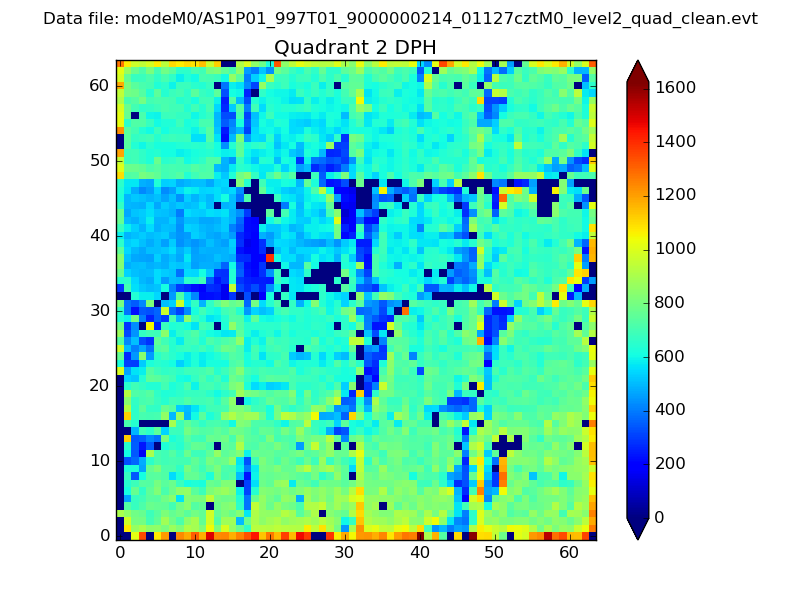
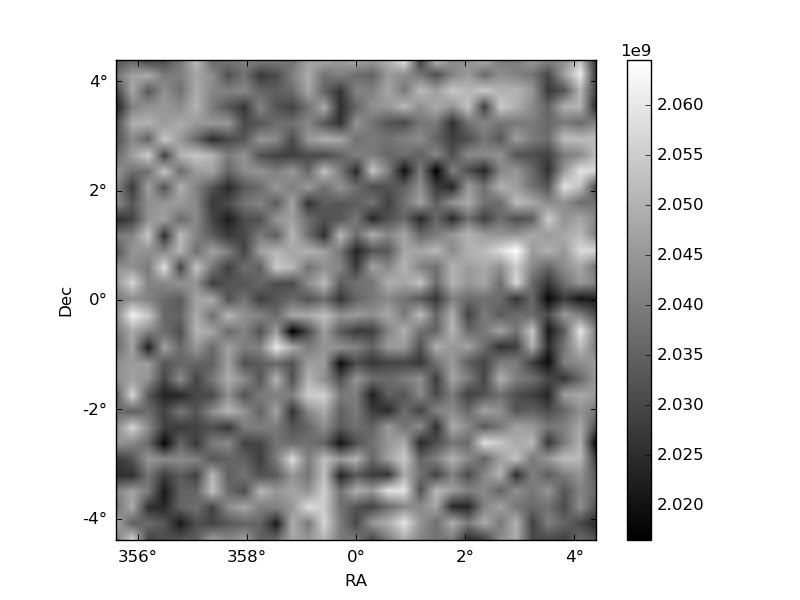
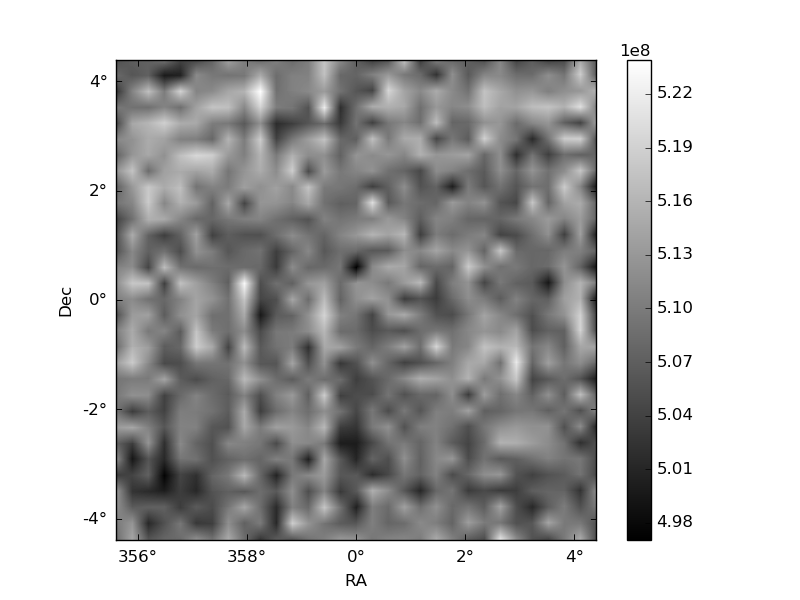
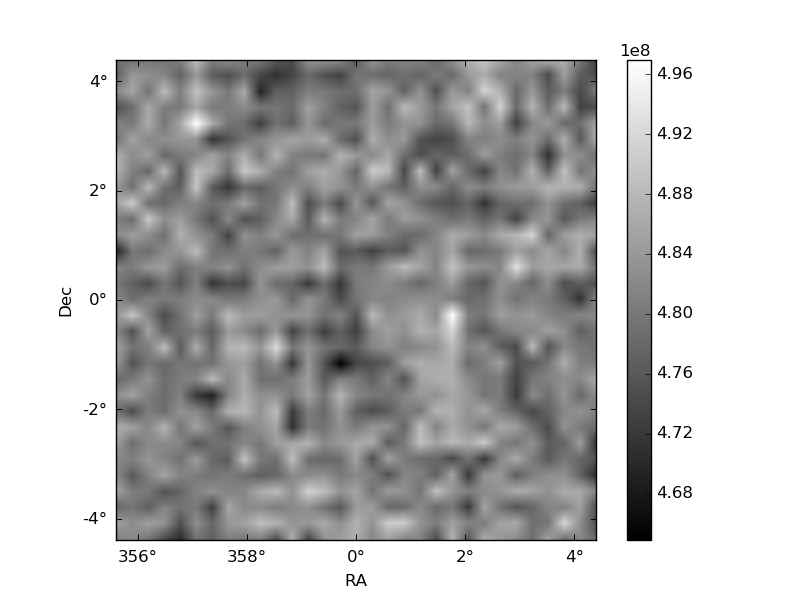
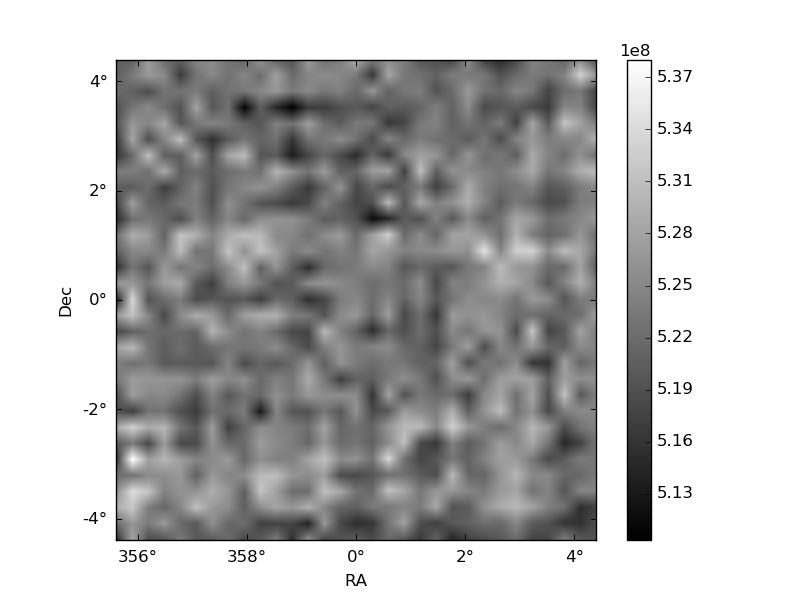
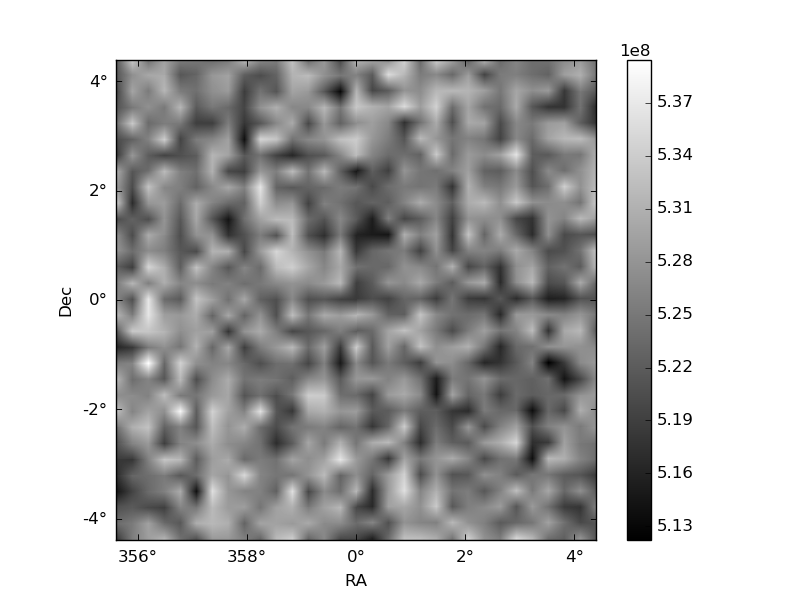
Histogram calculated using DETX and DETY for each event in the final _common_clean file
| Quadrant A | 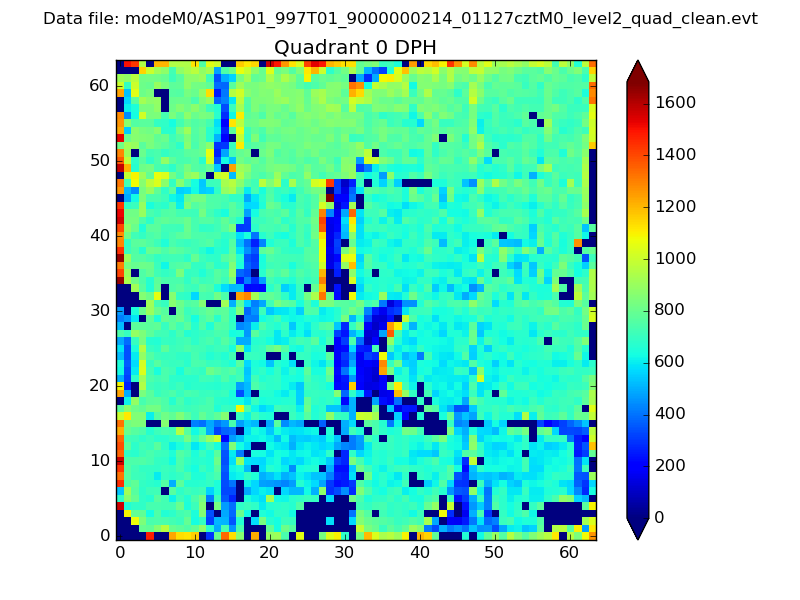 |
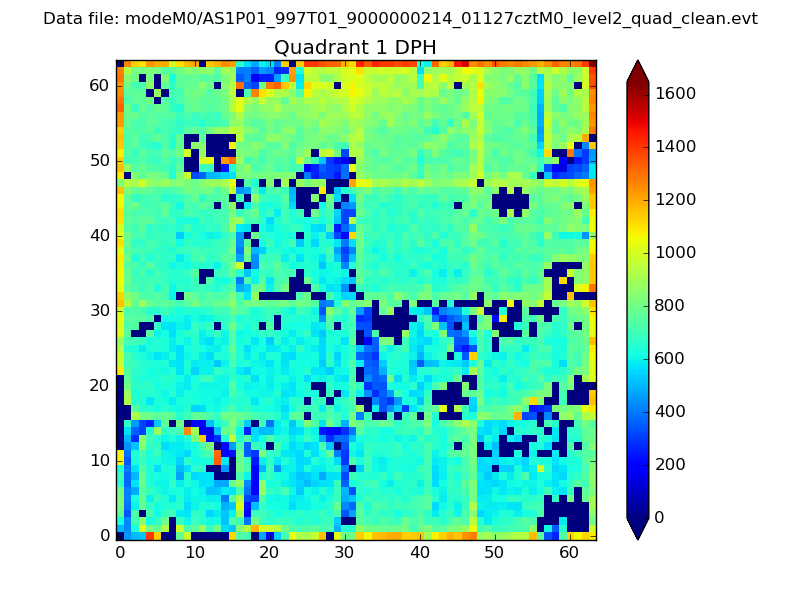 |
Quadrant B |
|---|---|---|---|
| Quadrant D | 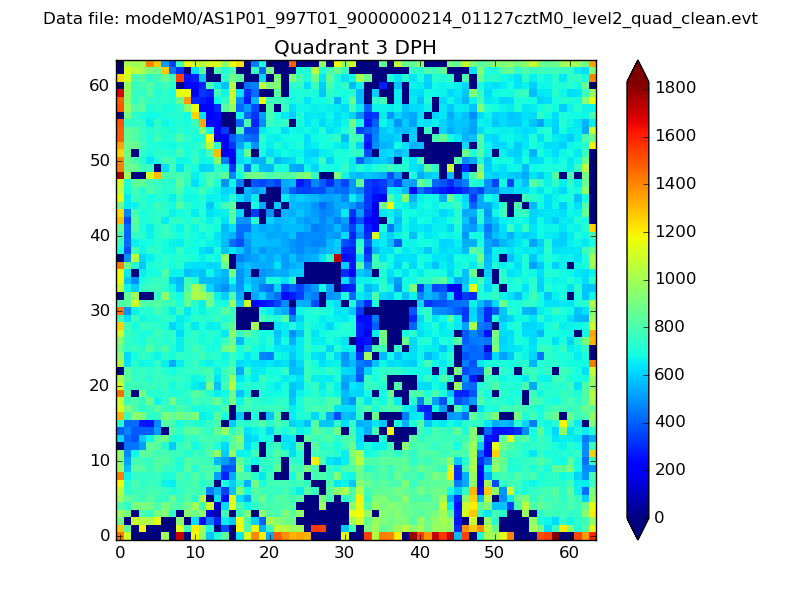 |
 |
Quadrant C |
| Plot type | Count rate plots | Images |
|---|---|---|
| Comparison with Poisson distribution Blue bars denote a histogram of data divided into 1 sec bins. Red curve is a Poisson curve with rate = median count rate of data. |
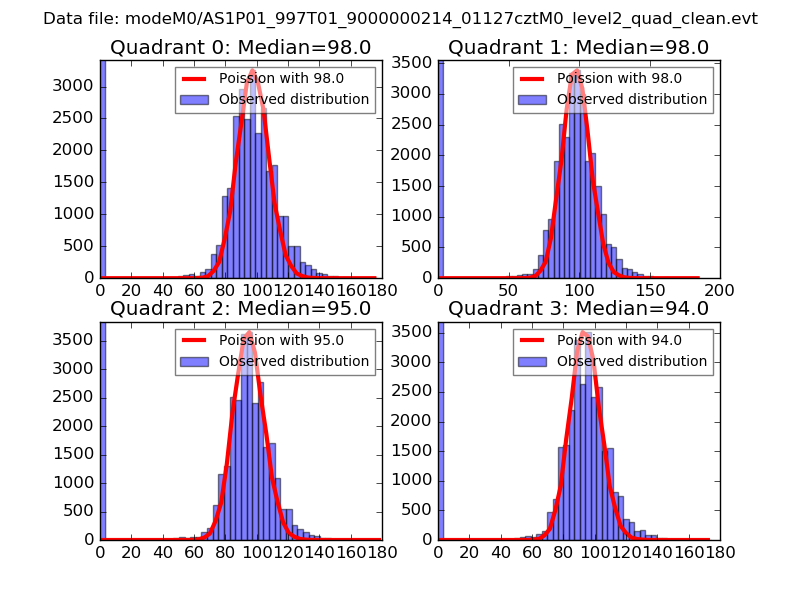 |
 |
| Quadrant-wise count rates Data is divided into 100 sec bins |
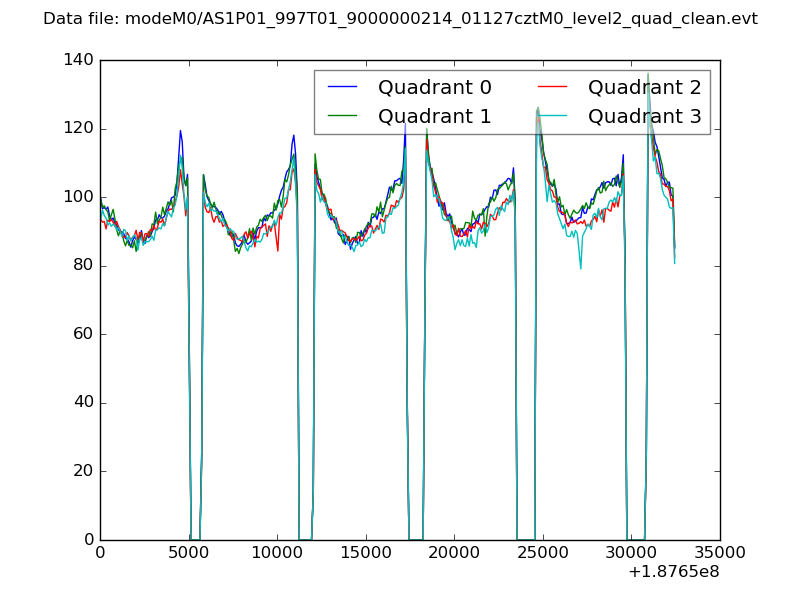 |
|
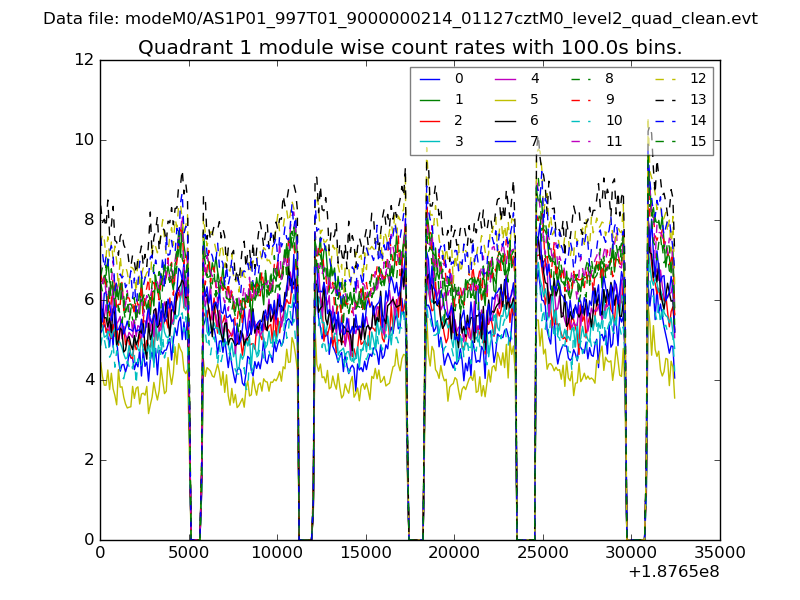
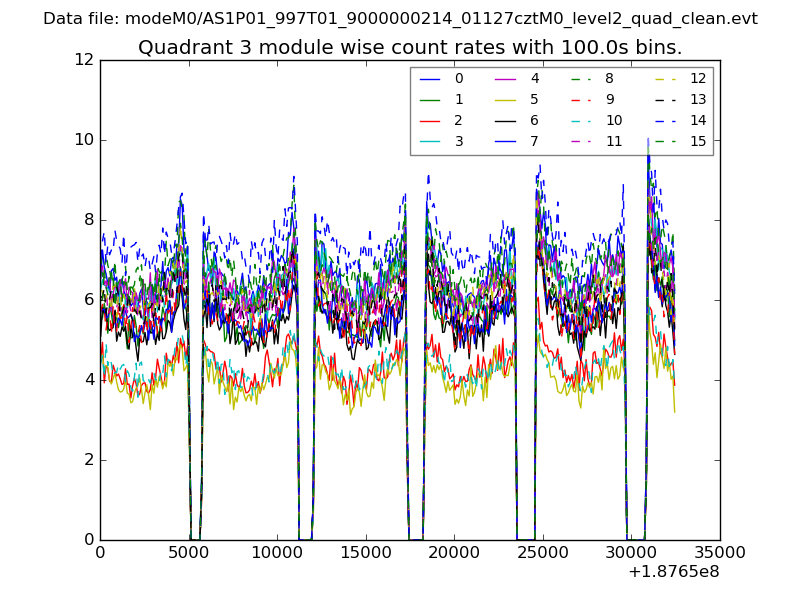
| Module-wise count rates for Quadrant A Data is divided into 100 sec bins |
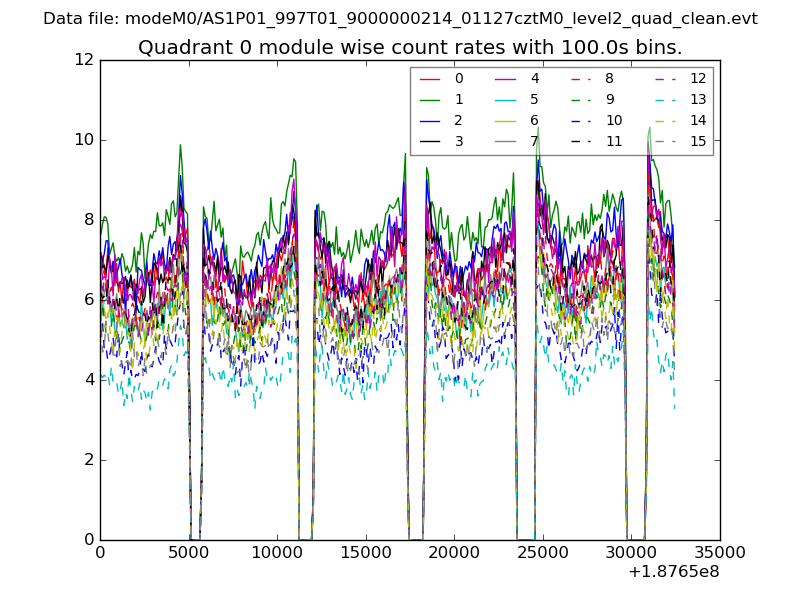 |
 |
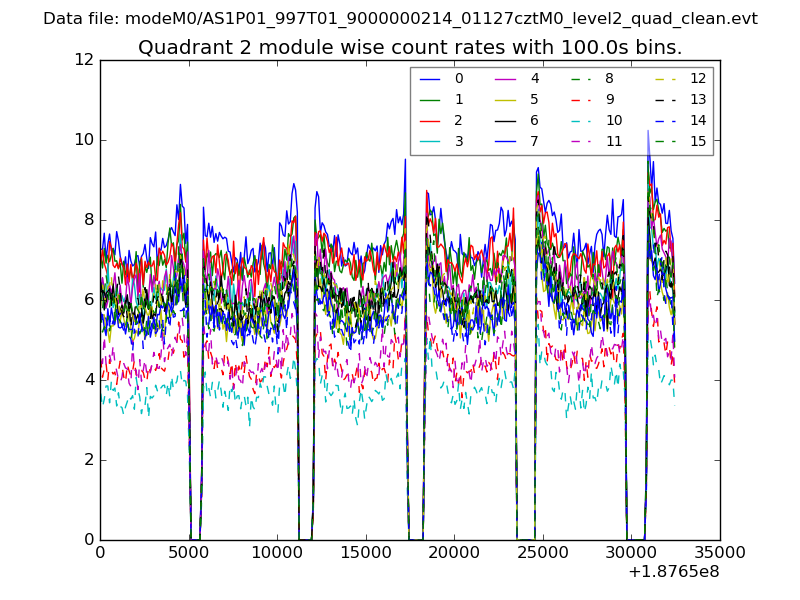
| Module-wise count rates for Quadrant B Data is divided into 100 sec bins |
 |
 |
| Module-wise count rates for Quadrant C Data is divided into 100 sec bins |
 |
 |
| Module-wise count rates for Quadrant D Data is divided into 100 sec bins |
 |
 |
| Parameter | Plot |
|---|---|
| CZT HV Monitor | 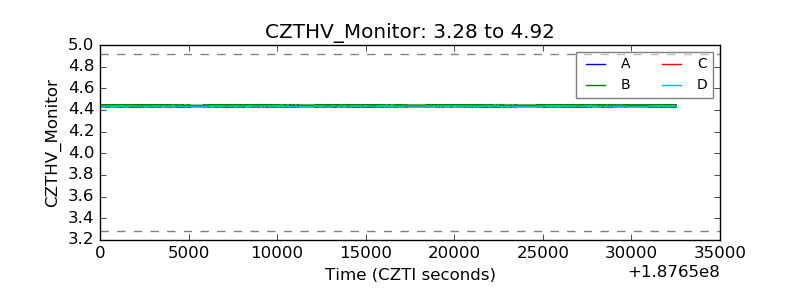 |
| D_VDD | 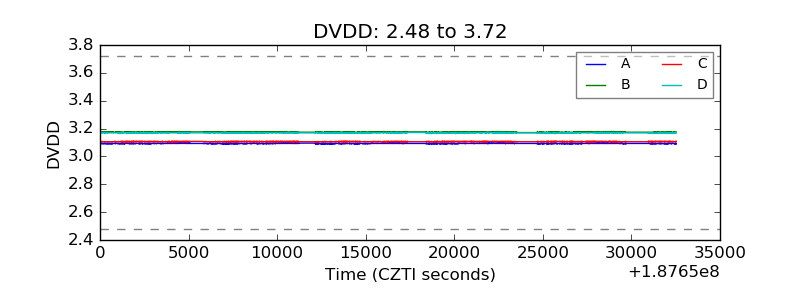 |
| Temperature 1 | 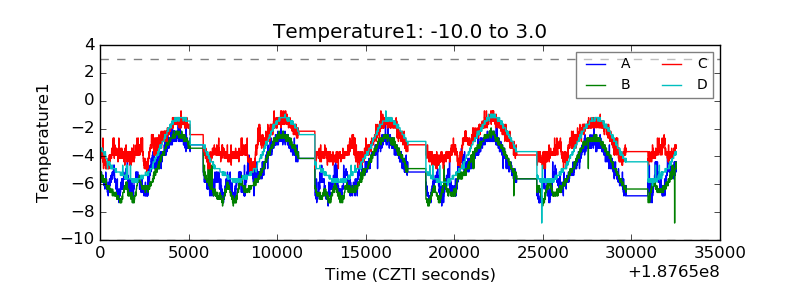 |
| Veto HV Monitor | 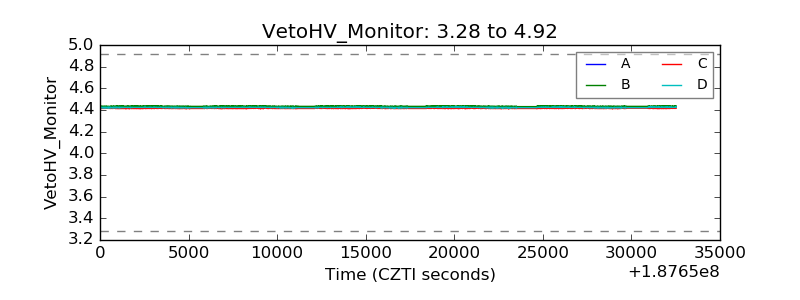 |
| Veto LLD | 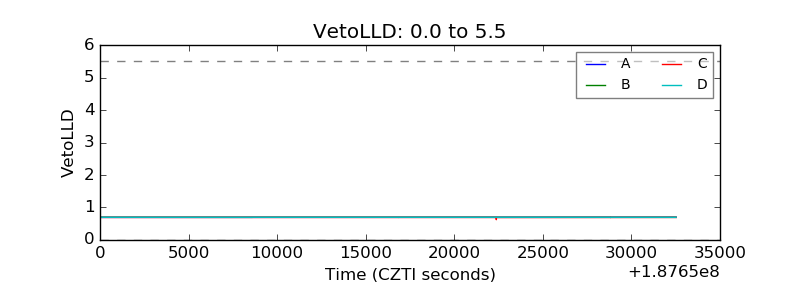 |
| Alpha Counter | 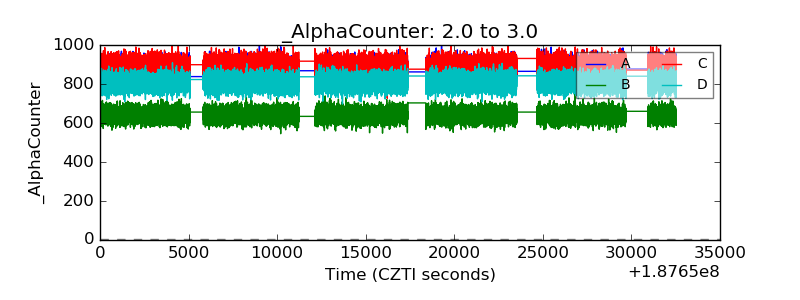 |
| _CPM_Rate | 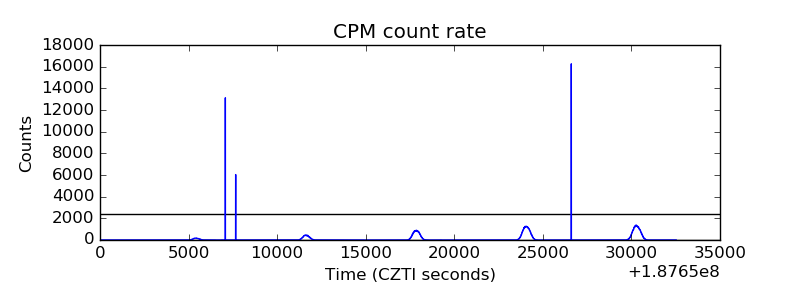 |
| CZT Counter | 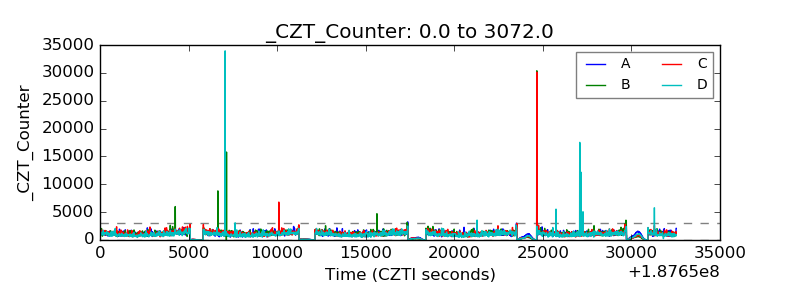 |
| +2.5 Volts monitor |  |
| +5 Volts monitor |  |
| _ROLL_ROT | 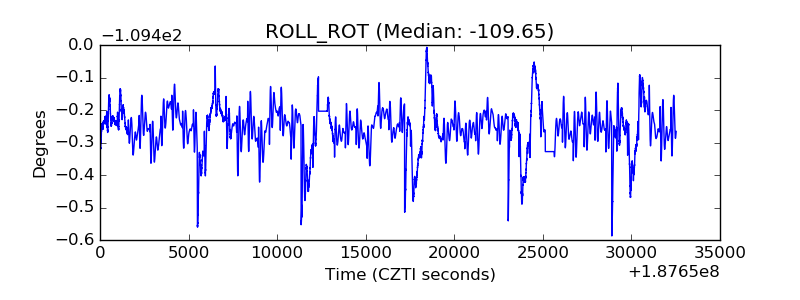 |
| _Roll_DEC |  |
| _Roll_RA | 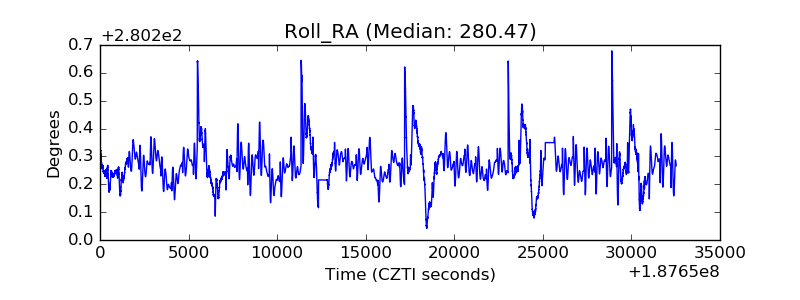 |
| Veto Counter | 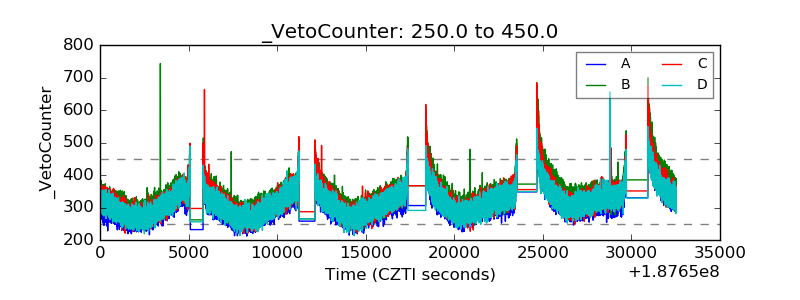 |