| Param | Original file | Final file |
|---|---|---|
| Filename | modeM0/AS1P01_997T01_9000000214_01128cztM0_level2.evt | modeM0/AS1P01_997T01_9000000214_01128cztM0_level2_quad_clean.evt |
| Size (bytes) | 931,440,960 | 95,912,640 |
| Size | 888.3 MB | 91.5 MB |
| Events in quadrant A | 7,077,724 | 637,341 |
| Events in quadrant B | 7,389,948 | 638,121 |
| Events in quadrant C | 6,963,098 | 608,046 |
| Events in quadrant D | 6,380,233 | 603,035 |
| Mode M9 | |||
|---|---|---|---|
| Quadrant | BADHDUFLAG | Total packets | Discarded packets |
| A | 0 | 12 | 0 |
| B | 0 | 12 | 0 |
| C | 0 | 12 | 0 |
| D | 0 | 12 | 0 |
| Mode M0 | |||
|---|---|---|---|
| Quadrant | BADHDUFLAG | Total packets | Discarded packets |
| A | 0 | 25298 | 2 |
| B | 0 | 26248 | 1 |
| C | 0 | 24974 | 1 |
| D | 0 | 23230 | 1 |
| Mode SS | |||
|---|---|---|---|
| Quadrant | BADHDUFLAG | Total packets | Discarded packets |
| A | 0 | 122 | 0 |
| B | 0 | 122 | 0 |
| C | 0 | 122 | 0 |
| D | 0 | 122 | 0 |
| Quadrant | Total seconds | Saturated seconds | Saturation percentage |
|---|---|---|---|
| A | 5987 | 28 | 0.467680% |
| B | 5987 | 33 | 0.551194% |
| C | 5987 | 10 | 0.167029% |
| D | 5987 | 26 | 0.434274% |
Noise dominated data is calculated using 1-second bins in cleaned event files. If a bin has >2000 counts, and if more than 50% of those come from <1% of pixels, then it is considered to be noise-dominated and hence unusable.
| Quadrant | # 1 sec bins | Bins with >0 counts | Bins with >2000 counts | High rate bins dominated by noise | Noise dominated (total time) | Noise dominated (detector-on time) | Marked lightcurve |
|---|---|---|---|---|---|---|---|
| A | 7207 | 5987 | 150 | 150 | 2.08% | 2.51% | 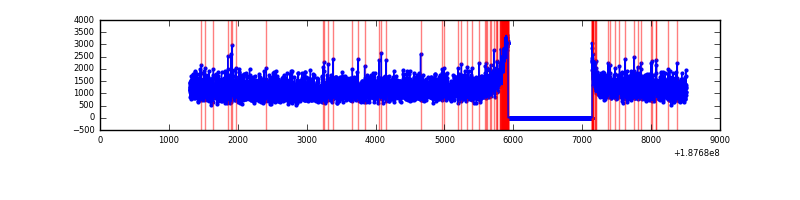 |
| B | 7207 | 5987 | 215 | 215 | 2.98% | 3.59% | 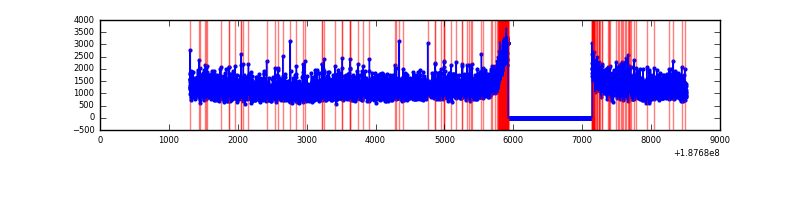 |
| C | 7207 | 5988 | 162 | 162 | 2.25% | 2.71% | 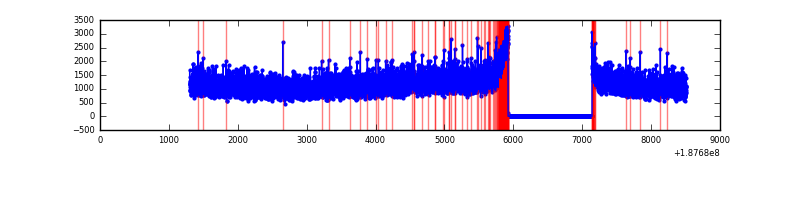 |
| D | 7207 | 5988 | 140 | 140 | 1.94% | 2.34% | 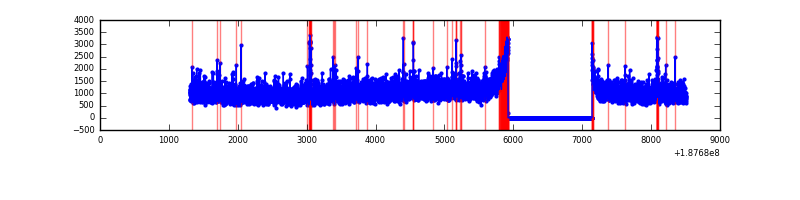 |
Top three noisy pixels from each quadrant. If the there are fewer than three noisy pixels in the level2.evt file, extra rows are filled as -1
| Pixel properties | Quadrant properties | ||||||
|---|---|---|---|---|---|---|---|
| Quadrant | DetID | PixID | Counts | Sigma | Mean | Median | Sigma |
| A | 12 | 243 | 6452 | 10.49 | 1844 | 1855 | 438.2 |
| A | 11 | 79 | 6149 | 9.8 | 1844 | 1855 | 438.2 |
| A | 3 | 111 | 5769 | 8.93 | 1844 | 1855 | 438.2 |
| B | 15 | 22 | 34392 | 72.42 | 1906 | 1917 | 448.4 |
| B | 8 | 4 | 21439 | 43.53 | 1906 | 1917 | 448.4 |
| B | 2 | 32 | 20790 | 42.09 | 1906 | 1917 | 448.4 |
| C | 15 | 241 | 308879 | 655.02 | 1694 | 1748 | 468.9 |
| C | 3 | 111 | 18922 | 36.63 | 1694 | 1748 | 468.9 |
| C | 3 | 79 | 12519 | 22.97 | 1694 | 1748 | 468.9 |
| D | 10 | 125 | 67591 | 131.35 | 1673 | 1724 | 501.4 |
| D | 7 | 67 | 30438 | 57.26 | 1673 | 1724 | 501.4 |
| D | 13 | 189 | 14539 | 25.56 | 1673 | 1724 | 501.4 |
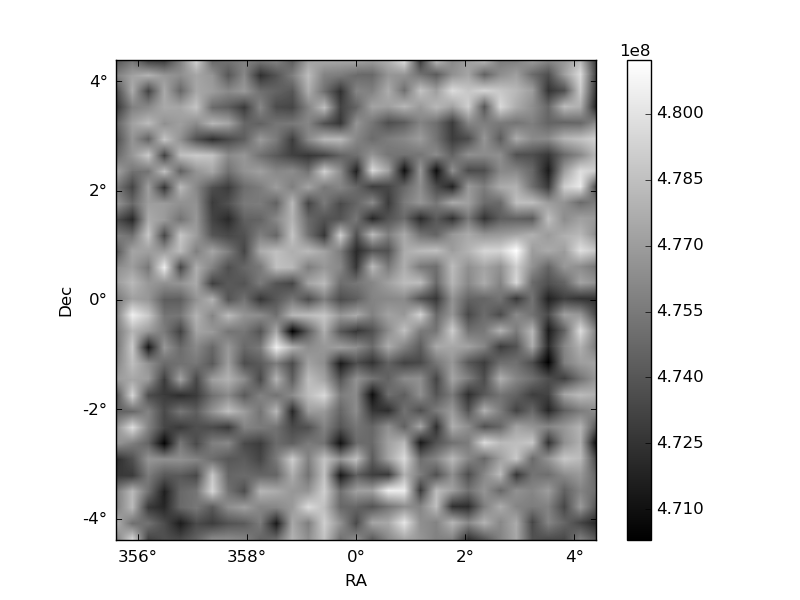
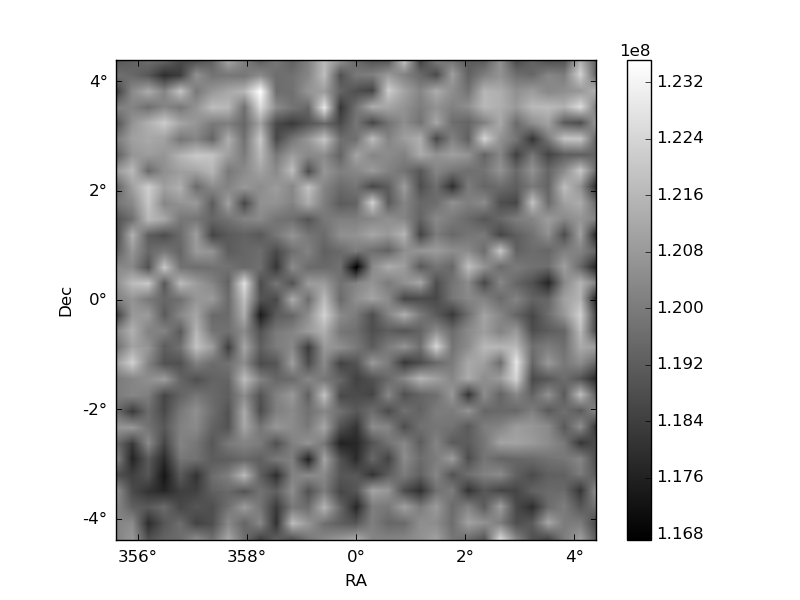
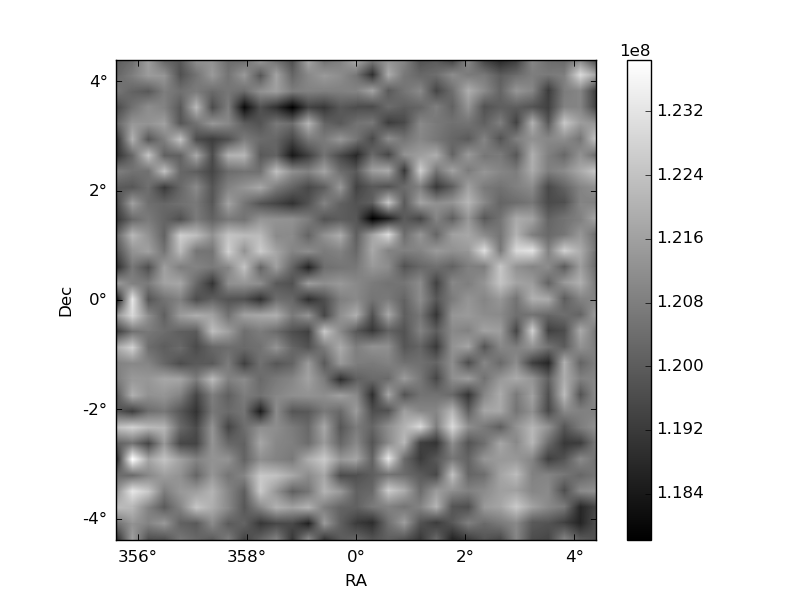
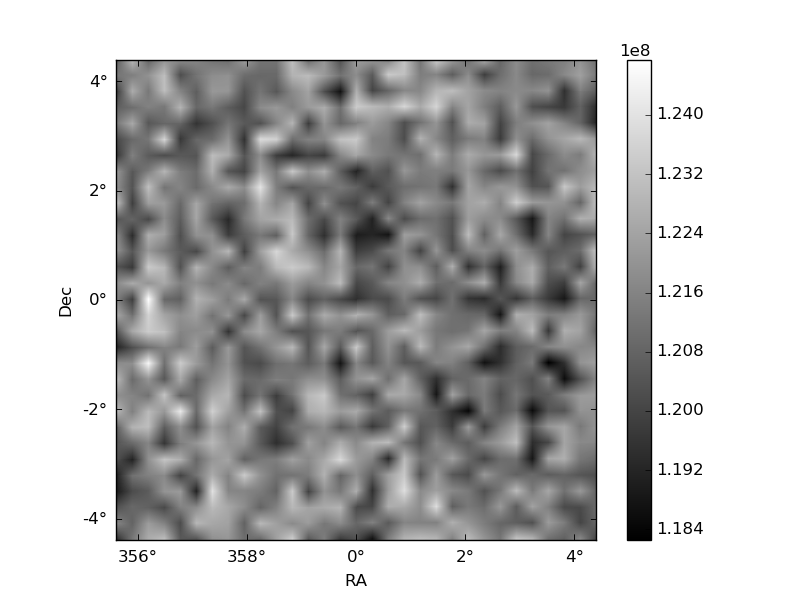
Histogram calculated using DETX and DETY for each event in the final _common_clean file
| Quadrant A | 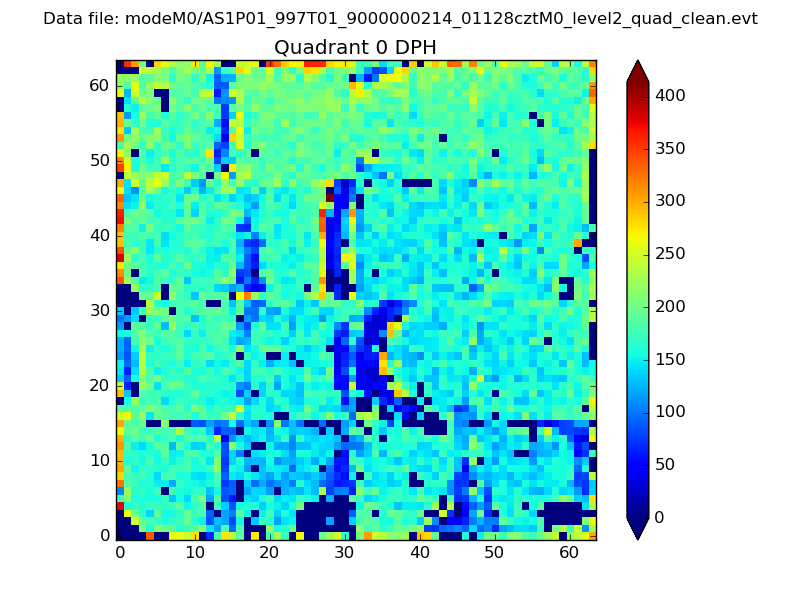 |
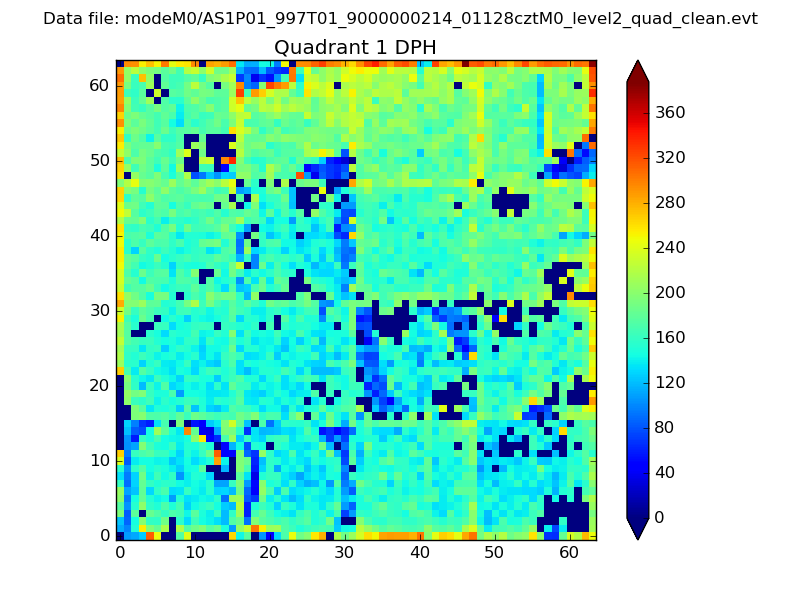 |
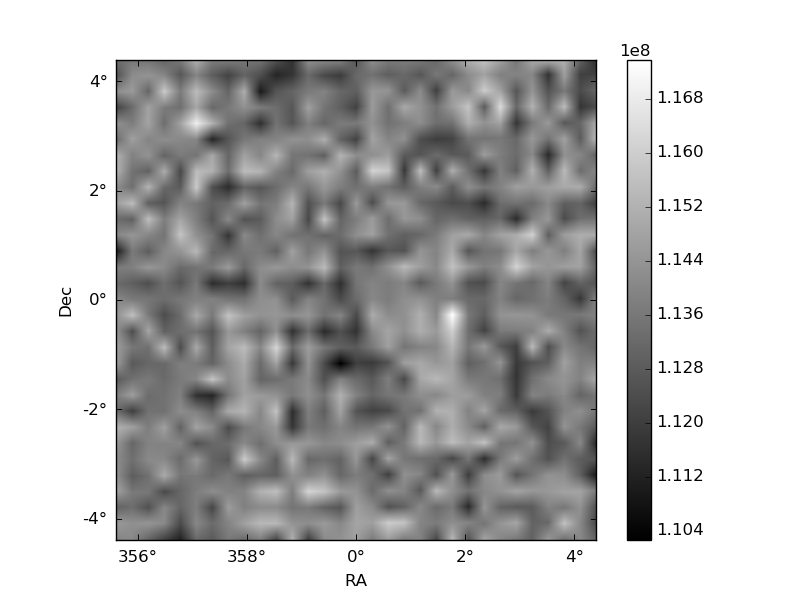
Quadrant B |
|---|---|---|---|
| Quadrant D | 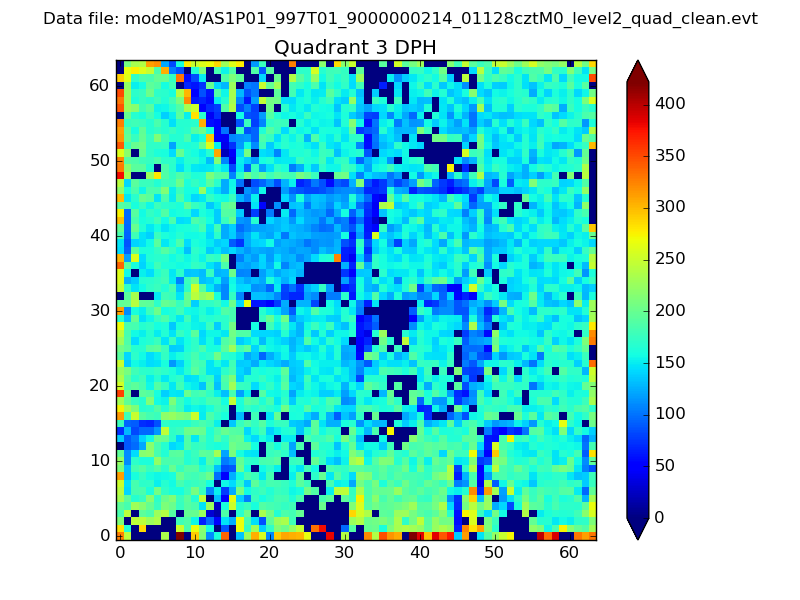 |
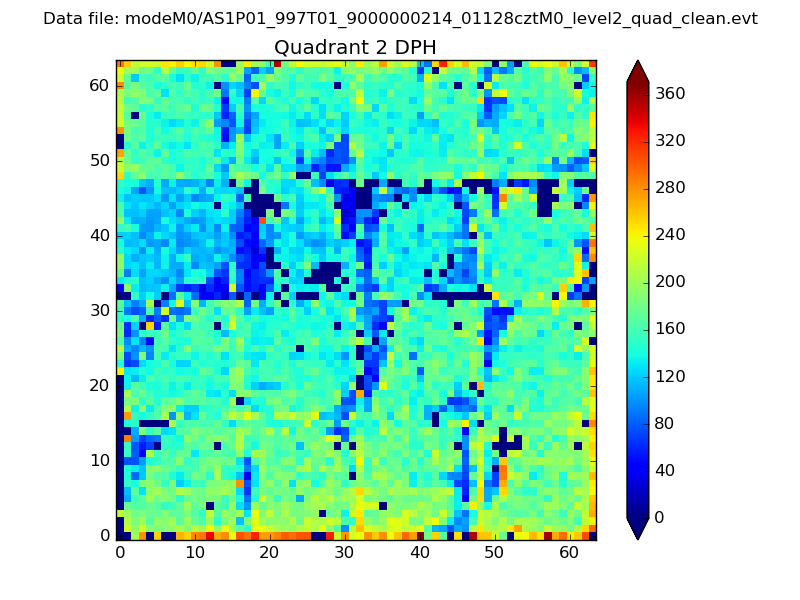 |
Quadrant C |
| Plot type | Count rate plots | Images |
|---|---|---|
| Comparison with Poisson distribution Blue bars denote a histogram of data divided into 1 sec bins. Red curve is a Poisson curve with rate = median count rate of data. |
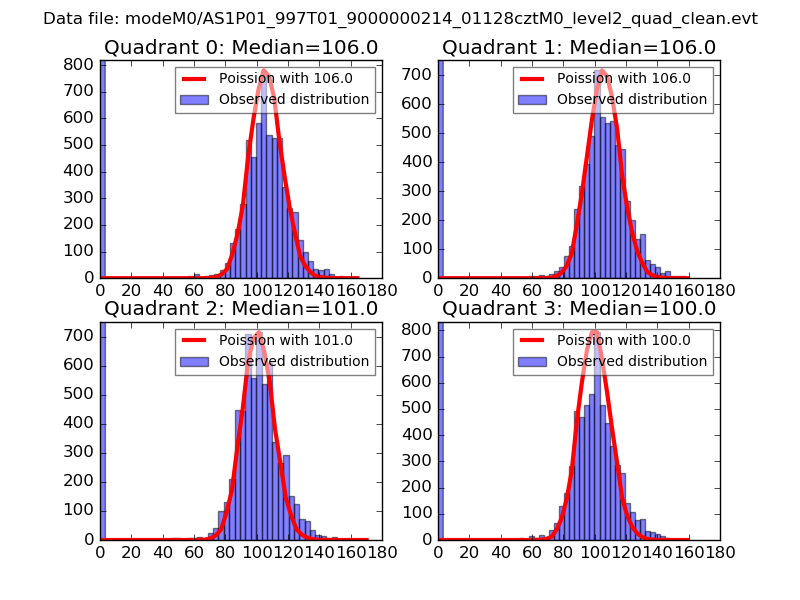 |
 |
| Quadrant-wise count rates Data is divided into 100 sec bins |
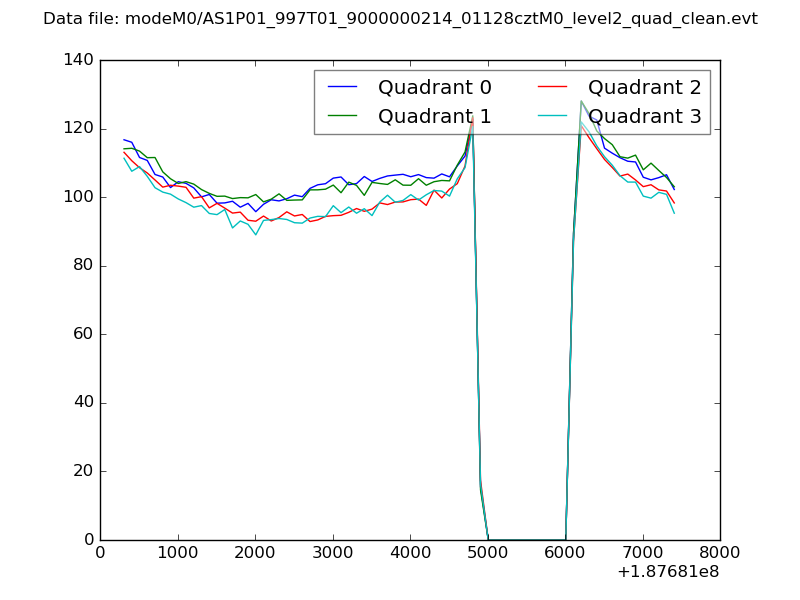 |
|
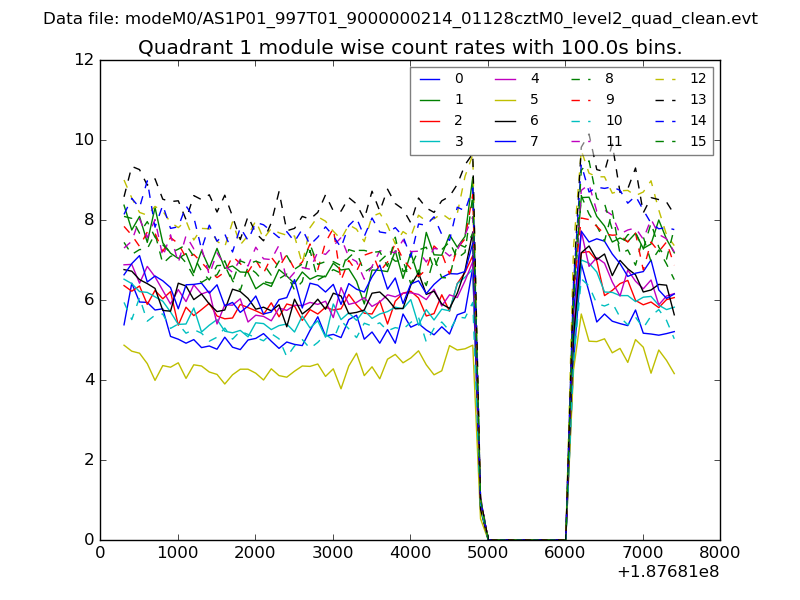
| Module-wise count rates for Quadrant A Data is divided into 100 sec bins |
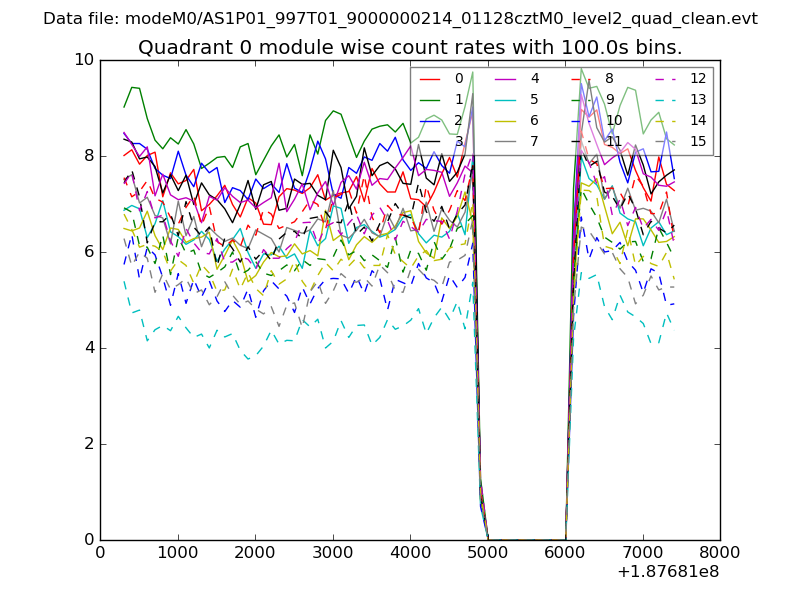 |
 |
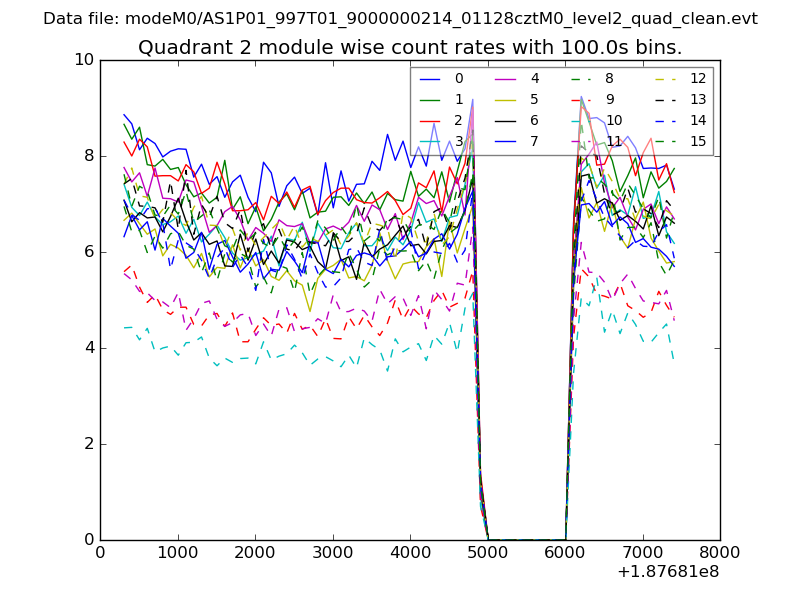
| Module-wise count rates for Quadrant B Data is divided into 100 sec bins |
 |
 |
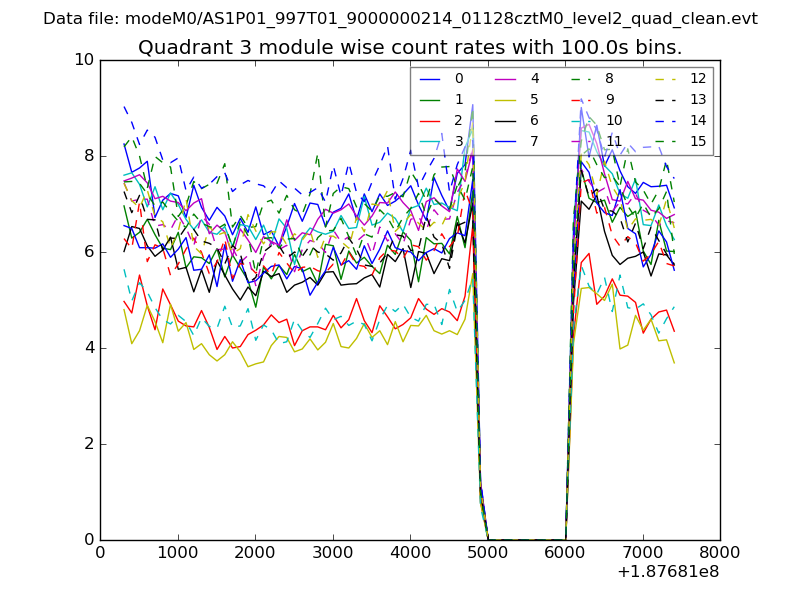
| Module-wise count rates for Quadrant C Data is divided into 100 sec bins |
 |
 |
| Module-wise count rates for Quadrant D Data is divided into 100 sec bins |
 |
 |
| Parameter | Plot |
|---|---|
| CZT HV Monitor | 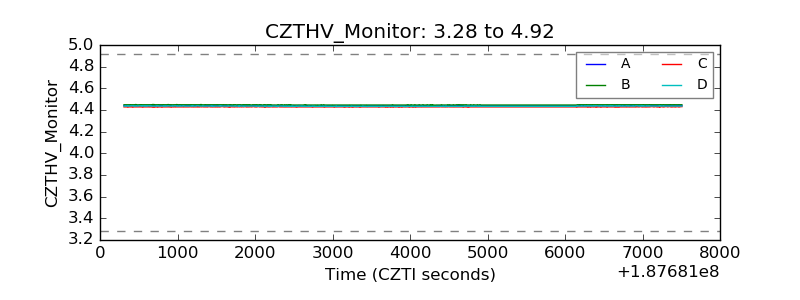 |
| D_VDD | 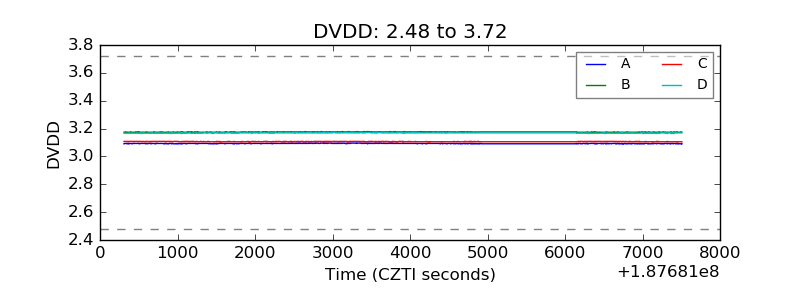 |
| Temperature 1 | 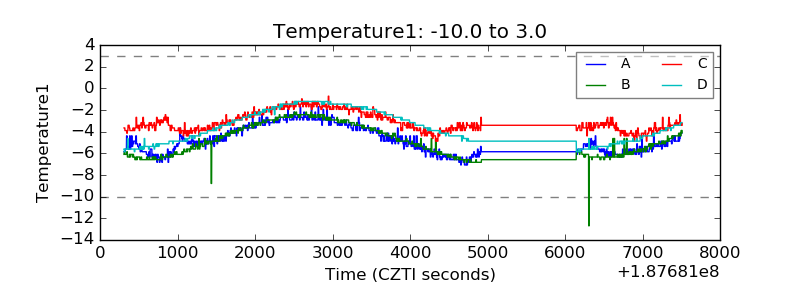 |
| Veto HV Monitor | 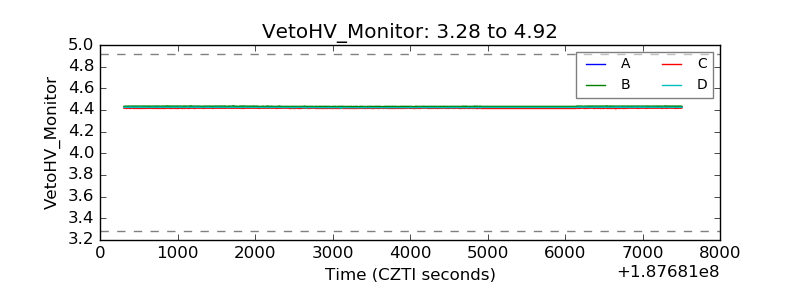 |
| Veto LLD | 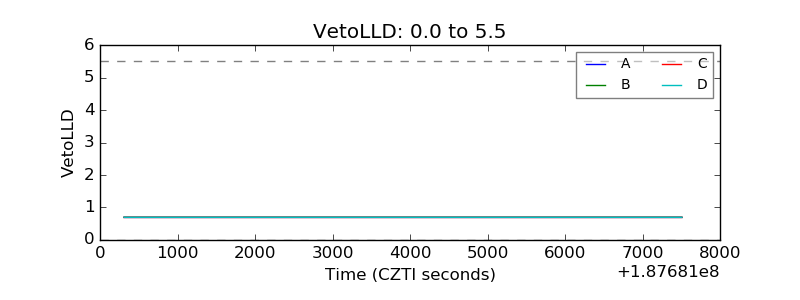 |
| Alpha Counter | 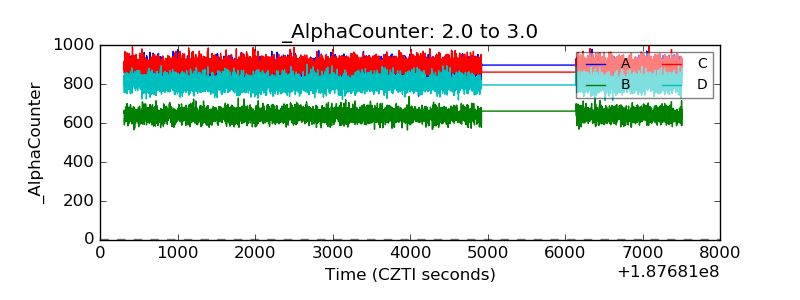 |
| _CPM_Rate | 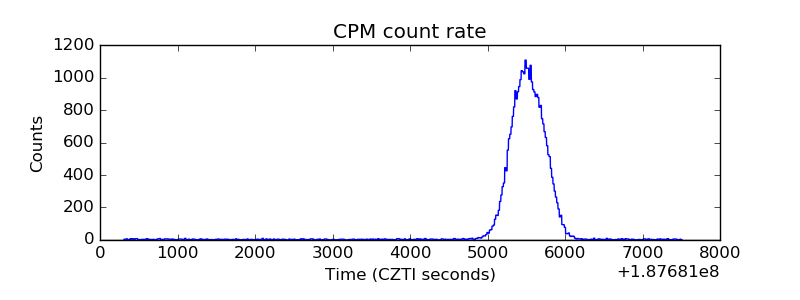 |
| CZT Counter | 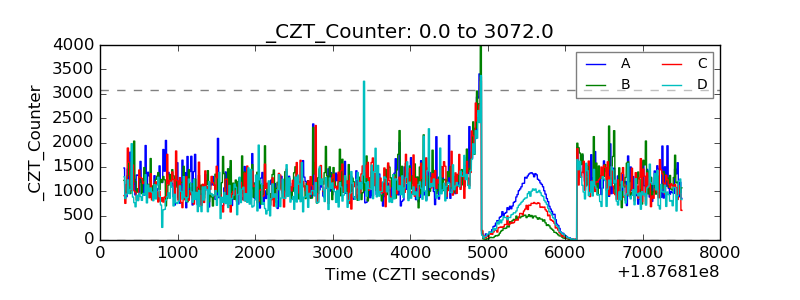 |
| +2.5 Volts monitor | 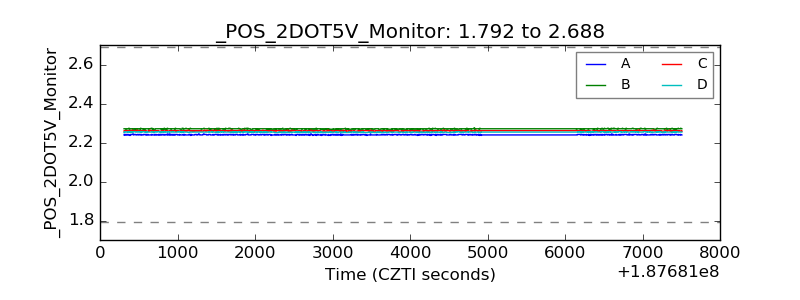 |
| +5 Volts monitor | 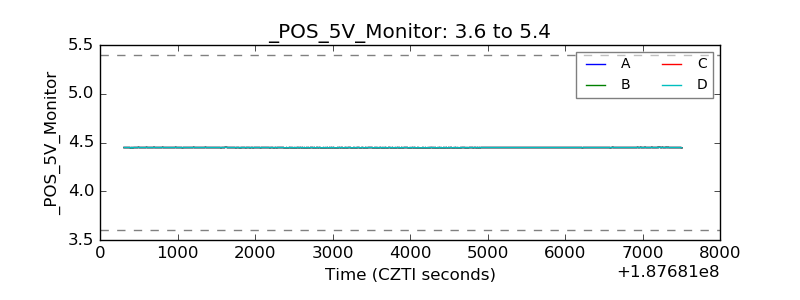 |
| _ROLL_ROT | 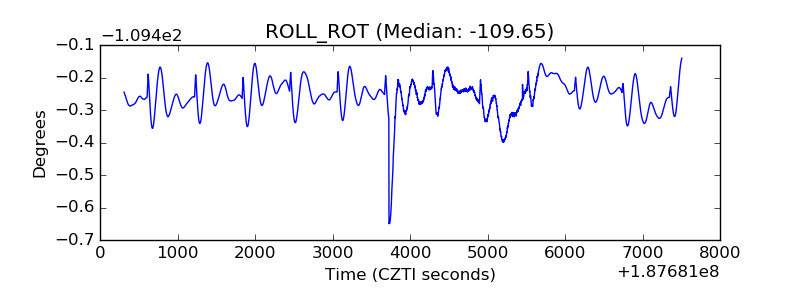 |
| _Roll_DEC | 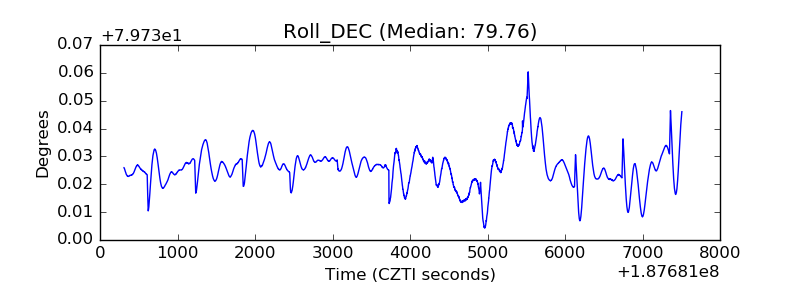 |
| _Roll_RA | 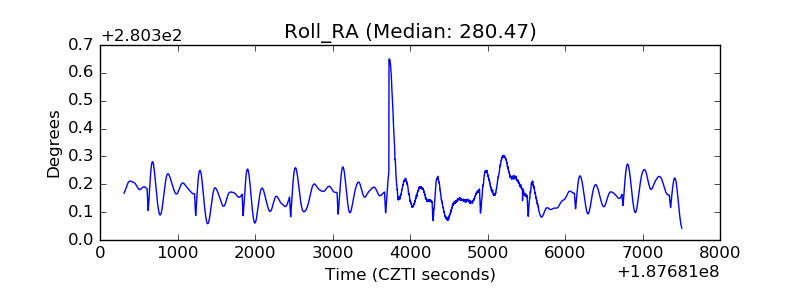 |
| Veto Counter | 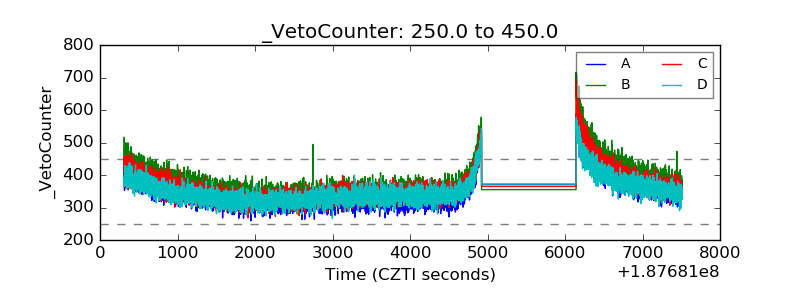 |