| Param | Original file | Final file |
|---|---|---|
| Filename | modeM0/AS1P01_997T01_9000000214_01129cztM0_level2.evt | modeM0/AS1P01_997T01_9000000214_01129cztM0_level2_quad_clean.evt |
| Size (bytes) | 873,115,200 | 88,657,920 |
| Size | 832.7 MB | 84.6 MB |
| Events in quadrant A | 6,604,501 | 589,701 |
| Events in quadrant B | 6,830,516 | 589,040 |
| Events in quadrant C | 6,498,732 | 559,479 |
| Events in quadrant D | 6,136,253 | 555,026 |
| Mode M9 | |||
|---|---|---|---|
| Quadrant | BADHDUFLAG | Total packets | Discarded packets |
| A | 0 | 13 | 0 |
| B | 0 | 13 | 0 |
| C | 0 | 13 | 0 |
| D | 0 | 13 | 0 |
| Mode M0 | |||
|---|---|---|---|
| Quadrant | BADHDUFLAG | Total packets | Discarded packets |
| A | 0 | 23619 | 2 |
| B | 0 | 24263 | 1 |
| C | 0 | 23311 | 1 |
| D | 0 | 22212 | 1 |
| Mode SS | |||
|---|---|---|---|
| Quadrant | BADHDUFLAG | Total packets | Discarded packets |
| A | 0 | 112 | 0 |
| B | 0 | 112 | 0 |
| C | 0 | 112 | 0 |
| D | 0 | 112 | 0 |
| Quadrant | Total seconds | Saturated seconds | Saturation percentage |
|---|---|---|---|
| A | 5607 | 6 | 0.107009% |
| B | 5607 | 7 | 0.124844% |
| C | 5607 | 1 | 0.017835% |
| D | 5607 | 15 | 0.267523% |
Noise dominated data is calculated using 1-second bins in cleaned event files. If a bin has >2000 counts, and if more than 50% of those come from <1% of pixels, then it is considered to be noise-dominated and hence unusable.
| Quadrant | # 1 sec bins | Bins with >0 counts | Bins with >2000 counts | High rate bins dominated by noise | Noise dominated (total time) | Noise dominated (detector-on time) | Marked lightcurve |
|---|---|---|---|---|---|---|---|
| A | 6842 | 5608 | 143 | 143 | 2.09% | 2.55% | 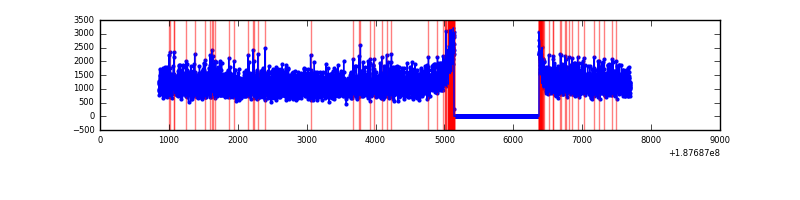 |
| B | 6842 | 5608 | 159 | 159 | 2.32% | 2.84% | 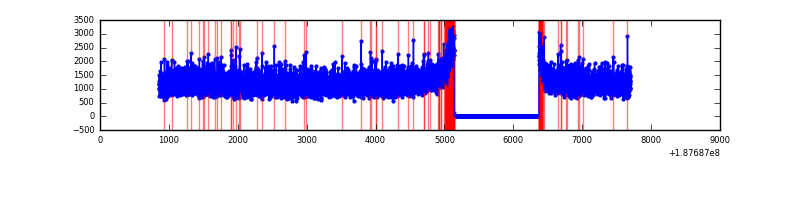 |
| C | 6842 | 5608 | 123 | 123 | 1.80% | 2.19% | 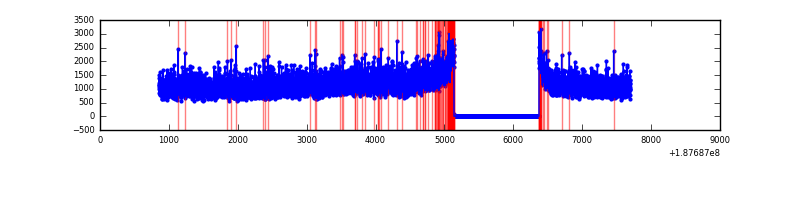 |
| D | 6842 | 5608 | 132 | 132 | 1.93% | 2.35% | 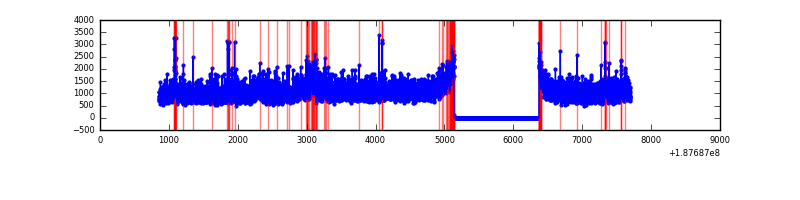 |
Top three noisy pixels from each quadrant. If the there are fewer than three noisy pixels in the level2.evt file, extra rows are filled as -1
| Pixel properties | Quadrant properties | ||||||
|---|---|---|---|---|---|---|---|
| Quadrant | DetID | PixID | Counts | Sigma | Mean | Median | Sigma |
| A | 11 | 79 | 6744 | 12.21 | 1719 | 1730 | 410.6 |
| A | 3 | 111 | 5566 | 9.34 | 1719 | 1730 | 410.6 |
| A | 12 | 243 | 5477 | 9.13 | 1719 | 1730 | 410.6 |
| B | 15 | 22 | 44223 | 101.92 | 1769 | 1775 | 416.5 |
| B | 8 | 4 | 16119 | 34.44 | 1769 | 1775 | 416.5 |
| B | 0 | 187 | 12783 | 26.43 | 1769 | 1775 | 416.5 |
| C | 15 | 241 | 272599 | 617.48 | 1585 | 1640 | 438.8 |
| C | 3 | 111 | 17536 | 36.23 | 1585 | 1640 | 438.8 |
| C | 3 | 79 | 12222 | 24.12 | 1585 | 1640 | 438.8 |
| D | 12 | 22 | 109318 | 227.78 | 1572 | 1621 | 472.8 |
| D | 10 | 85 | 40461 | 82.15 | 1572 | 1621 | 472.8 |
| D | 13 | 11 | 31980 | 64.21 | 1572 | 1621 | 472.8 |
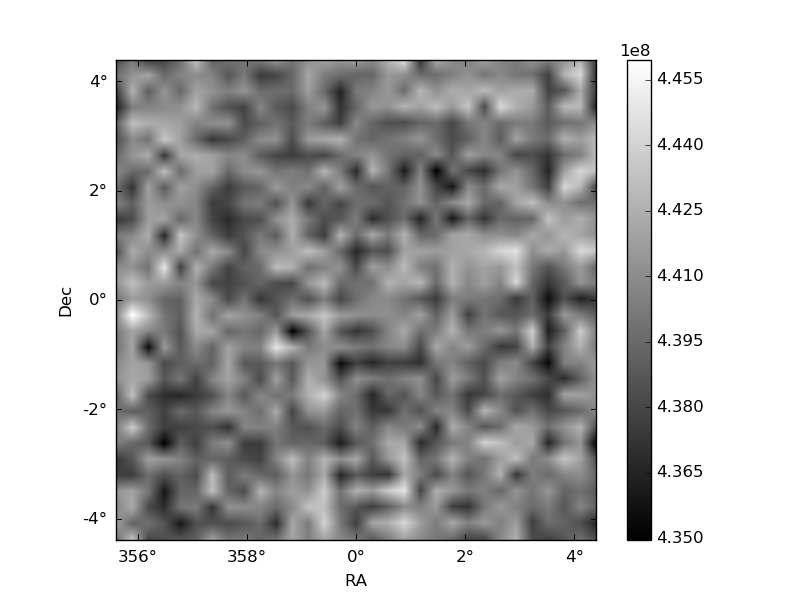
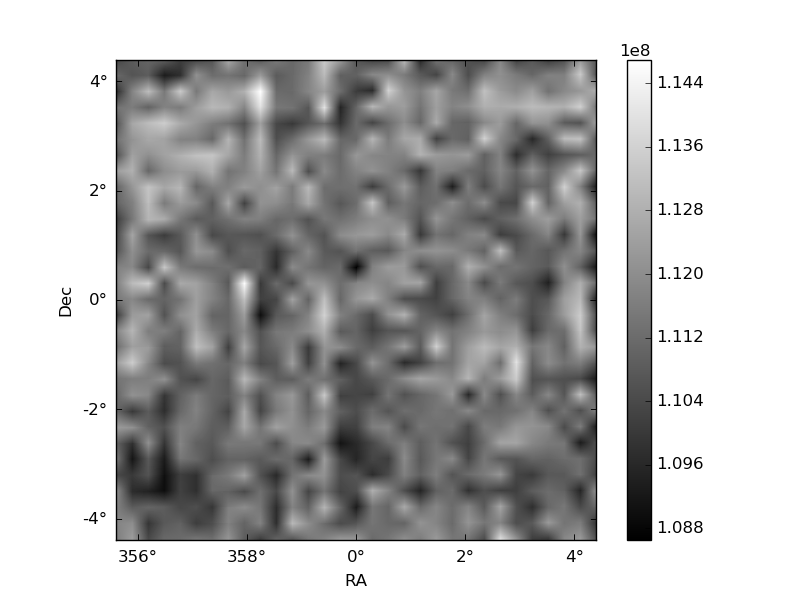
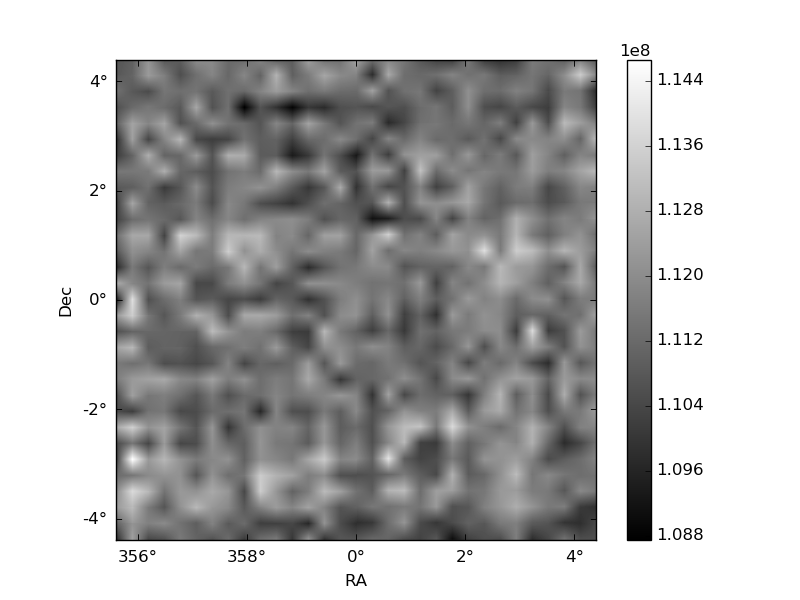
Histogram calculated using DETX and DETY for each event in the final _common_clean file
| Quadrant A | 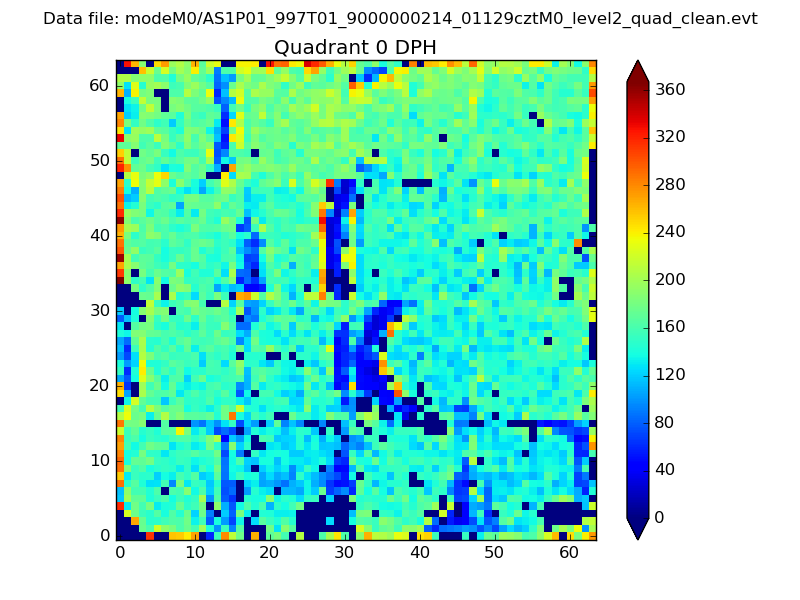 |
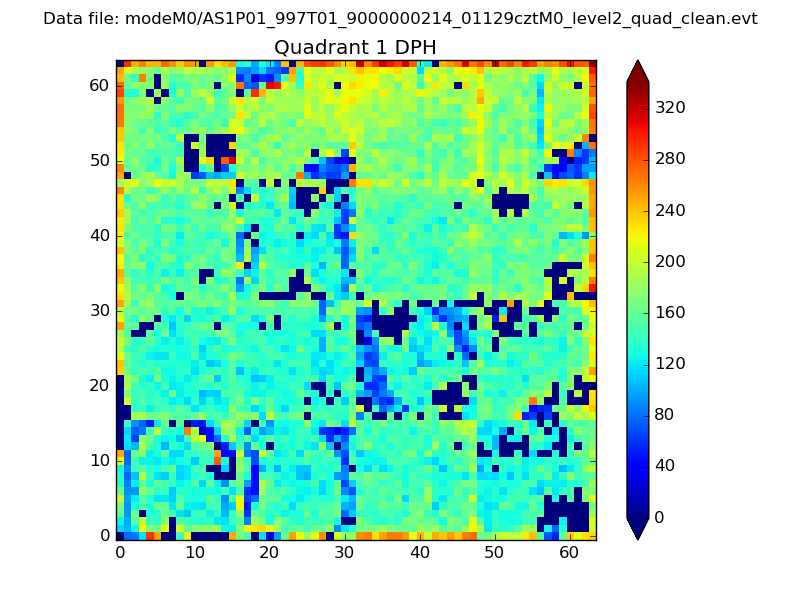 |
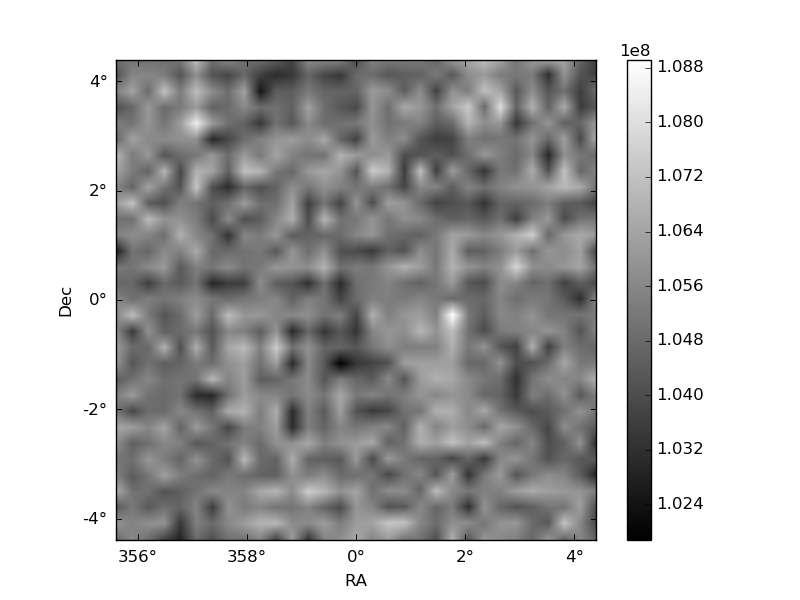
Quadrant B |
|---|---|---|---|
| Quadrant D | 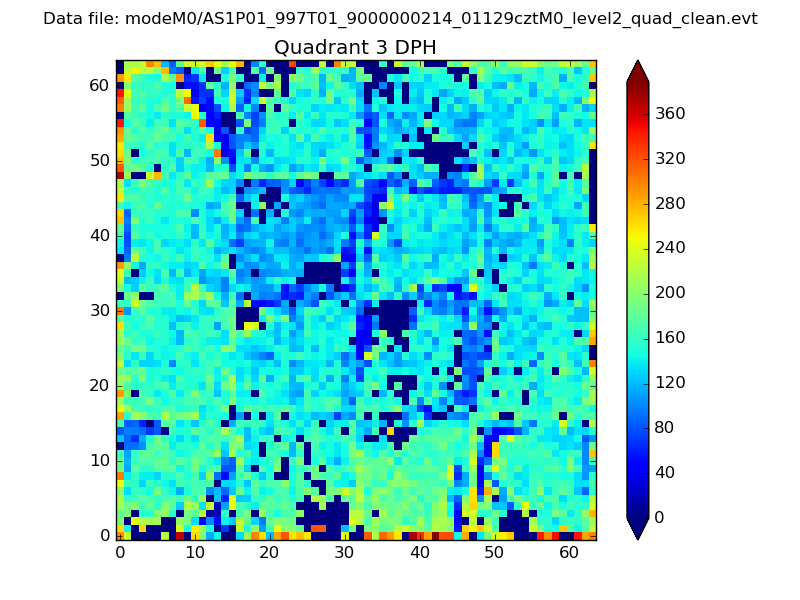 |
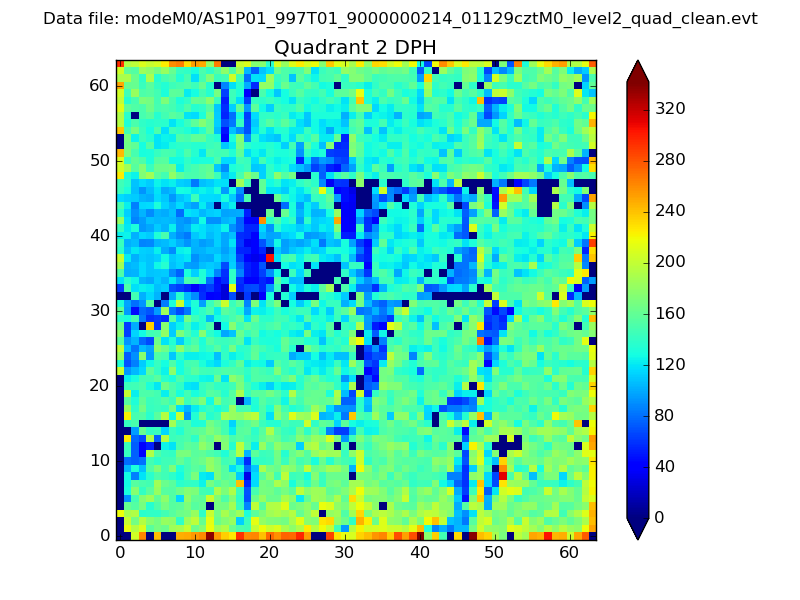 |
Quadrant C |
| Plot type | Count rate plots | Images |
|---|---|---|
| Comparison with Poisson distribution Blue bars denote a histogram of data divided into 1 sec bins. Red curve is a Poisson curve with rate = median count rate of data. |
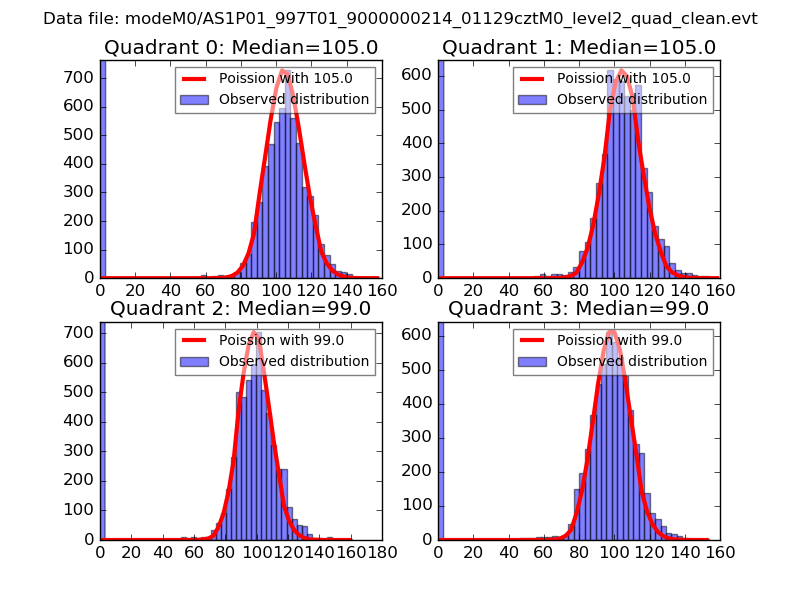 |
 |
| Quadrant-wise count rates Data is divided into 100 sec bins |
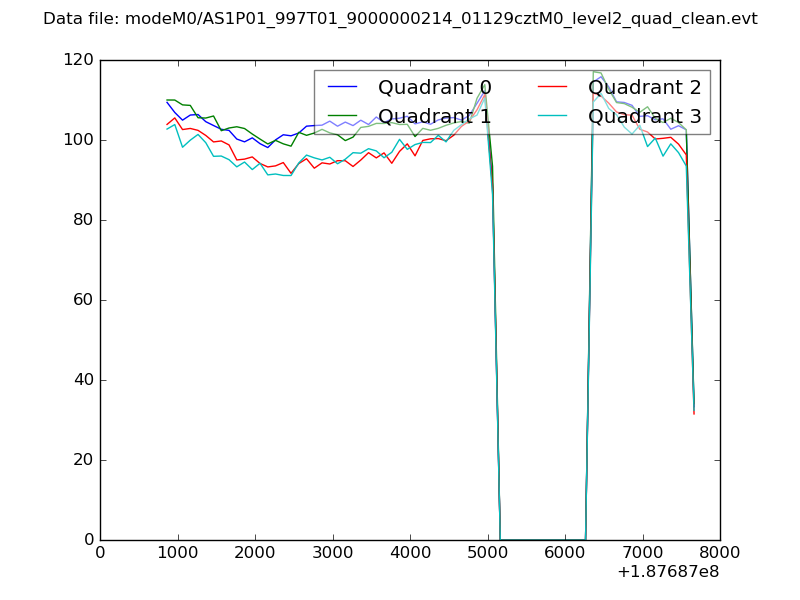 |
|
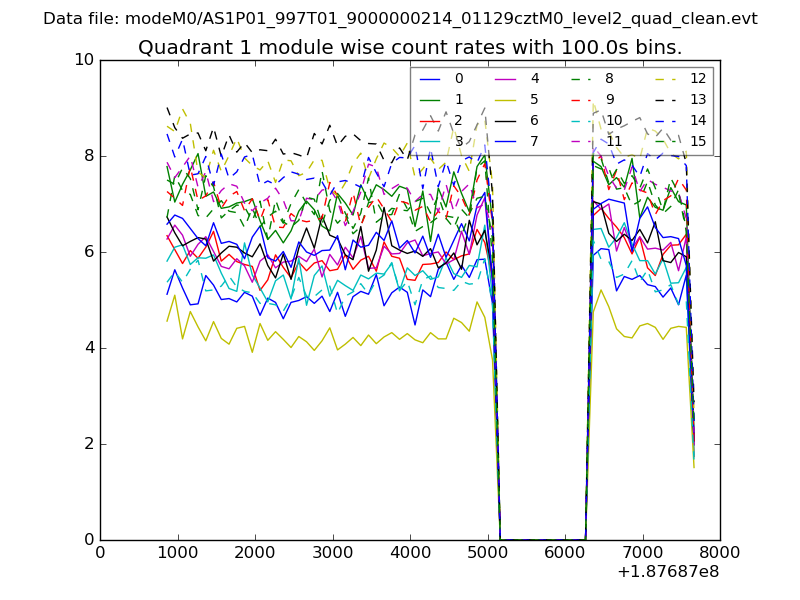
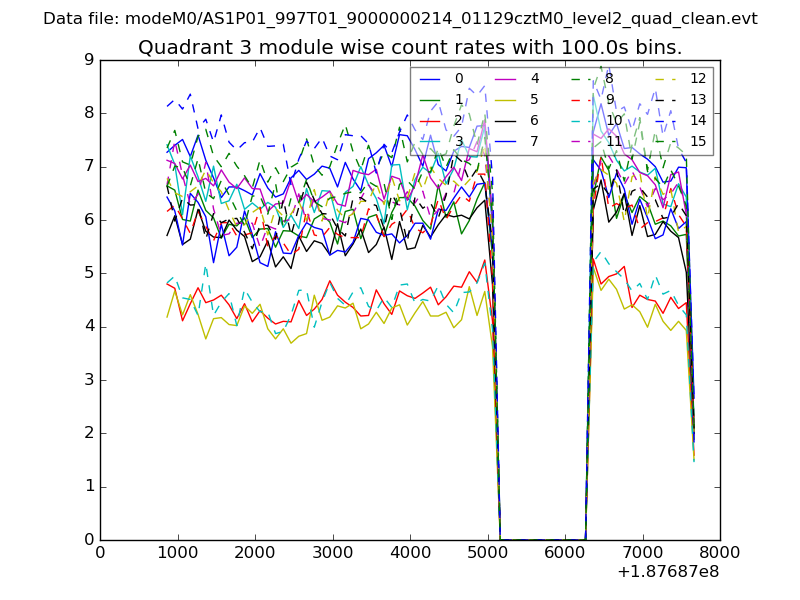
| Module-wise count rates for Quadrant A Data is divided into 100 sec bins |
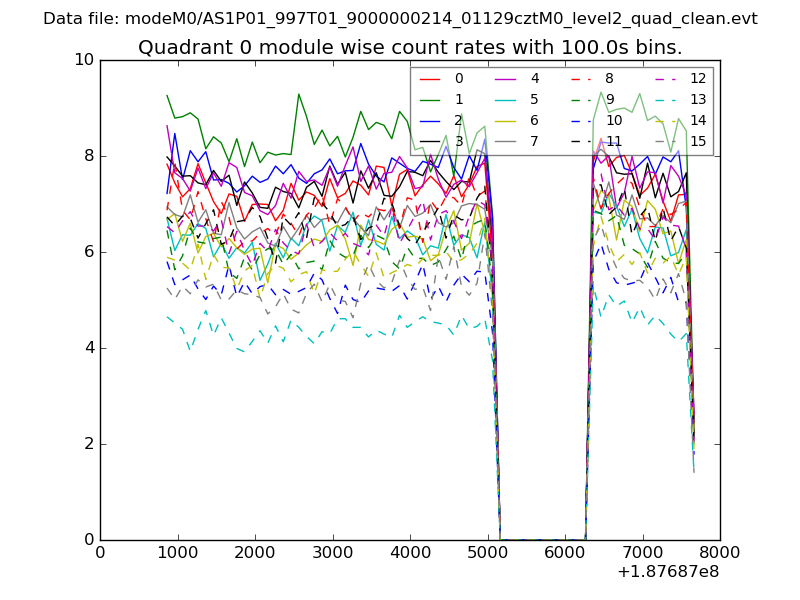 |
 |
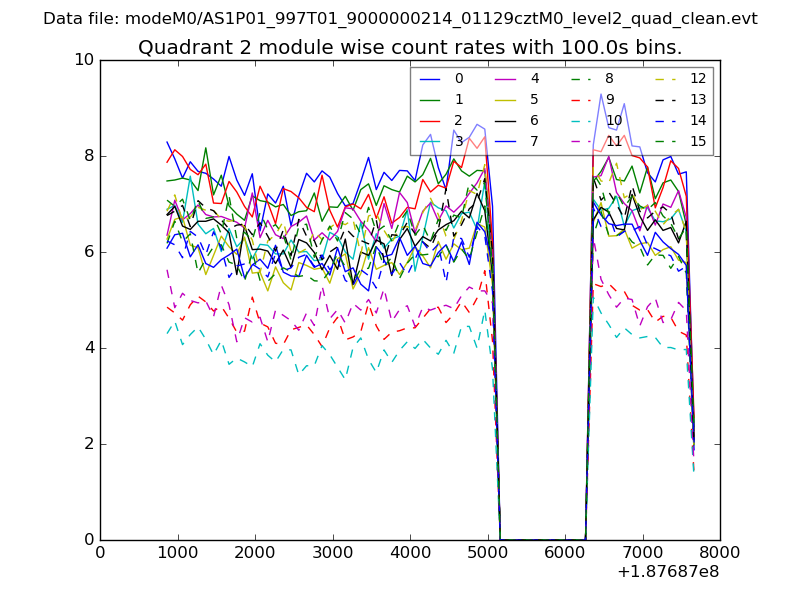
| Module-wise count rates for Quadrant B Data is divided into 100 sec bins |
 |
 |
| Module-wise count rates for Quadrant C Data is divided into 100 sec bins |
 |
 |
| Module-wise count rates for Quadrant D Data is divided into 100 sec bins |
 |
 |
| Parameter | Plot |
|---|---|
| CZT HV Monitor | 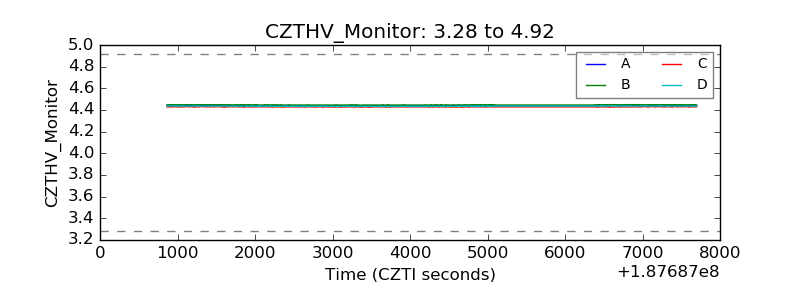 |
| D_VDD | 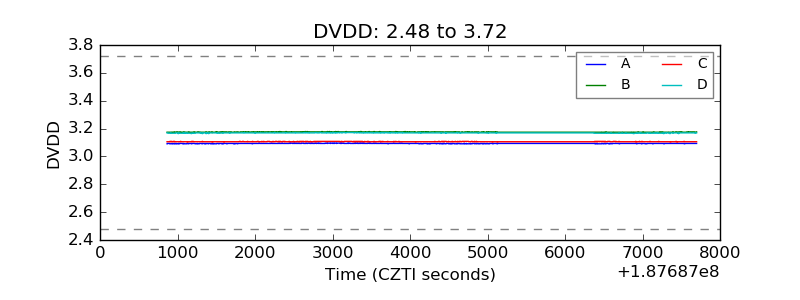 |
| Temperature 1 | 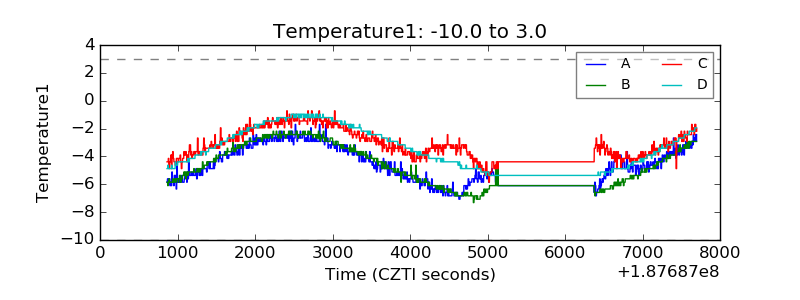 |
| Veto HV Monitor | 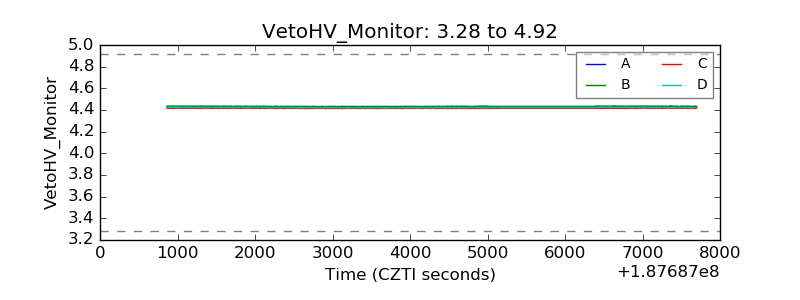 |
| Veto LLD | 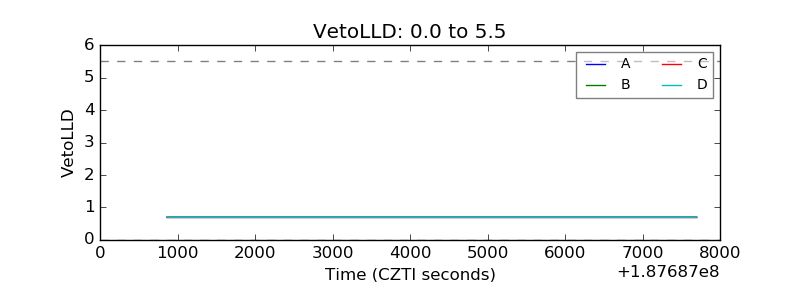 |
| Alpha Counter | 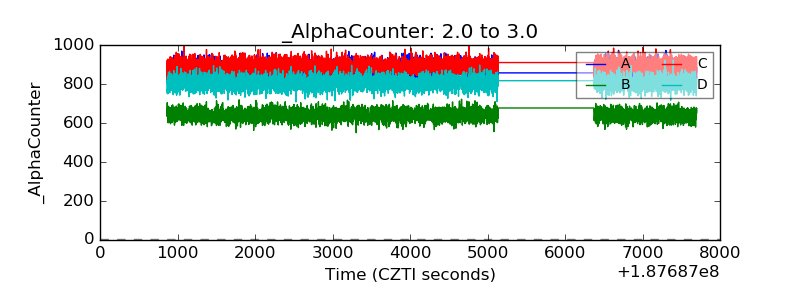 |
| _CPM_Rate |  |
| CZT Counter | 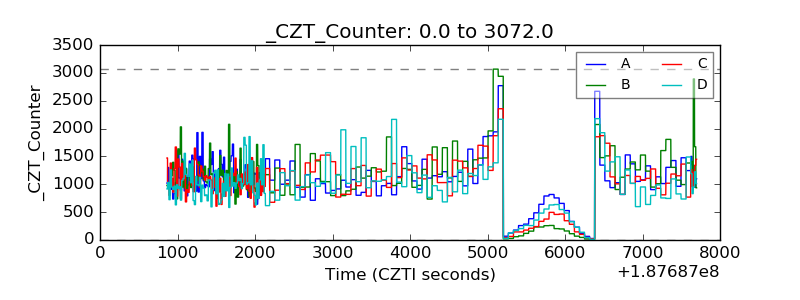 |
| +2.5 Volts monitor | 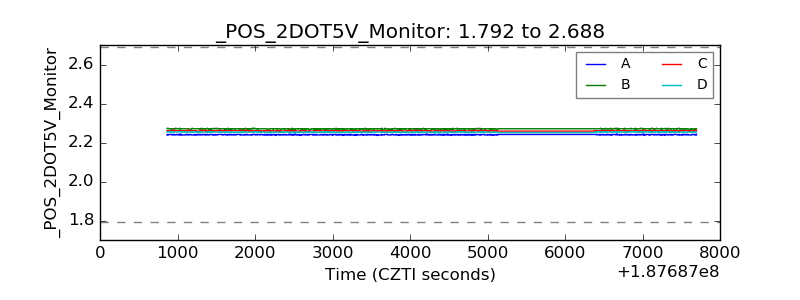 |
| +5 Volts monitor | 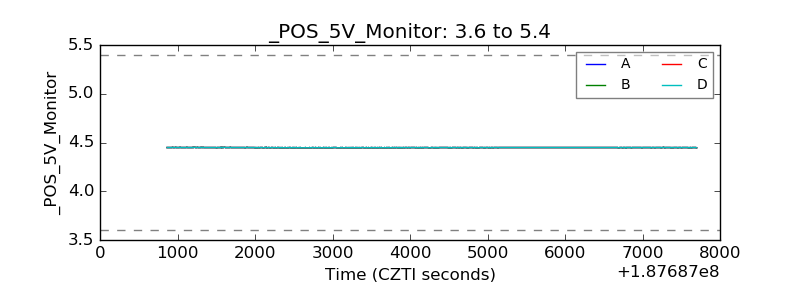 |
| _ROLL_ROT | 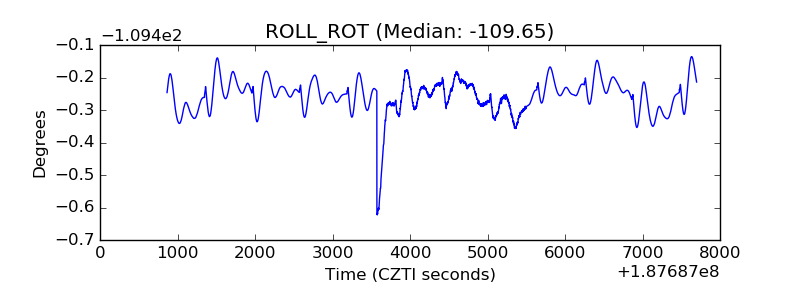 |
| _Roll_DEC |  |
| _Roll_RA | 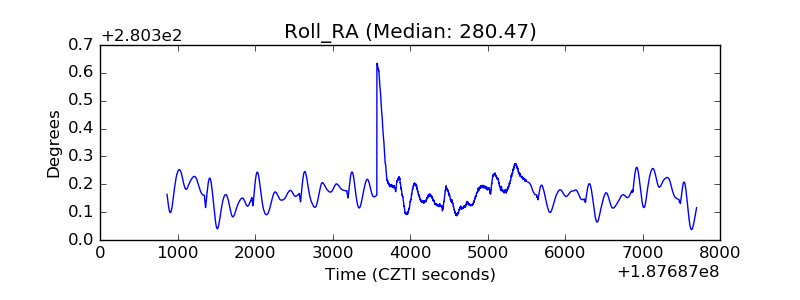 |
| Veto Counter | 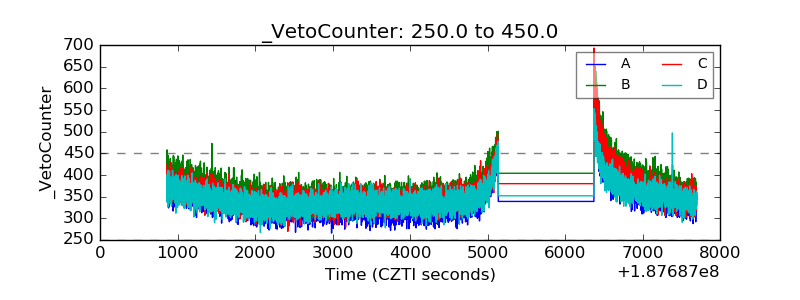 |