| Param | Original file | Final file |
|---|---|---|
| Filename | modeM0/AS1P01_997T01_9000000214_01130cztM0_level2.evt | modeM0/AS1P01_997T01_9000000214_01130cztM0_level2_quad_clean.evt |
| Size (bytes) | 945,420,480 | 92,741,760 |
| Size | 901.6 MB | 88.4 MB |
| Events in quadrant A | 7,118,376 | 614,712 |
| Events in quadrant B | 7,357,896 | 611,649 |
| Events in quadrant C | 7,035,708 | 584,698 |
| Events in quadrant D | 6,722,253 | 579,041 |
| Mode M9 | |||
|---|---|---|---|
| Quadrant | BADHDUFLAG | Total packets | Discarded packets |
| A | 0 | 11 | 0 |
| B | 0 | 11 | 0 |
| C | 0 | 11 | 0 |
| D | 0 | 11 | 0 |
| Mode M0 | |||
|---|---|---|---|
| Quadrant | BADHDUFLAG | Total packets | Discarded packets |
| A | 0 | 25415 | 2 |
| B | 0 | 26175 | 1 |
| C | 0 | 25152 | 1 |
| D | 0 | 24266 | 1 |
| Mode SS | |||
|---|---|---|---|
| Quadrant | BADHDUFLAG | Total packets | Discarded packets |
| A | 0 | 120 | 0 |
| B | 0 | 120 | 0 |
| C | 0 | 120 | 0 |
| D | 0 | 120 | 0 |
| Quadrant | Total seconds | Saturated seconds | Saturation percentage |
|---|---|---|---|
| A | 5999 | 20 | 0.333389% |
| B | 5999 | 23 | 0.383397% |
| C | 5999 | 8 | 0.133356% |
| D | 5999 | 90 | 1.500250% |
Noise dominated data is calculated using 1-second bins in cleaned event files. If a bin has >2000 counts, and if more than 50% of those come from <1% of pixels, then it is considered to be noise-dominated and hence unusable.
| Quadrant | # 1 sec bins | Bins with >0 counts | Bins with >2000 counts | High rate bins dominated by noise | Noise dominated (total time) | Noise dominated (detector-on time) | Marked lightcurve |
|---|---|---|---|---|---|---|---|
| A | 7064 | 5999 | 215 | 215 | 3.04% | 3.58% | 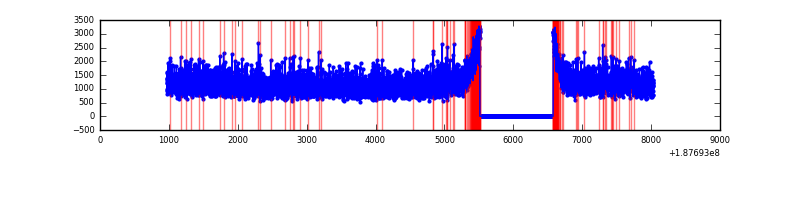 |
| B | 7063 | 5998 | 216 | 216 | 3.06% | 3.60% | 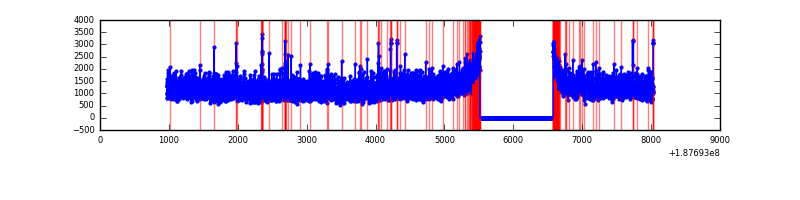 |
| C | 7064 | 6000 | 148 | 148 | 2.10% | 2.47% | 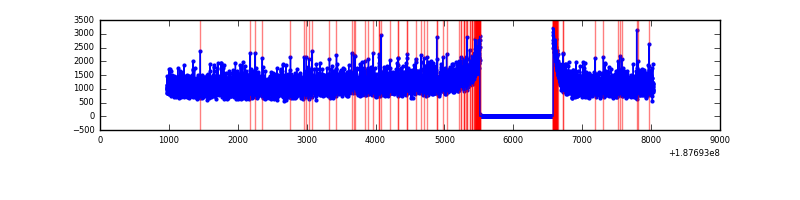 |
| D | 7064 | 5999 | 231 | 231 | 3.27% | 3.85% | 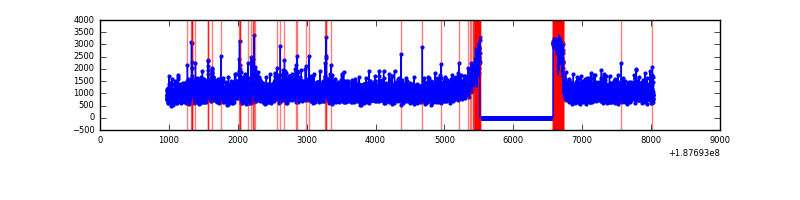 |
Top three noisy pixels from each quadrant. If the there are fewer than three noisy pixels in the level2.evt file, extra rows are filled as -1
| Pixel properties | Quadrant properties | ||||||
|---|---|---|---|---|---|---|---|
| Quadrant | DetID | PixID | Counts | Sigma | Mean | Median | Sigma |
| A | 11 | 242 | 9256 | 16.66 | 1852 | 1862 | 443.9 |
| A | 11 | 79 | 6727 | 10.96 | 1852 | 1862 | 443.9 |
| A | 3 | 111 | 5685 | 8.61 | 1852 | 1862 | 443.9 |
| B | 15 | 22 | 82724 | 181.95 | 1885 | 1892 | 444.2 |
| B | 5 | 249 | 28149 | 59.1 | 1885 | 1892 | 444.2 |
| B | 15 | 85 | 23924 | 49.59 | 1885 | 1892 | 444.2 |
| C | 15 | 241 | 321848 | 680.27 | 1699 | 1756 | 470.5 |
| C | 0 | 236 | 22540 | 44.17 | 1699 | 1756 | 470.5 |
| C | 3 | 111 | 20134 | 39.06 | 1699 | 1756 | 470.5 |
| D | 10 | 125 | 205415 | 391.87 | 1669 | 1730 | 519.8 |
| D | 7 | 67 | 191316 | 364.74 | 1669 | 1730 | 519.8 |
| D | 10 | 85 | 70250 | 131.82 | 1669 | 1730 | 519.8 |
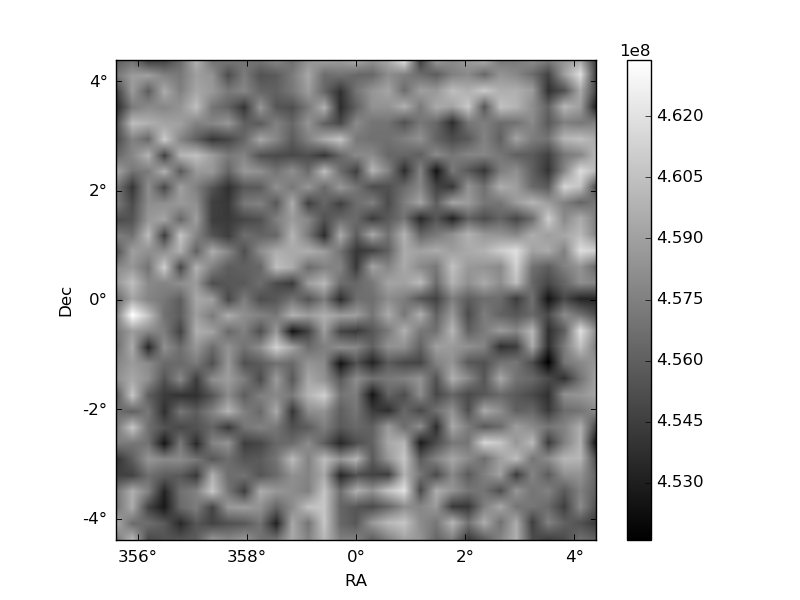
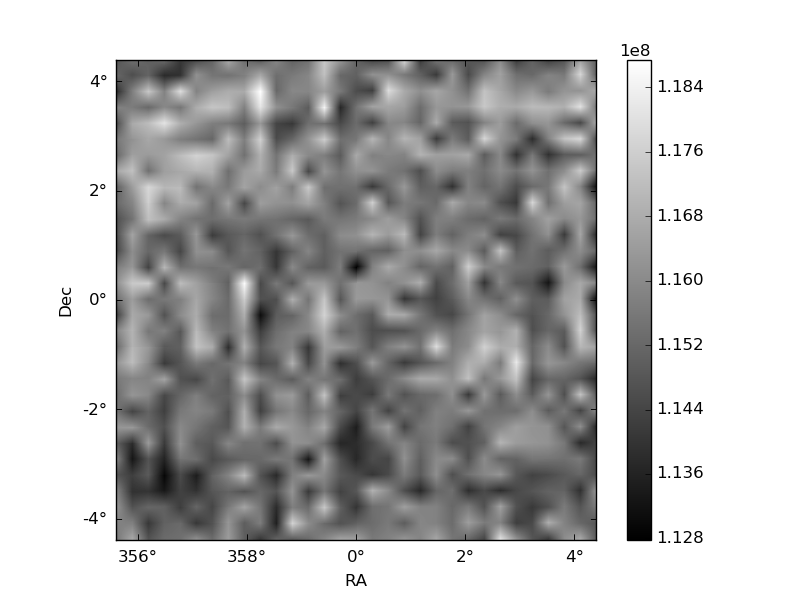
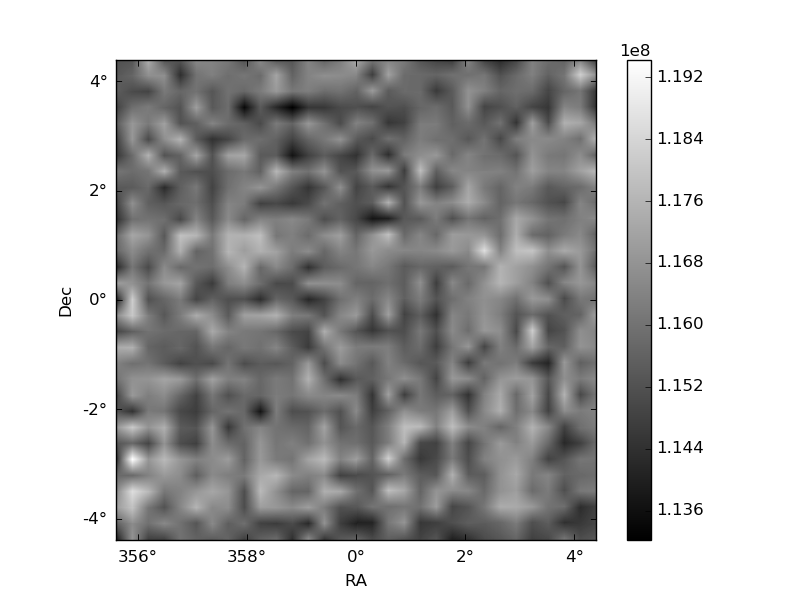
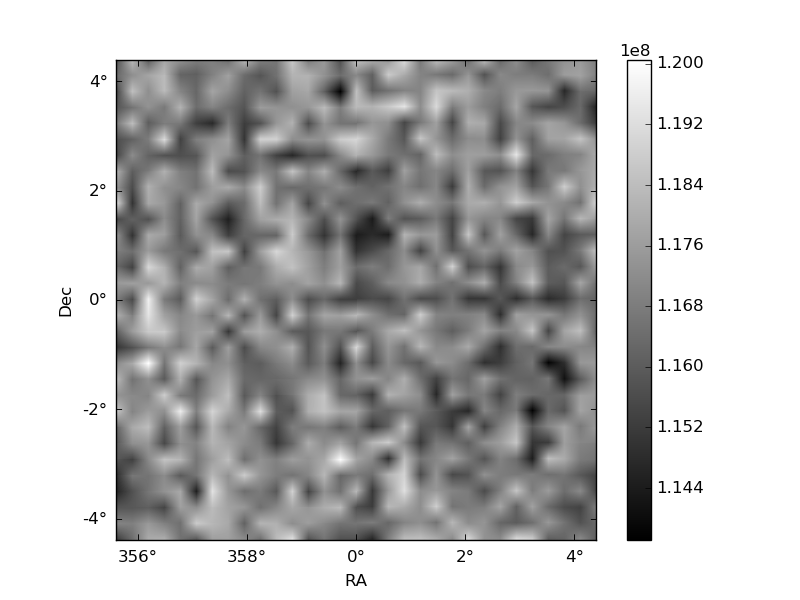
Histogram calculated using DETX and DETY for each event in the final _common_clean file
| Quadrant A | 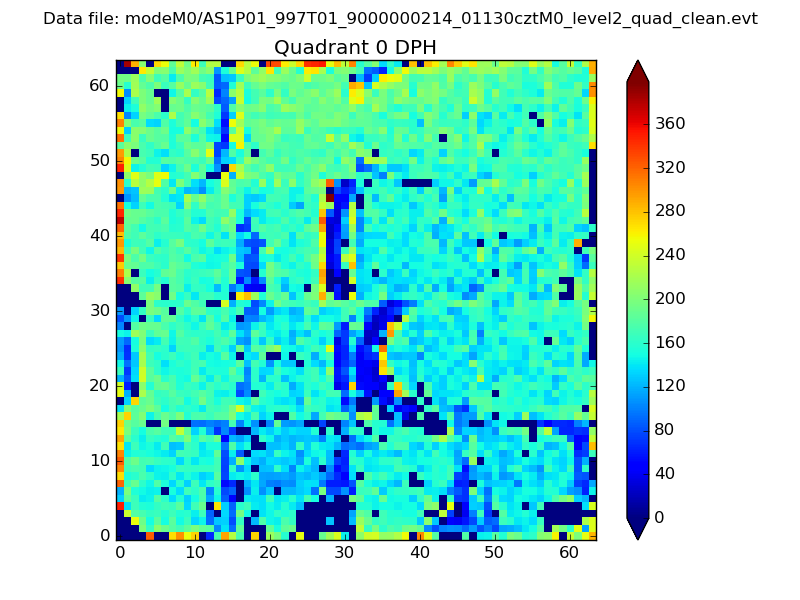 |
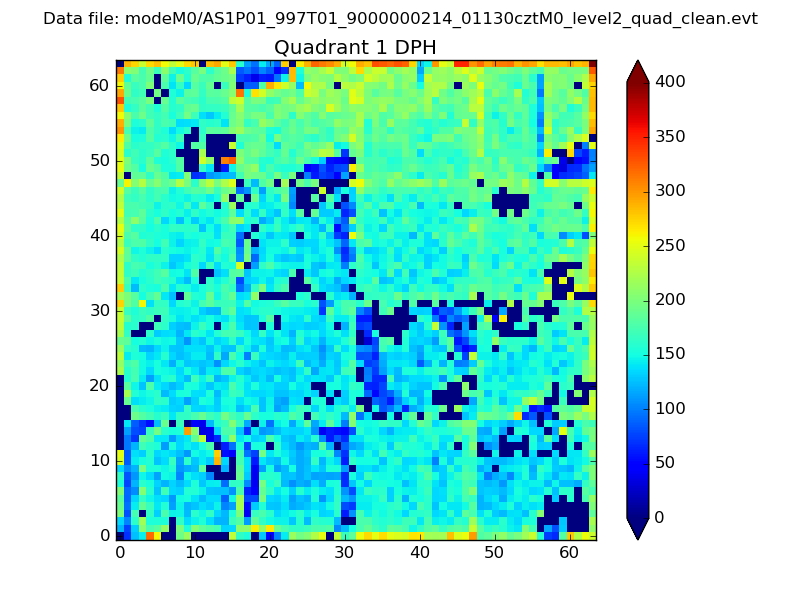 |
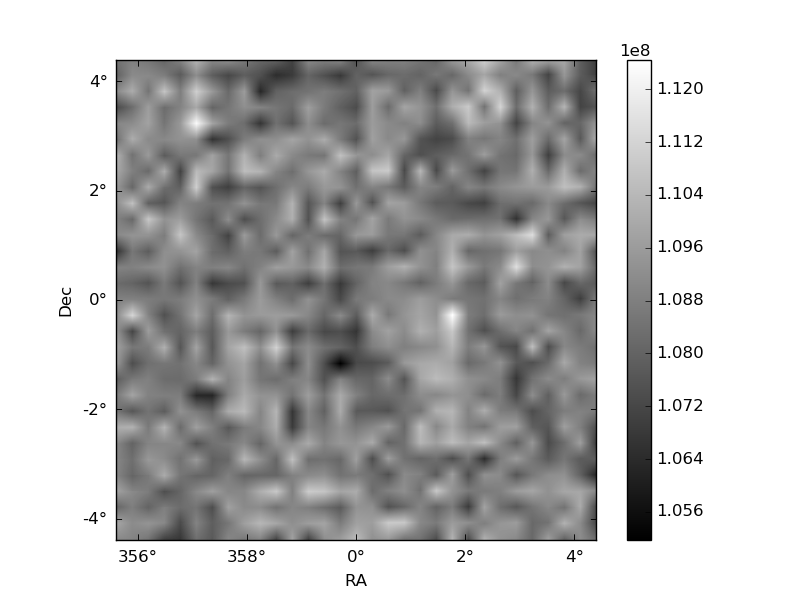
Quadrant B |
|---|---|---|---|
| Quadrant D | 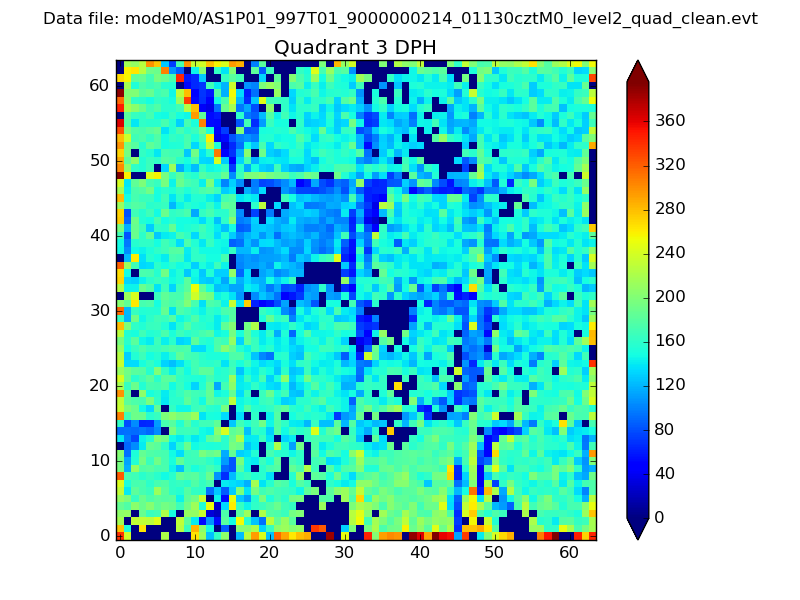 |
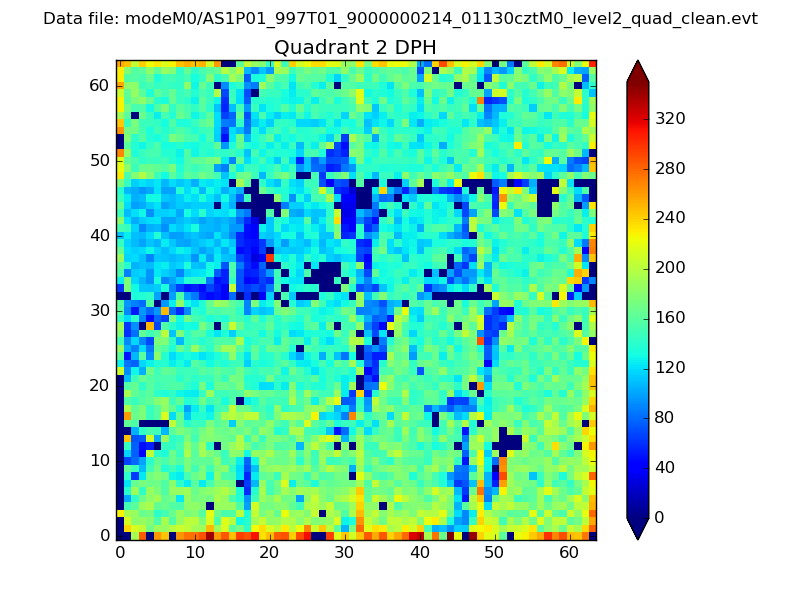 |
Quadrant C |
| Plot type | Count rate plots | Images |
|---|---|---|
| Comparison with Poisson distribution Blue bars denote a histogram of data divided into 1 sec bins. Red curve is a Poisson curve with rate = median count rate of data. |
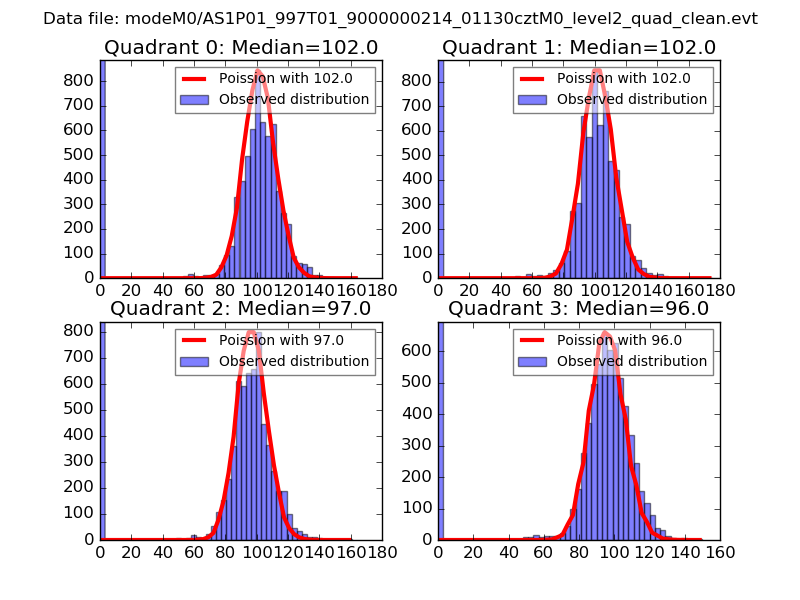 |
 |
| Quadrant-wise count rates Data is divided into 100 sec bins |
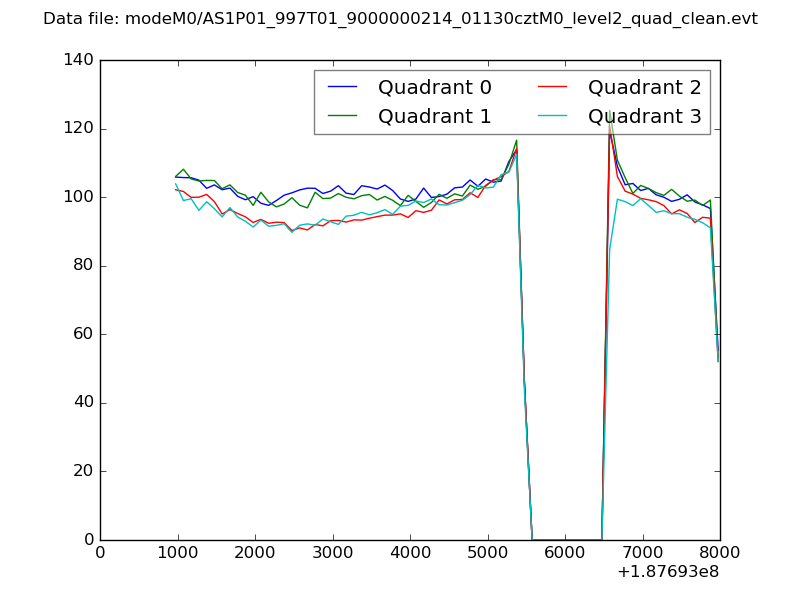 |
|
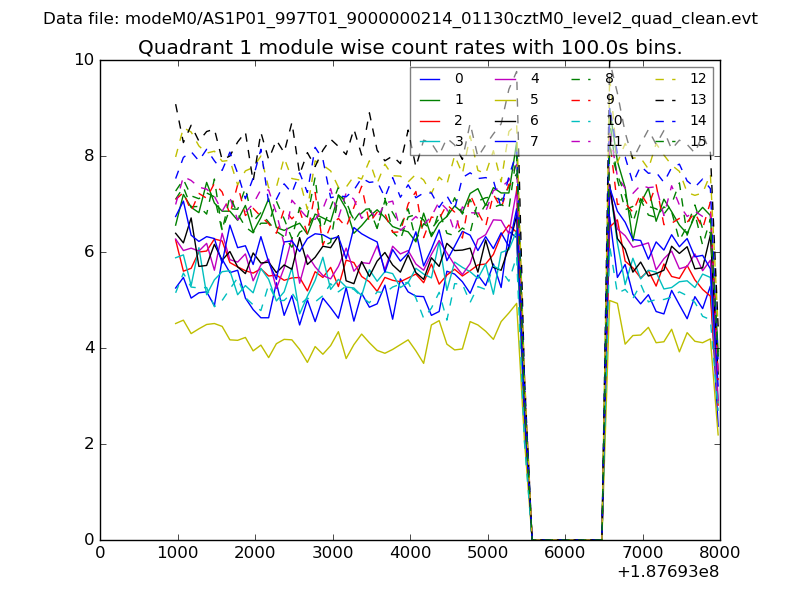
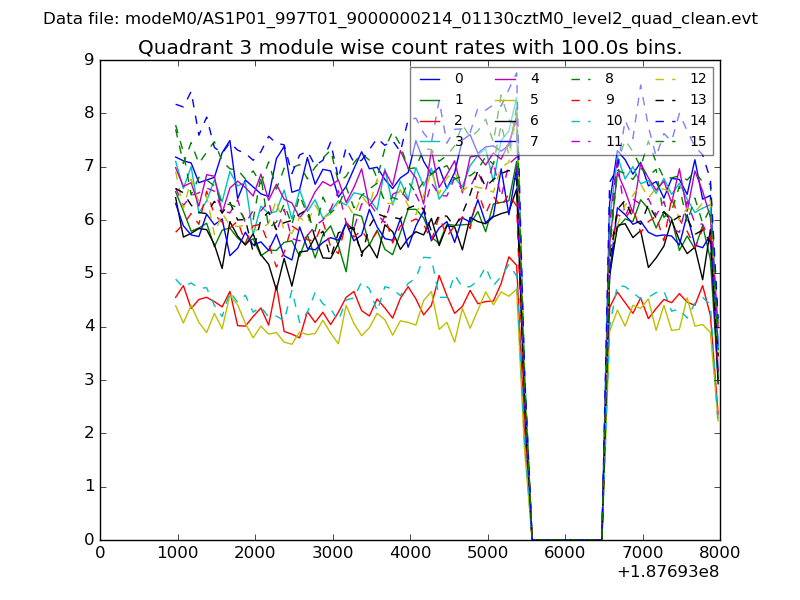
| Module-wise count rates for Quadrant A Data is divided into 100 sec bins |
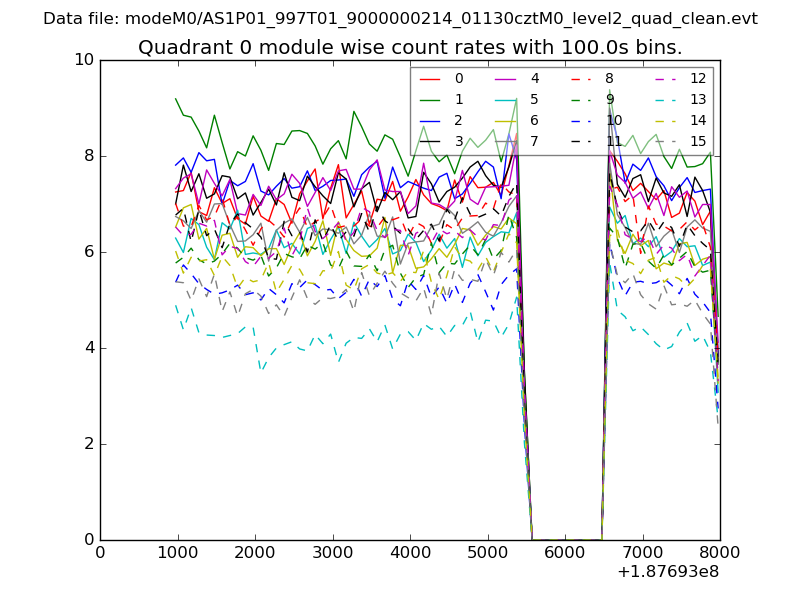 |
 |
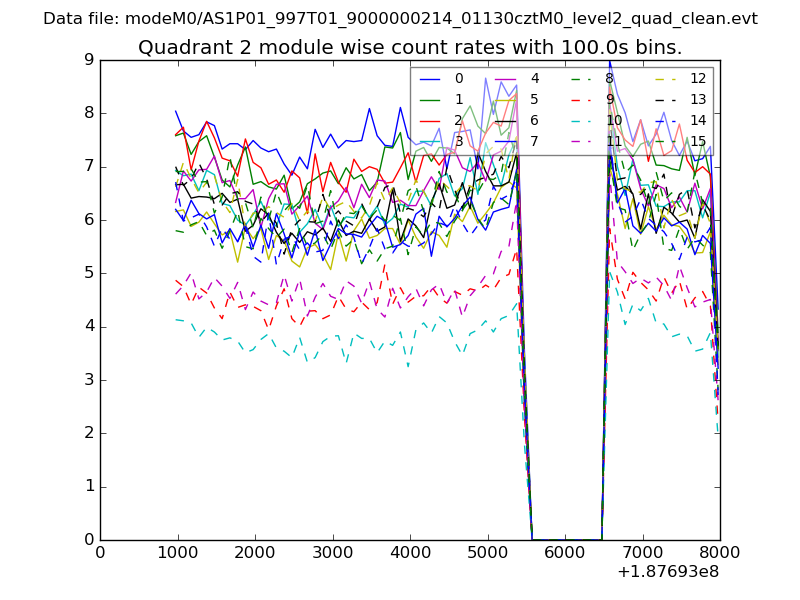
| Module-wise count rates for Quadrant B Data is divided into 100 sec bins |
 |
 |
| Module-wise count rates for Quadrant C Data is divided into 100 sec bins |
 |
 |
| Module-wise count rates for Quadrant D Data is divided into 100 sec bins |
 |
 |
| Parameter | Plot |
|---|---|
| CZT HV Monitor | 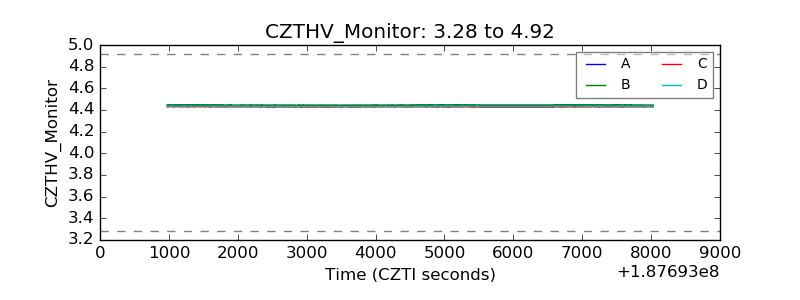 |
| D_VDD |  |
| Temperature 1 | 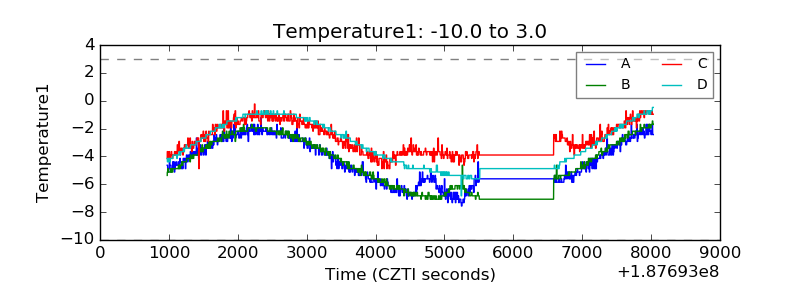 |
| Veto HV Monitor | 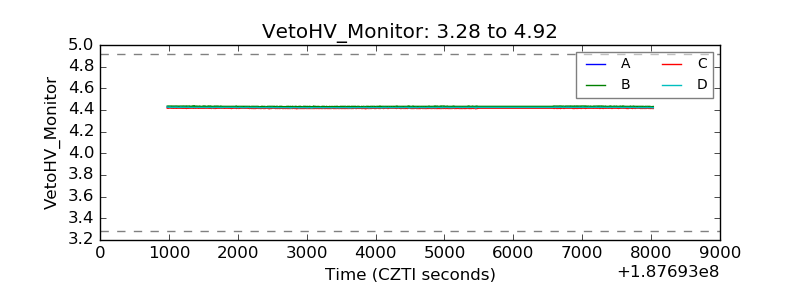 |
| Veto LLD | 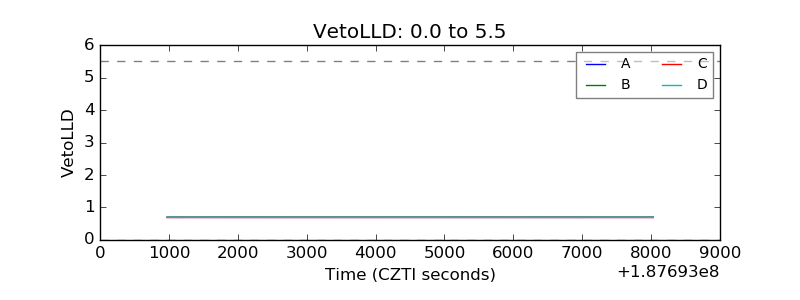 |
| Alpha Counter | 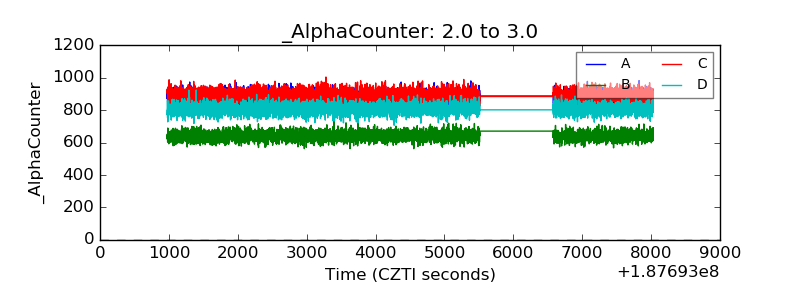 |
| _CPM_Rate | 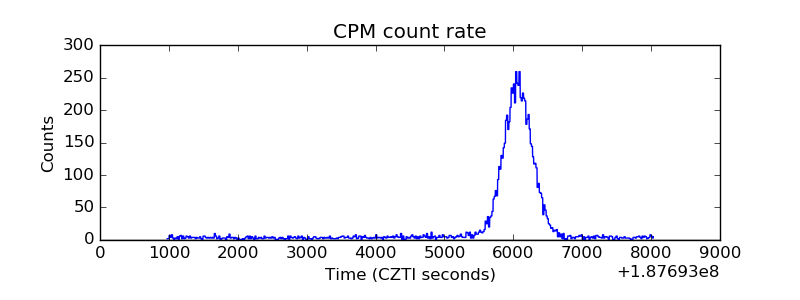 |
| CZT Counter | 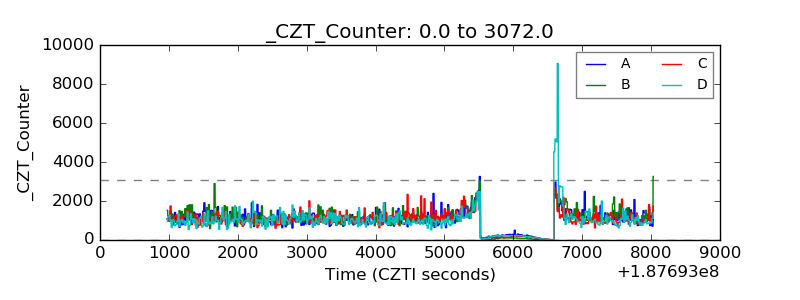 |
| +2.5 Volts monitor |  |
| +5 Volts monitor |  |
| _ROLL_ROT | 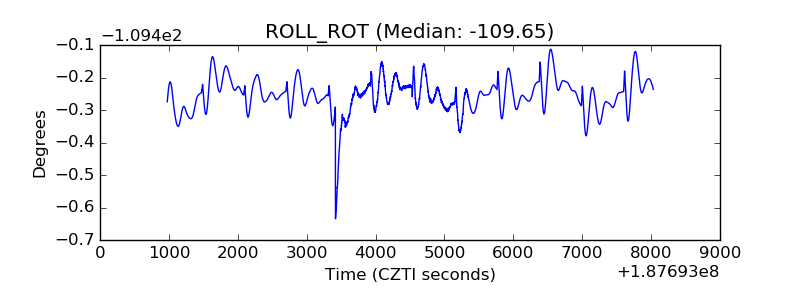 |
| _Roll_DEC | 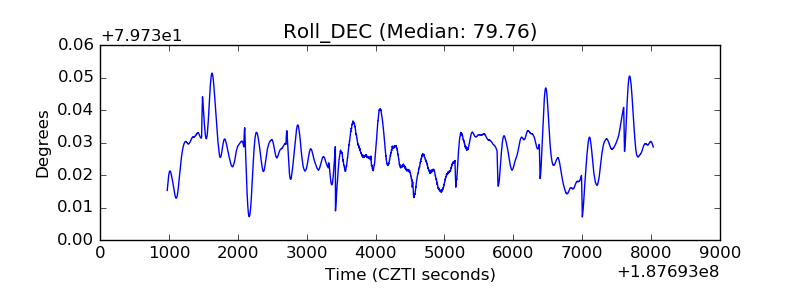 |
| _Roll_RA | 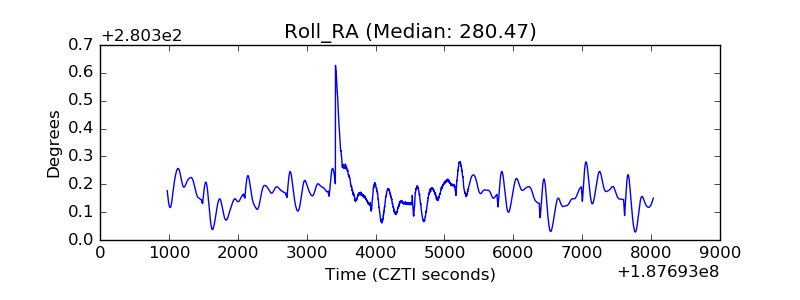 |
| Veto Counter | 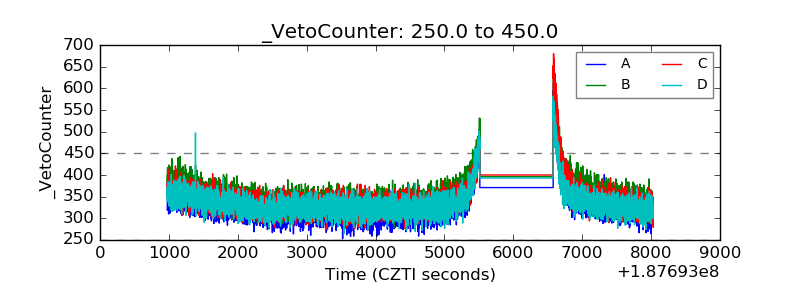 |