| Param | Original file | Final file |
|---|---|---|
| Filename | modeM0/AS1P01_997T01_9000000214_01131cztM0_level2.evt | modeM0/AS1P01_997T01_9000000214_01131cztM0_level2_quad_clean.evt |
| Size (bytes) | 987,877,440 | 96,094,080 |
| Size | 942.1 MB | 91.6 MB |
| Events in quadrant A | 7,440,222 | 632,009 |
| Events in quadrant B | 7,769,347 | 626,535 |
| Events in quadrant C | 7,602,872 | 606,265 |
| Events in quadrant D | 6,684,156 | 602,654 |
| Mode M9 | |||
|---|---|---|---|
| Quadrant | BADHDUFLAG | Total packets | Discarded packets |
| A | 0 | 8 | 0 |
| B | 0 | 8 | 0 |
| C | 0 | 8 | 0 |
| D | 0 | 8 | 0 |
| Mode M0 | |||
|---|---|---|---|
| Quadrant | BADHDUFLAG | Total packets | Discarded packets |
| A | 0 | 26616 | 2 |
| B | 0 | 27581 | 1 |
| C | 0 | 27050 | 1 |
| D | 0 | 24398 | 1 |
| Mode SS | |||
|---|---|---|---|
| Quadrant | BADHDUFLAG | Total packets | Discarded packets |
| A | 0 | 128 | 0 |
| B | 0 | 128 | 0 |
| C | 0 | 128 | 0 |
| D | 0 | 128 | 0 |
| Quadrant | Total seconds | Saturated seconds | Saturation percentage |
|---|---|---|---|
| A | 6347 | 11 | 0.173310% |
| B | 6347 | 21 | 0.330865% |
| C | 6347 | 19 | 0.299354% |
| D | 6347 | 5 | 0.078777% |
Noise dominated data is calculated using 1-second bins in cleaned event files. If a bin has >2000 counts, and if more than 50% of those come from <1% of pixels, then it is considered to be noise-dominated and hence unusable.
| Quadrant | # 1 sec bins | Bins with >0 counts | Bins with >2000 counts | High rate bins dominated by noise | Noise dominated (total time) | Noise dominated (detector-on time) | Marked lightcurve |
|---|---|---|---|---|---|---|---|
| A | 7167 | 6348 | 208 | 208 | 2.90% | 3.28% | 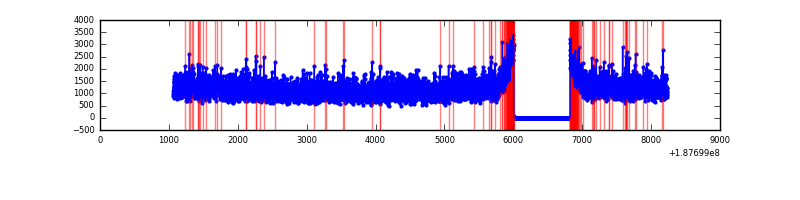 |
| B | 7167 | 6348 | 197 | 197 | 2.75% | 3.10% | 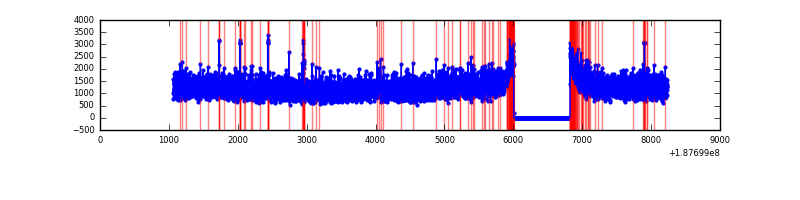 |
| C | 7167 | 6348 | 184 | 184 | 2.57% | 2.90% | 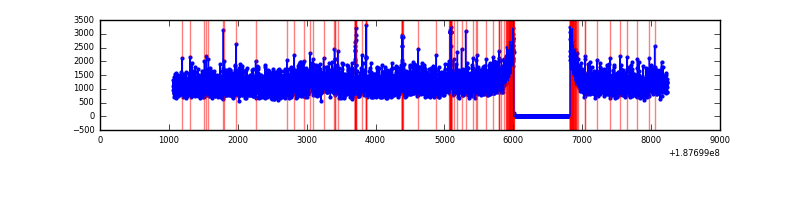 |
| D | 7167 | 6348 | 114 | 114 | 1.59% | 1.80% | 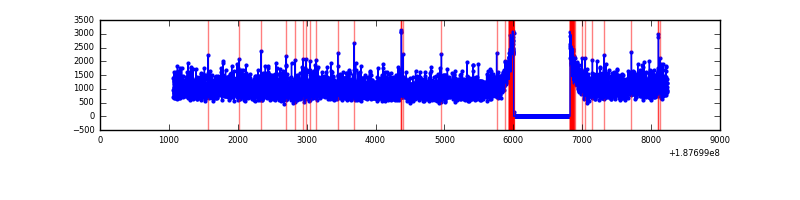 |
Top three noisy pixels from each quadrant. If the there are fewer than three noisy pixels in the level2.evt file, extra rows are filled as -1
| Pixel properties | Quadrant properties | ||||||
|---|---|---|---|---|---|---|---|
| Quadrant | DetID | PixID | Counts | Sigma | Mean | Median | Sigma |
| A | 12 | 243 | 7933 | 12.86 | 1938 | 1946 | 465.7 |
| A | 11 | 79 | 6339 | 9.43 | 1938 | 1946 | 465.7 |
| A | 3 | 111 | 6090 | 8.9 | 1938 | 1946 | 465.7 |
| B | 15 | 22 | 112597 | 237.14 | 1977 | 1986 | 466.4 |
| B | 8 | 234 | 35084 | 70.96 | 1977 | 1986 | 466.4 |
| B | 5 | 249 | 29063 | 58.05 | 1977 | 1986 | 466.4 |
| C | 15 | 241 | 349632 | 694.91 | 1801 | 1866 | 500.5 |
| C | 9 | 54 | 98590 | 193.27 | 1801 | 1866 | 500.5 |
| C | 0 | 236 | 42326 | 80.85 | 1801 | 1866 | 500.5 |
| D | 10 | 125 | 30422 | 52.36 | 1769 | 1834 | 545.9 |
| D | 2 | 16 | 19438 | 32.24 | 1769 | 1834 | 545.9 |
| D | 12 | 22 | 11872 | 18.39 | 1769 | 1834 | 545.9 |
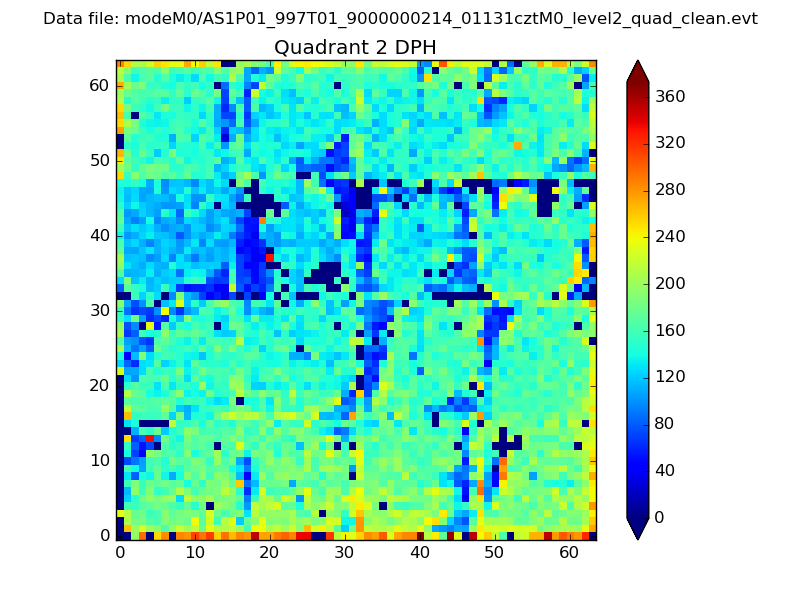
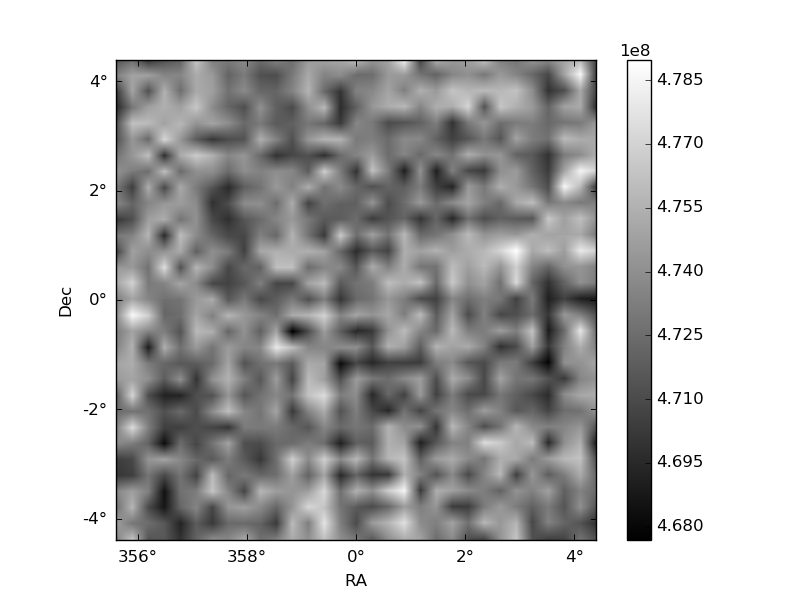
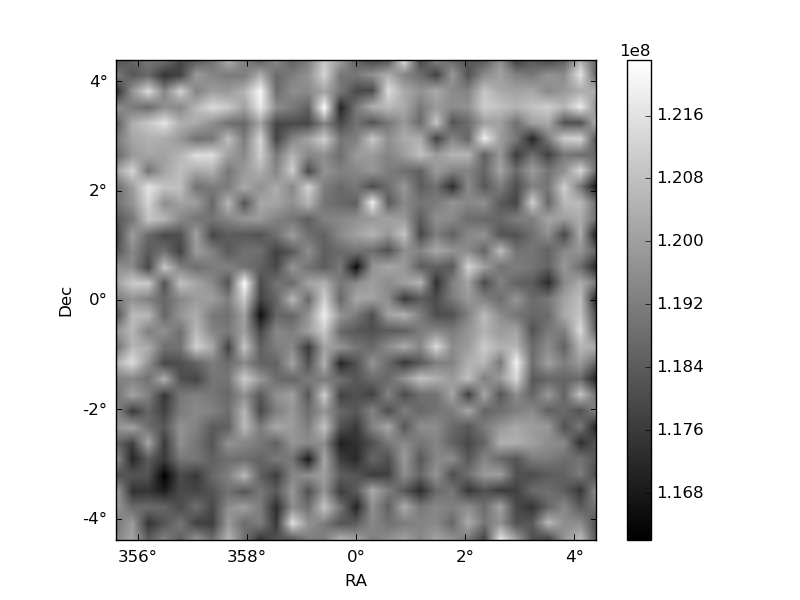
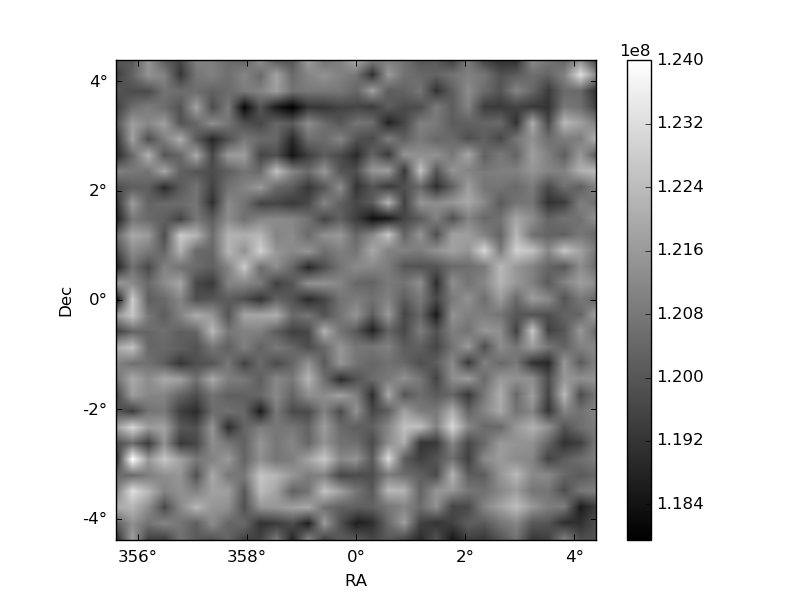
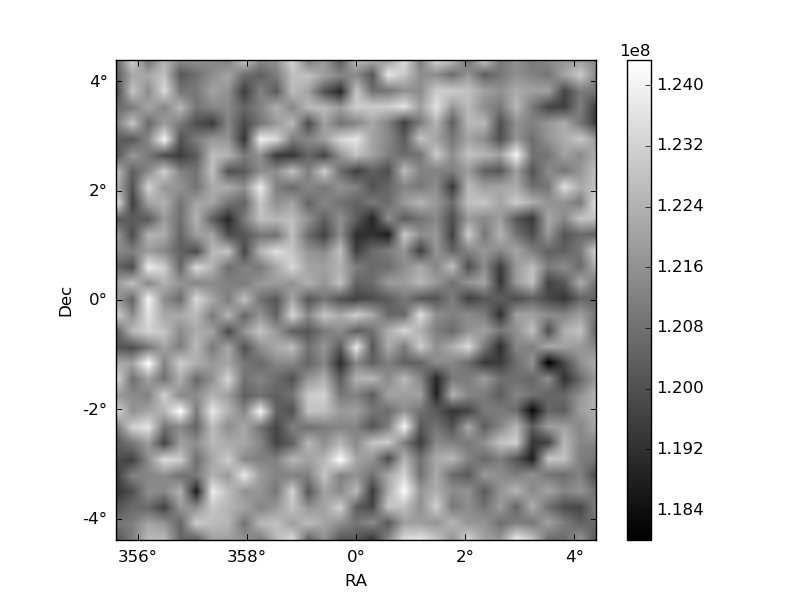
Histogram calculated using DETX and DETY for each event in the final _common_clean file
| Quadrant A | 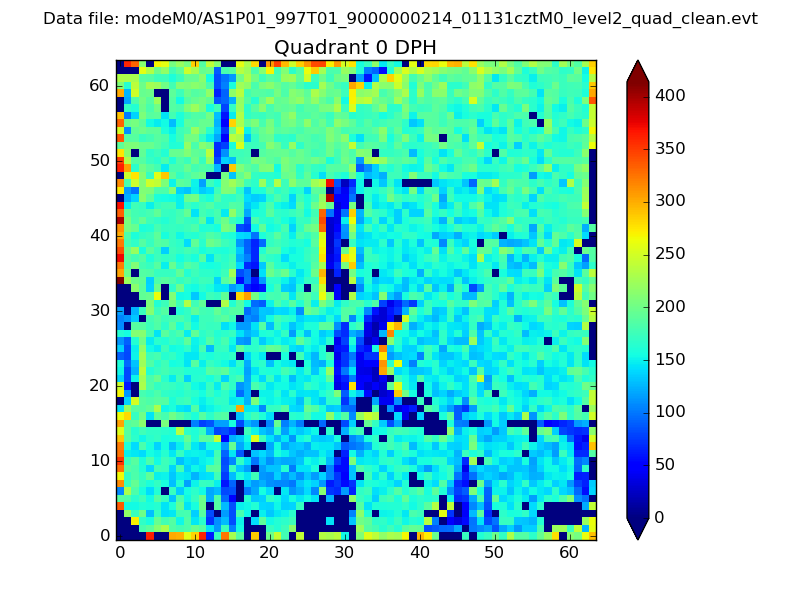 |
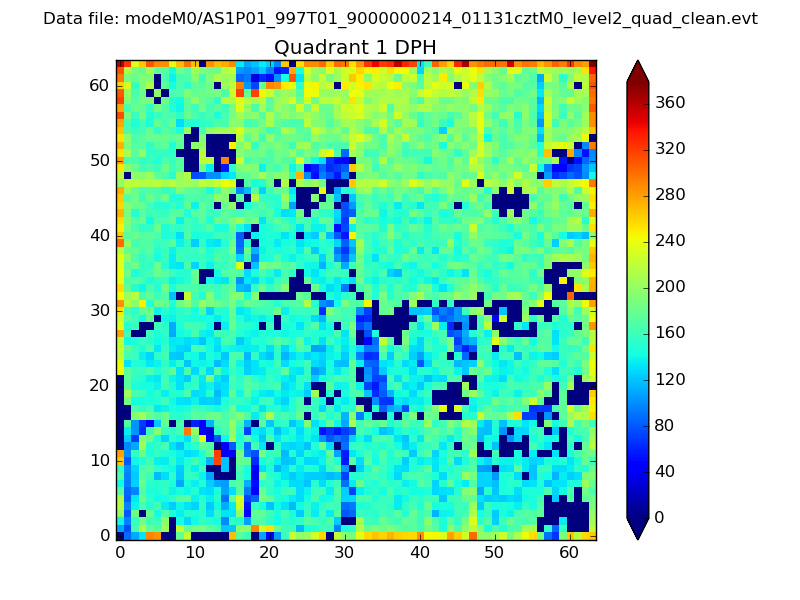 |
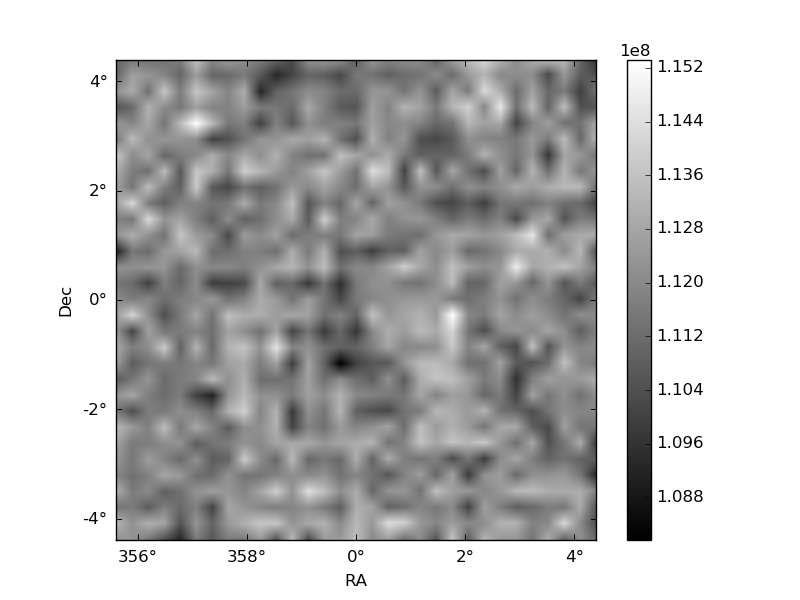
Quadrant B |
|---|---|---|---|
| Quadrant D | 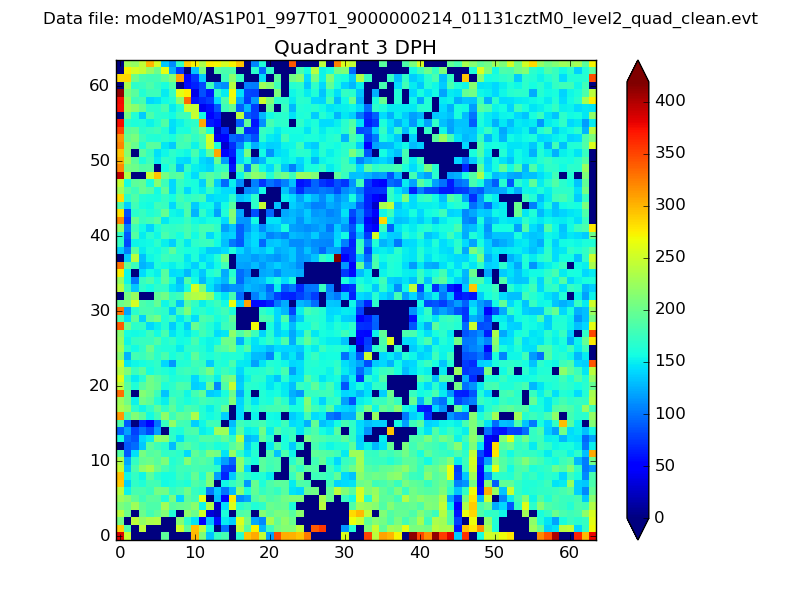 |
 |
Quadrant C |
| Plot type | Count rate plots | Images |
|---|---|---|
| Comparison with Poisson distribution Blue bars denote a histogram of data divided into 1 sec bins. Red curve is a Poisson curve with rate = median count rate of data. |
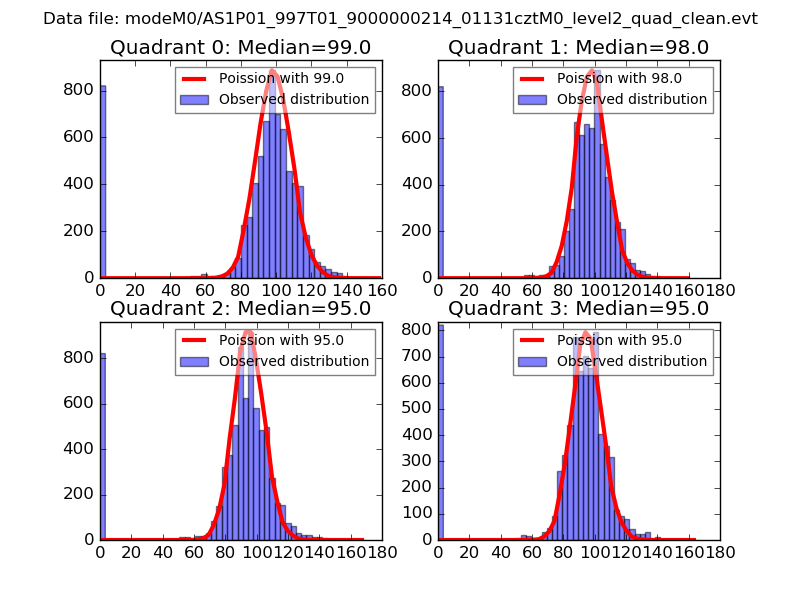 |
 |
| Quadrant-wise count rates Data is divided into 100 sec bins |
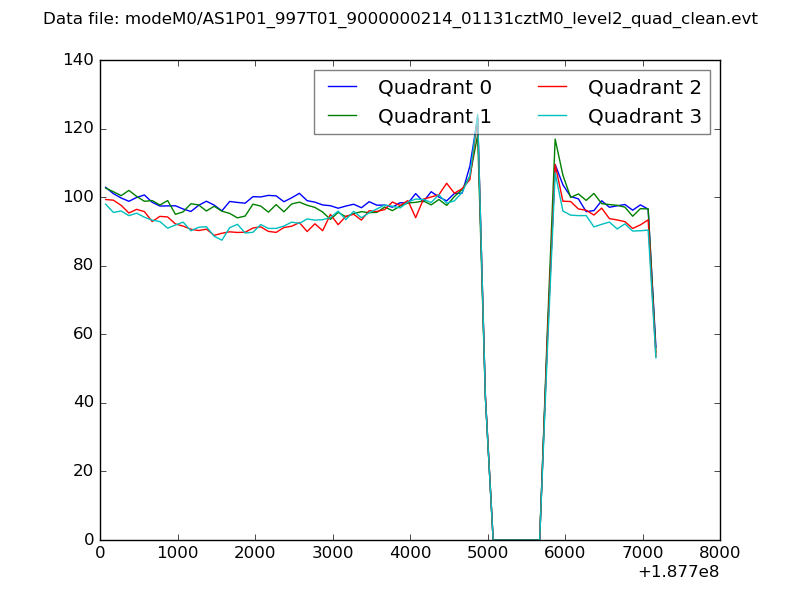 |
|
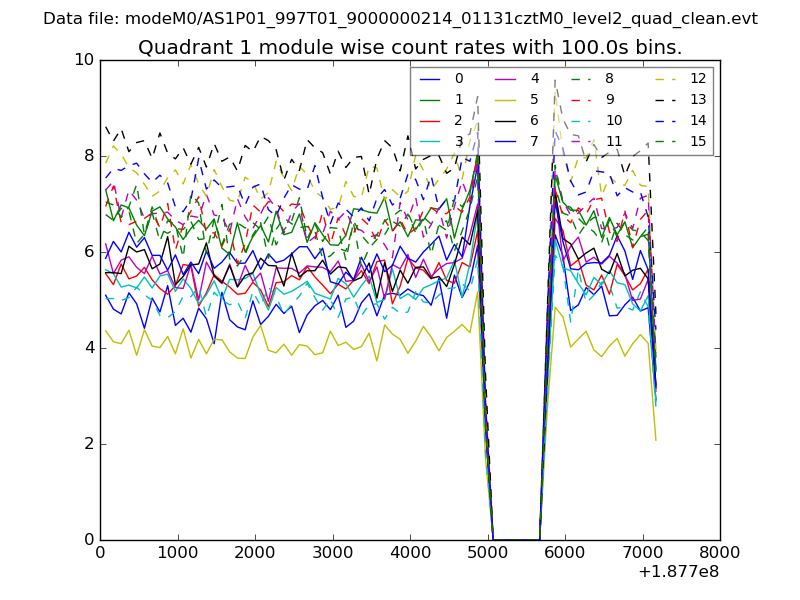
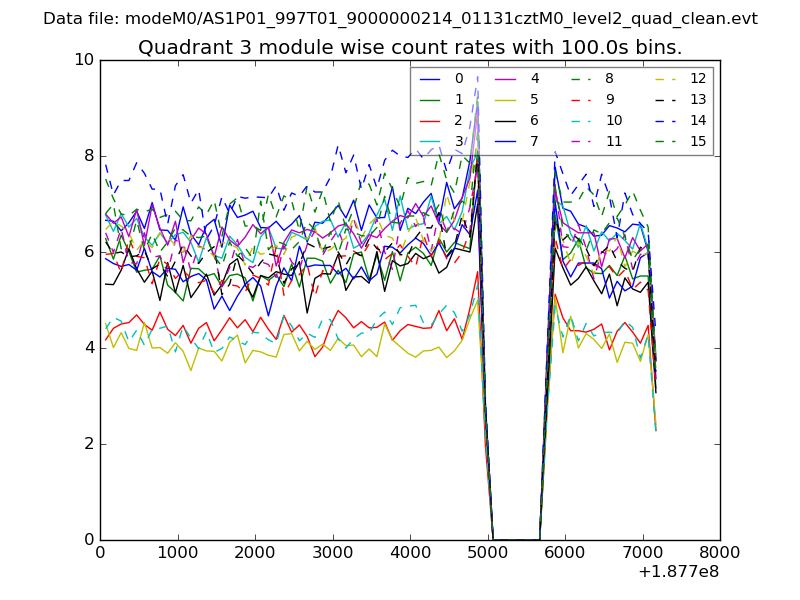
| Module-wise count rates for Quadrant A Data is divided into 100 sec bins |
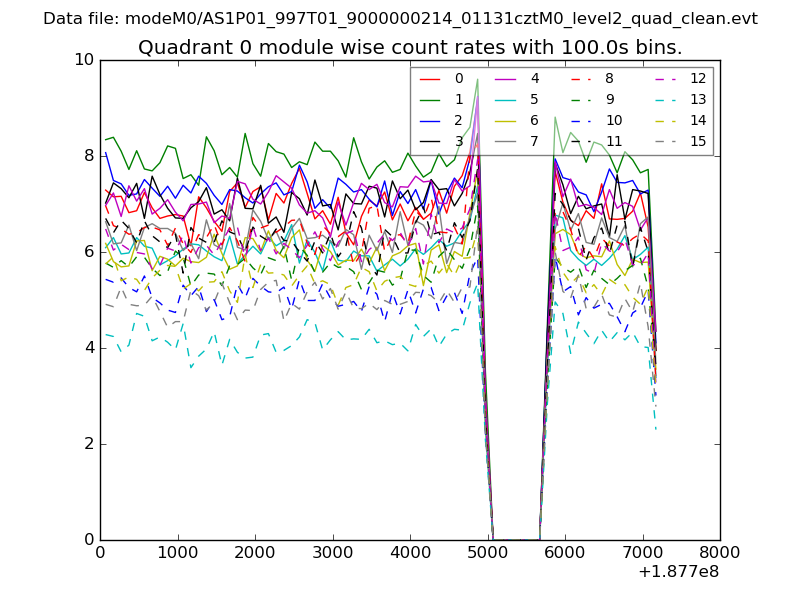 |
 |
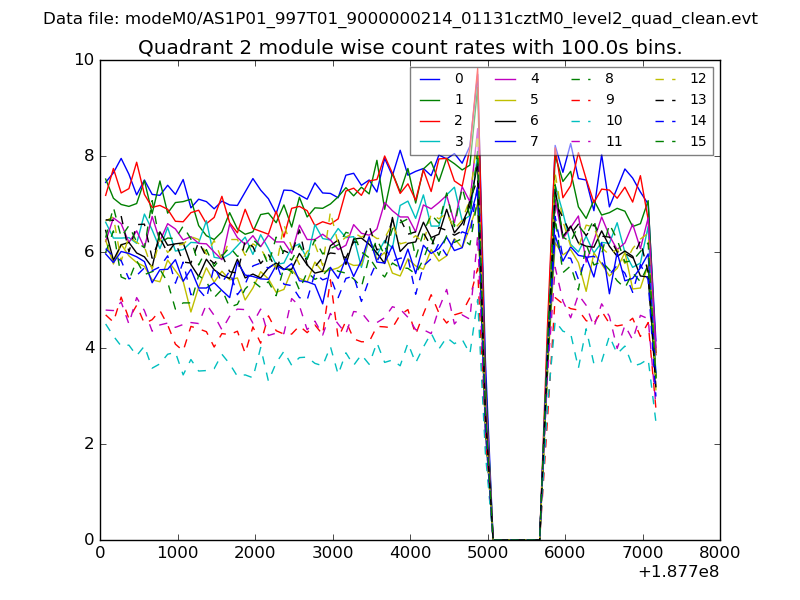
| Module-wise count rates for Quadrant B Data is divided into 100 sec bins |
 |
 |
| Module-wise count rates for Quadrant C Data is divided into 100 sec bins |
 |
 |
| Module-wise count rates for Quadrant D Data is divided into 100 sec bins |
 |
 |
| Parameter | Plot |
|---|---|
| CZT HV Monitor | 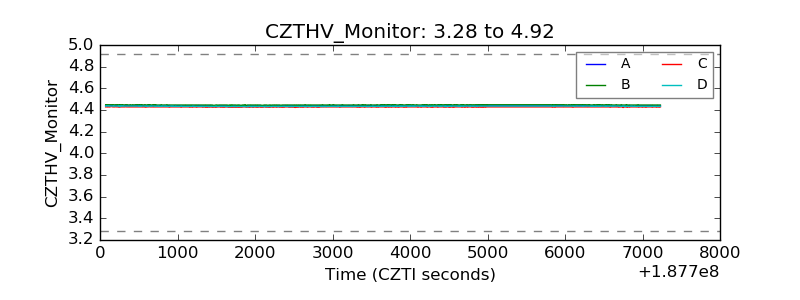 |
| D_VDD | 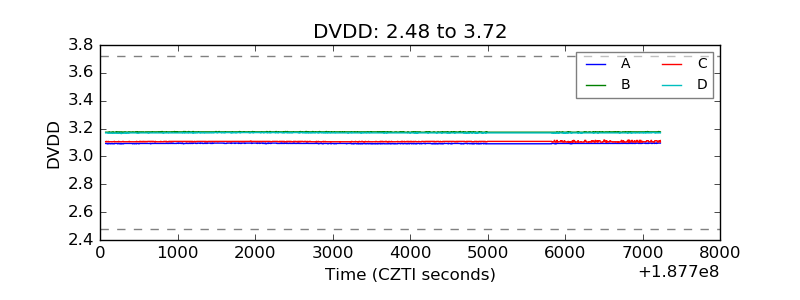 |
| Temperature 1 | 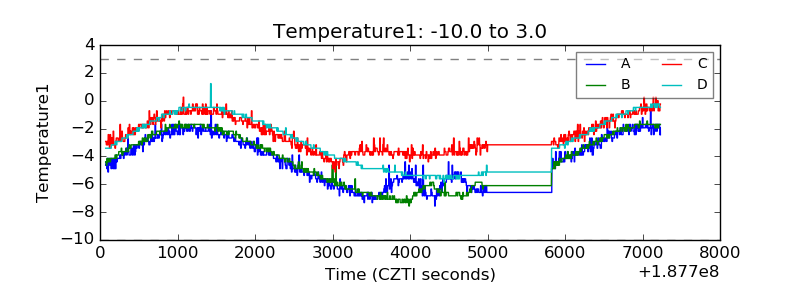 |
| Veto HV Monitor | 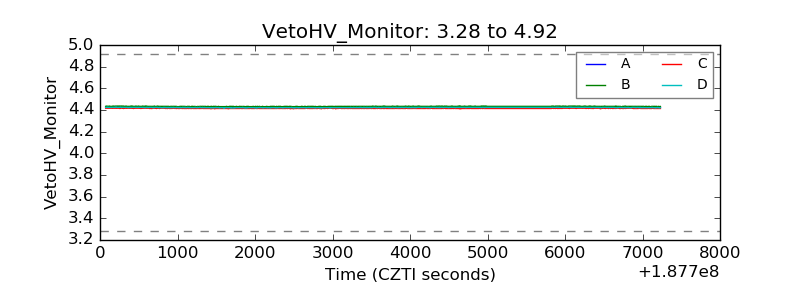 |
| Veto LLD | 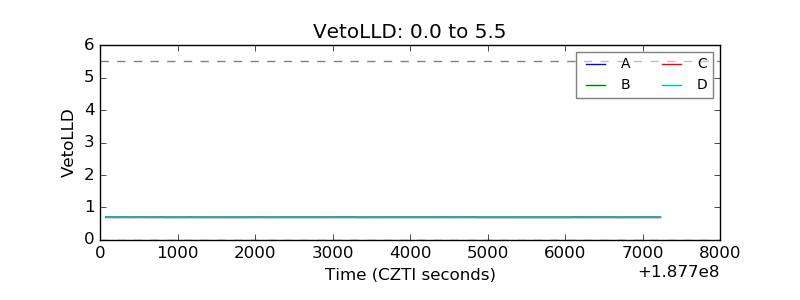 |
| Alpha Counter | 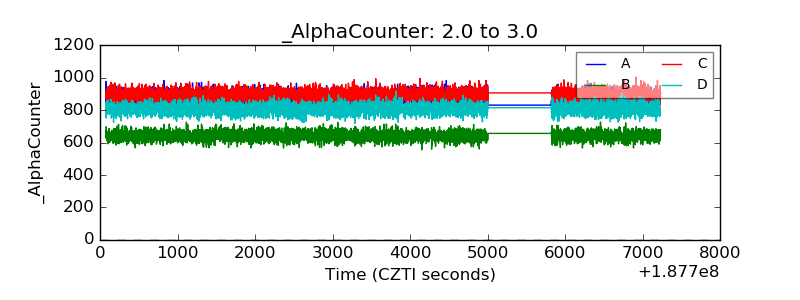 |
| _CPM_Rate | 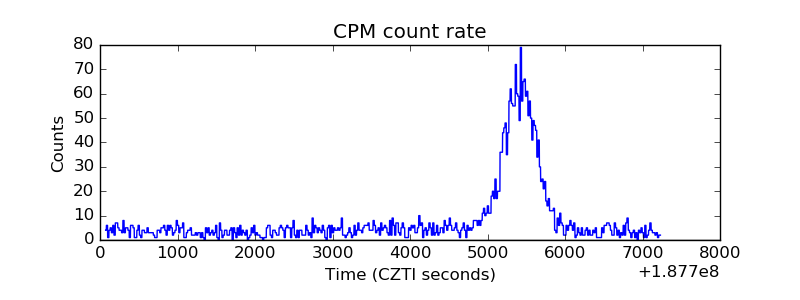 |
| CZT Counter | 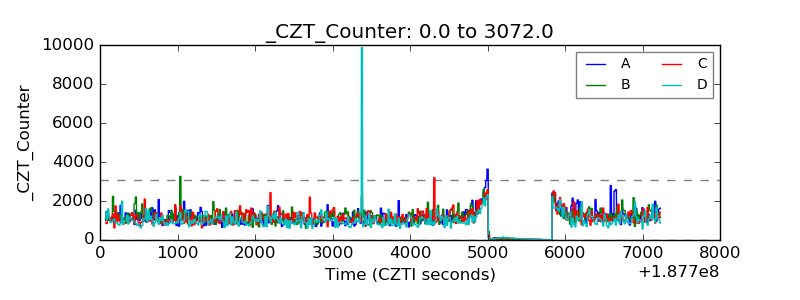 |
| +2.5 Volts monitor |  |
| +5 Volts monitor | 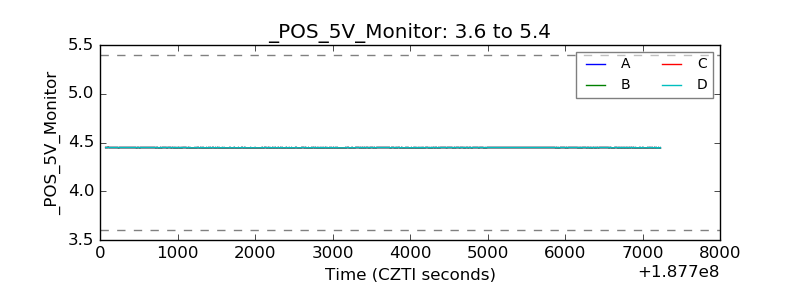 |
| _ROLL_ROT | 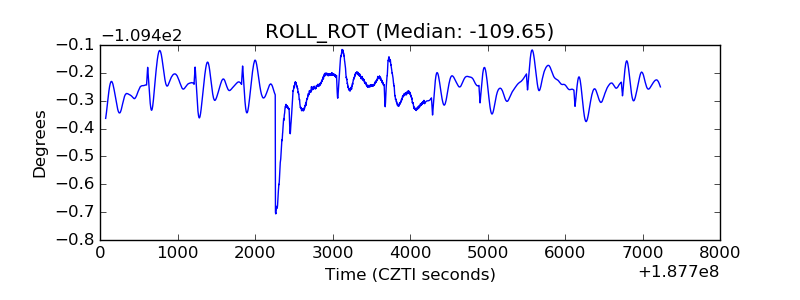 |
| _Roll_DEC | 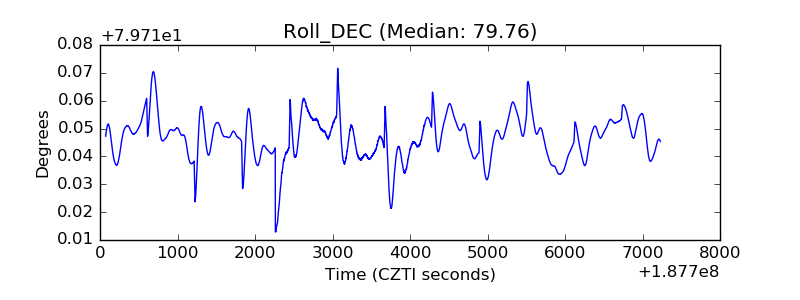 |
| _Roll_RA | 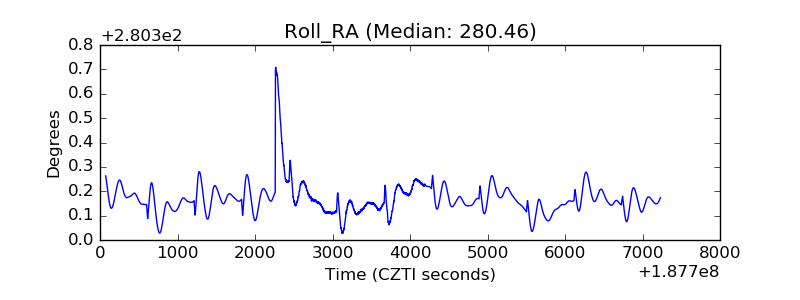 |
| Veto Counter | 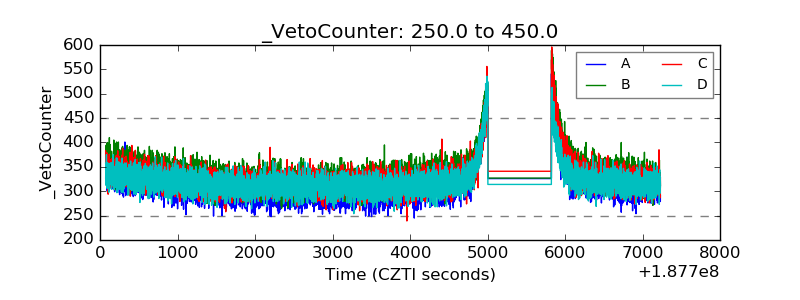 |