| Param | Original file | Final file |
|---|---|---|
| Filename | modeM0/AS1P01_997T01_9000000214_01133cztM0_level2.evt | modeM0/AS1P01_997T01_9000000214_01133cztM0_level2_quad_clean.evt |
| Size (bytes) | 197,441,280 | 18,616,320 |
| Size | 188.3 MB | 17.8 MB |
| Events in quadrant A | 1,509,443 | 121,295 |
| Events in quadrant B | 1,518,305 | 120,742 |
| Events in quadrant C | 1,471,280 | 113,343 |
| Events in quadrant D | 1,393,899 | 113,235 |
| Mode M0 | |||
|---|---|---|---|
| Quadrant | BADHDUFLAG | Total packets | Discarded packets |
| A | 0 | 5366 | 0 |
| B | 0 | 5409 | 0 |
| C | 0 | 5253 | 0 |
| D | 0 | 5030 | 0 |
| Mode SS | |||
|---|---|---|---|
| Quadrant | BADHDUFLAG | Total packets | Discarded packets |
| A | 0 | 26 | 0 |
| B | 0 | 26 | 0 |
| C | 0 | 26 | 0 |
| D | 0 | 26 | 0 |
| Quadrant | Total seconds | Saturated seconds | Saturation percentage |
|---|---|---|---|
| A | 1254 | 0 | 0.000000% |
| B | 1254 | 2 | 0.159490% |
| C | 1254 | 1 | 0.079745% |
| D | 1254 | 0 | 0.000000% |
Noise dominated data is calculated using 1-second bins in cleaned event files. If a bin has >2000 counts, and if more than 50% of those come from <1% of pixels, then it is considered to be noise-dominated and hence unusable.
| Quadrant | # 1 sec bins | Bins with >0 counts | Bins with >2000 counts | High rate bins dominated by noise | Noise dominated (total time) | Noise dominated (detector-on time) | Marked lightcurve |
|---|---|---|---|---|---|---|---|
| A | 1254 | 1254 | 14 | 14 | 1.12% | 1.12% | 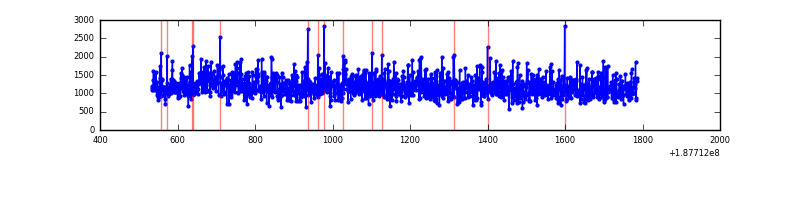 |
| B | 1254 | 1254 | 15 | 15 | 1.20% | 1.20% | 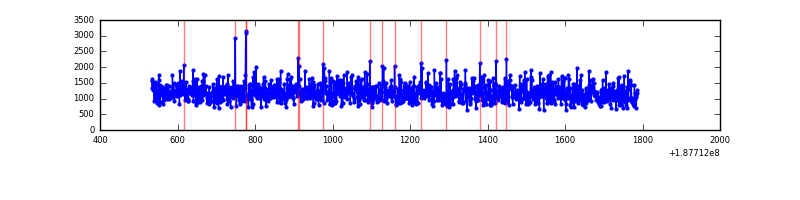 |
| C | 1254 | 1254 | 13 | 13 | 1.04% | 1.04% | 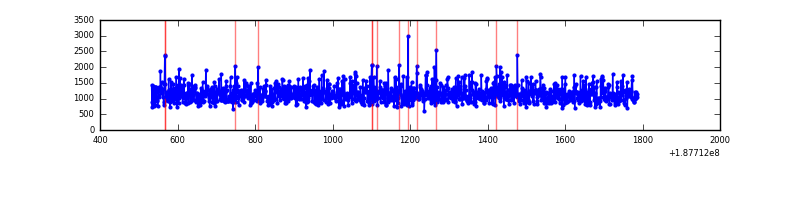 |
| D | 1254 | 1254 | 7 | 7 | 0.56% | 0.56% | 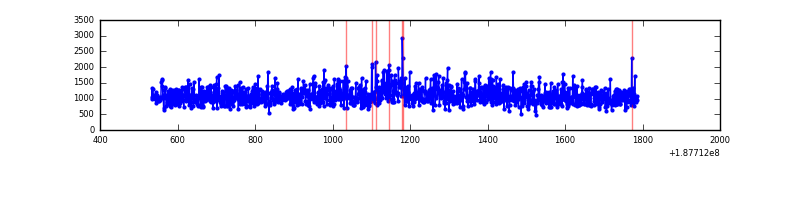 |
Top three noisy pixels from each quadrant. If the there are fewer than three noisy pixels in the level2.evt file, extra rows are filled as -1
| Pixel properties | Quadrant properties | ||||||
|---|---|---|---|---|---|---|---|
| Quadrant | DetID | PixID | Counts | Sigma | Mean | Median | Sigma |
| A | 11 | 79 | 2024 | 17.04 | 393 | 395 | 95.6 |
| A | 3 | 111 | 1096 | 7.33 | 393 | 395 | 95.6 |
| A | 14 | 203 | 1053 | 6.88 | 393 | 395 | 95.6 |
| B | 15 | 22 | 16027 | 167.25 | 386 | 387 | 93.5 |
| B | 15 | 85 | 10736 | 110.67 | 386 | 387 | 93.5 |
| B | 5 | 249 | 9633 | 98.88 | 386 | 387 | 93.5 |
| C | 15 | 241 | 58522 | 575.45 | 356 | 369 | 101.1 |
| C | 3 | 79 | 7447 | 70.04 | 356 | 369 | 101.1 |
| C | 9 | 54 | 6667 | 62.32 | 356 | 369 | 101.1 |
| D | 13 | 73 | 12970 | 111.31 | 365 | 376 | 113.1 |
| D | 10 | 85 | 5140 | 42.1 | 365 | 376 | 113.1 |
| D | 13 | 252 | 4151 | 33.36 | 365 | 376 | 113.1 |
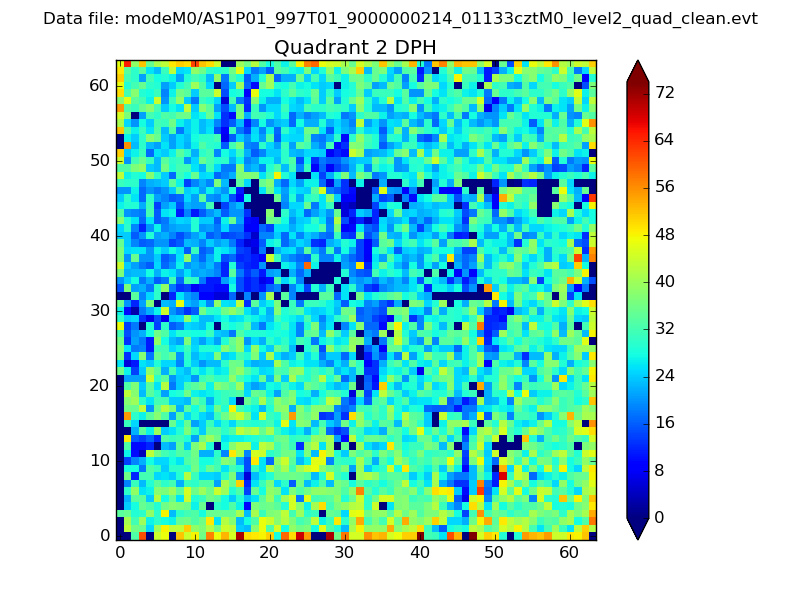
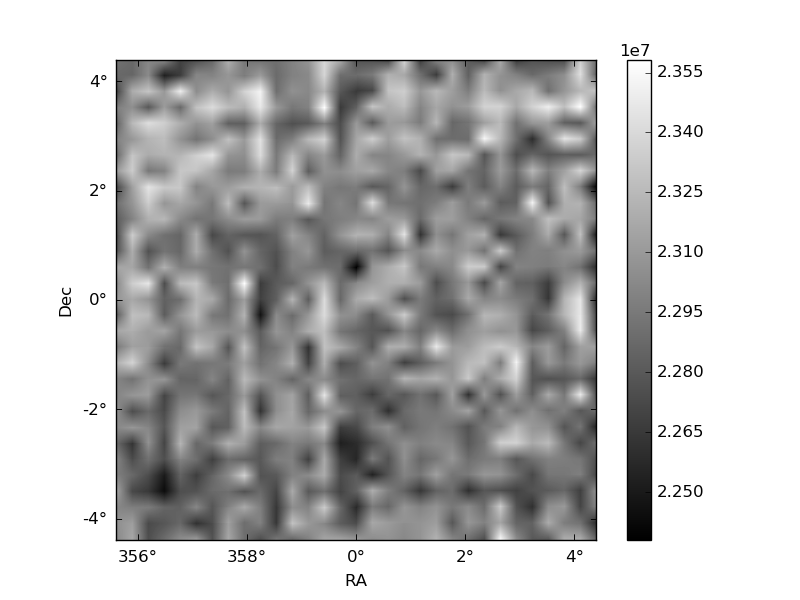
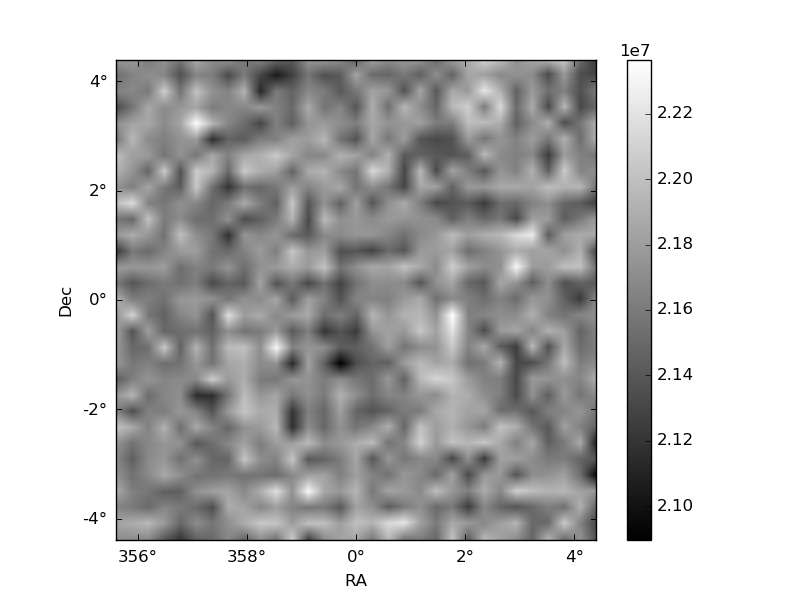
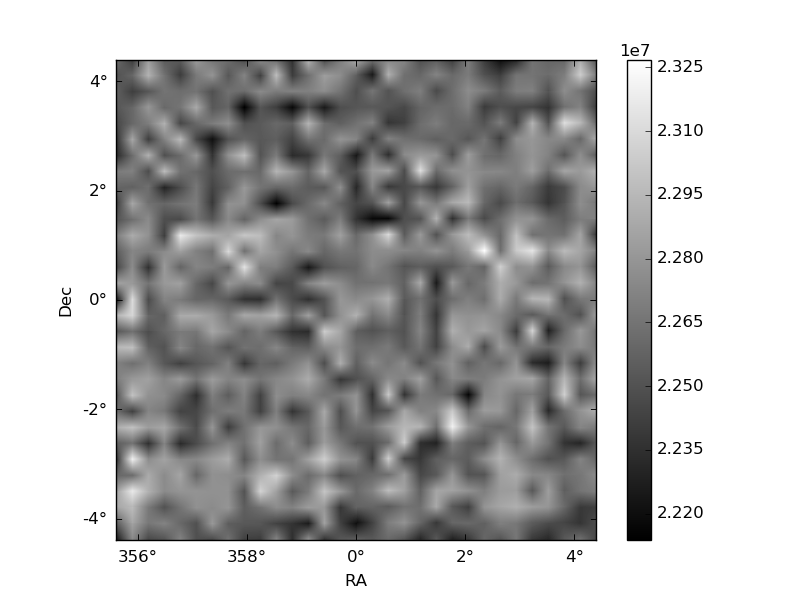
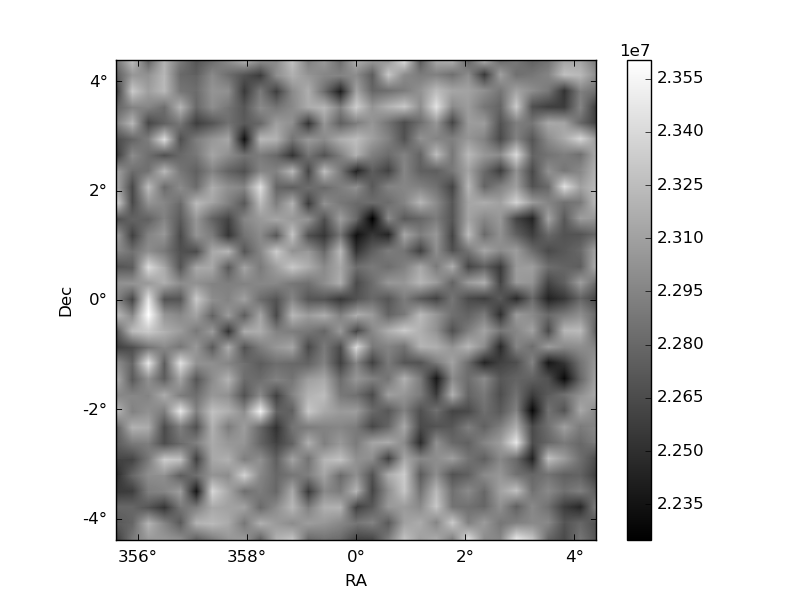
Histogram calculated using DETX and DETY for each event in the final _common_clean file
| Quadrant A | 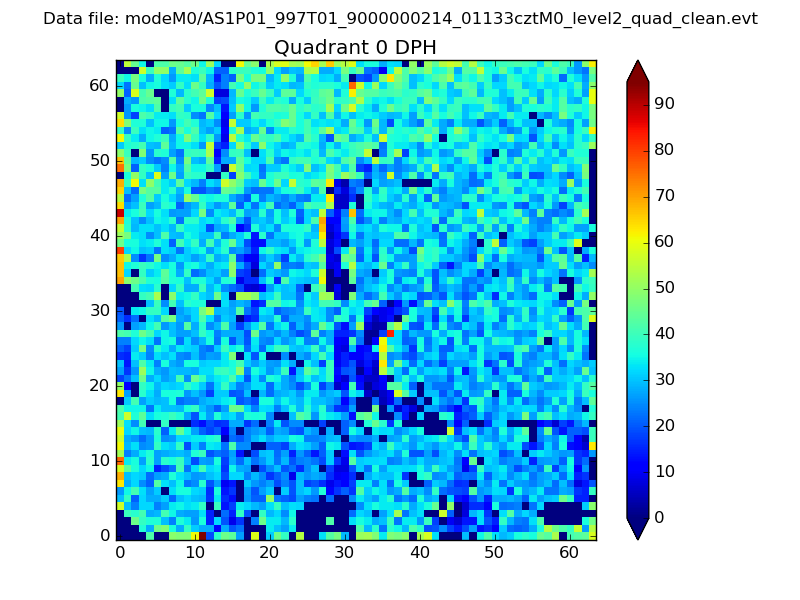 |
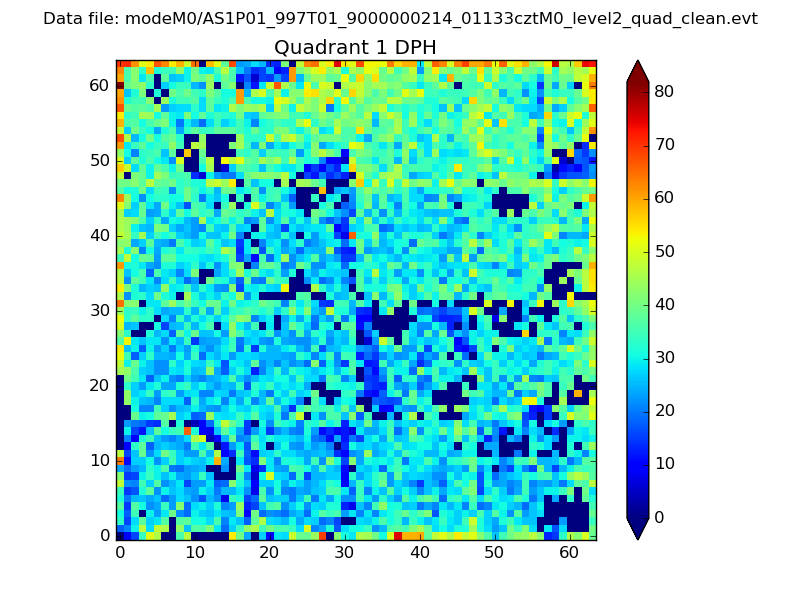 |
Quadrant B |
|---|---|---|---|
| Quadrant D | 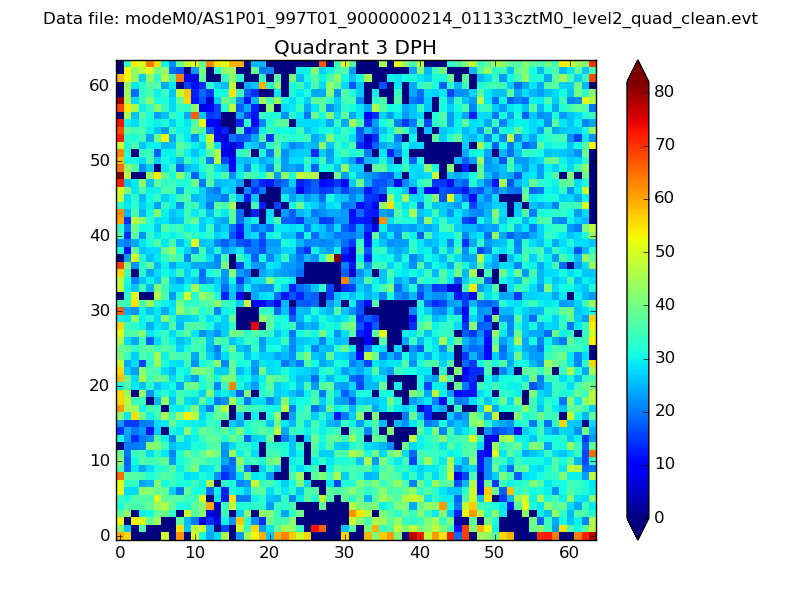 |
 |
Quadrant C |
| Plot type | Count rate plots | Images |
|---|---|---|
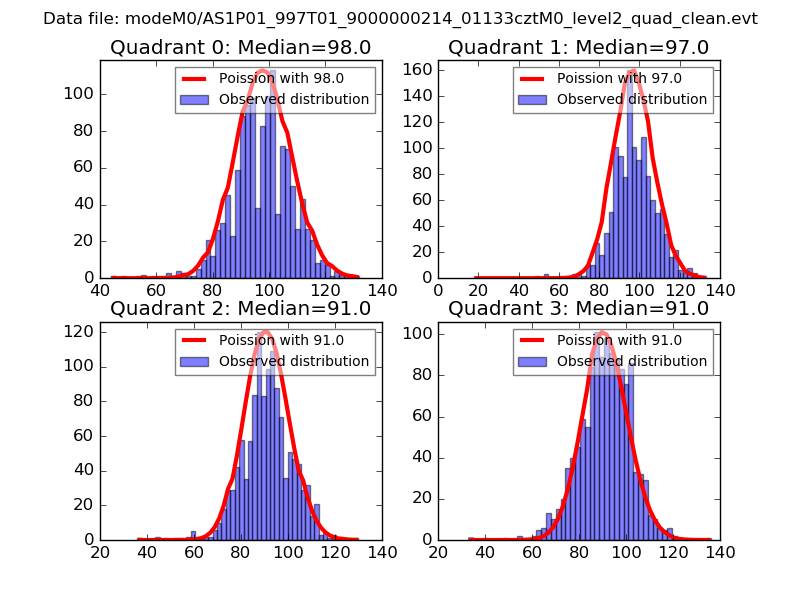
| Comparison with Poisson distribution Blue bars denote a histogram of data divided into 1 sec bins. Red curve is a Poisson curve with rate = median count rate of data. |
 |
 |
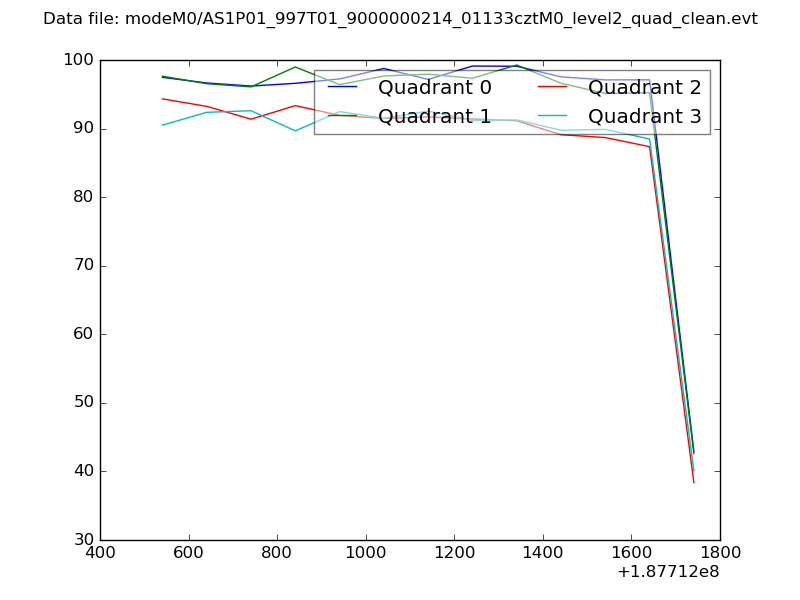
| Quadrant-wise count rates Data is divided into 100 sec bins |
 |
|
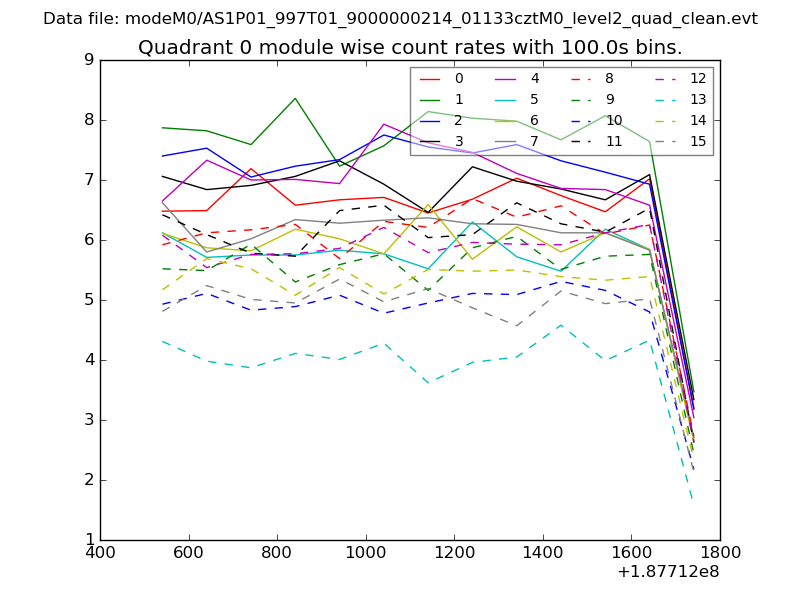
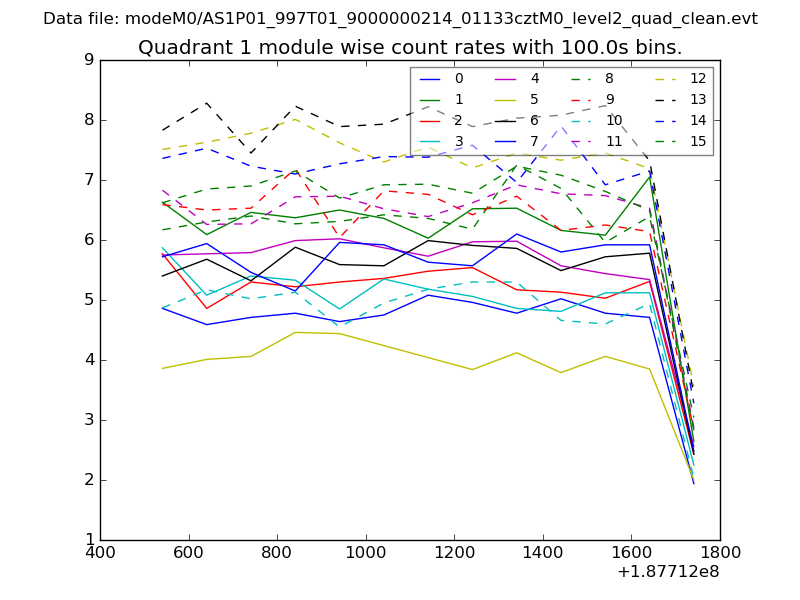
| Module-wise count rates for Quadrant A Data is divided into 100 sec bins |
 |
 |
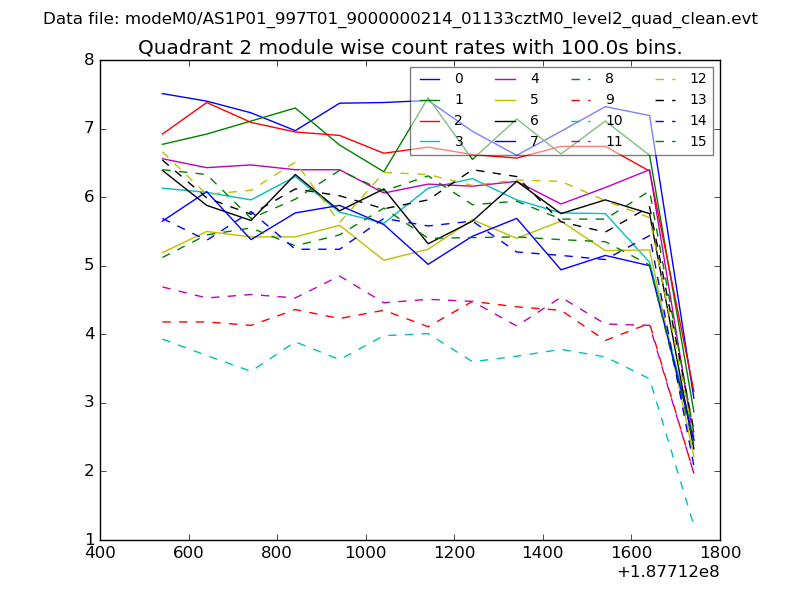
| Module-wise count rates for Quadrant B Data is divided into 100 sec bins |
 |
 |
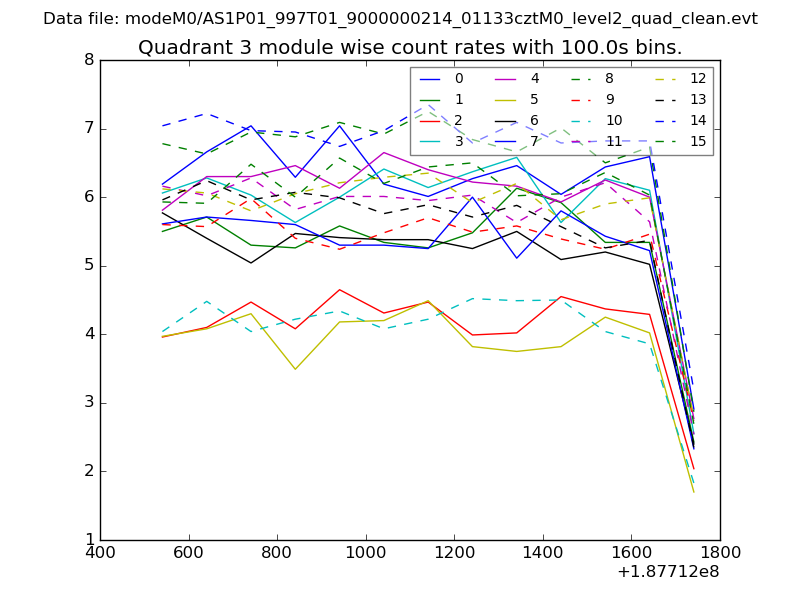
| Module-wise count rates for Quadrant C Data is divided into 100 sec bins |
 |
 |
| Module-wise count rates for Quadrant D Data is divided into 100 sec bins |
 |
 |
| Parameter | Plot |
|---|---|
| CZT HV Monitor | 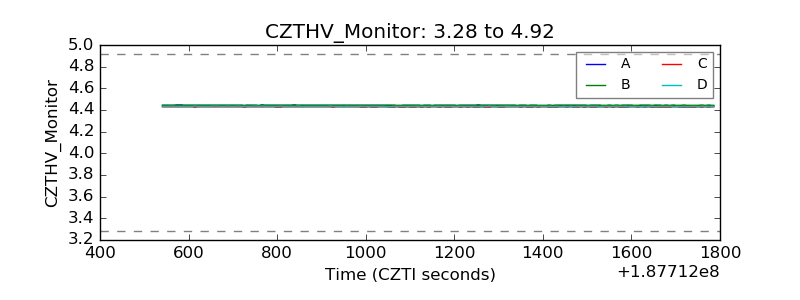 |
| D_VDD | 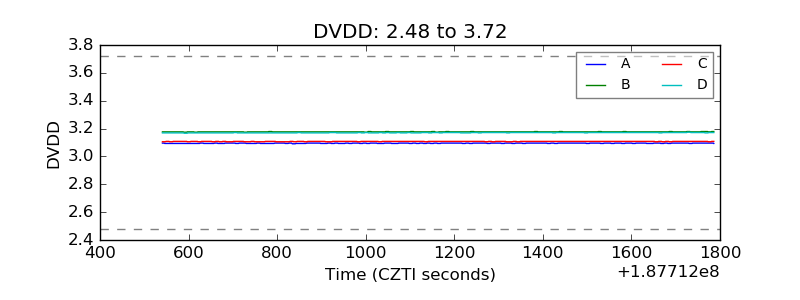 |
| Temperature 1 | 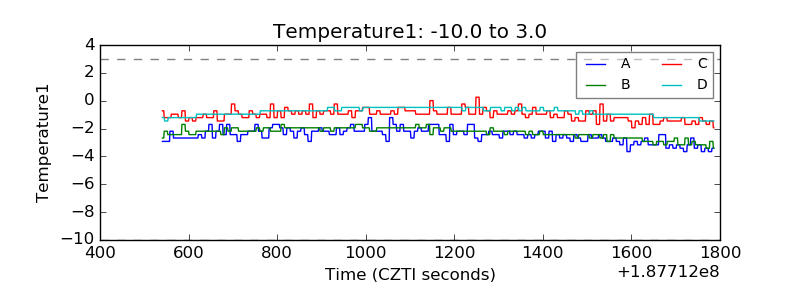 |
| Veto HV Monitor | 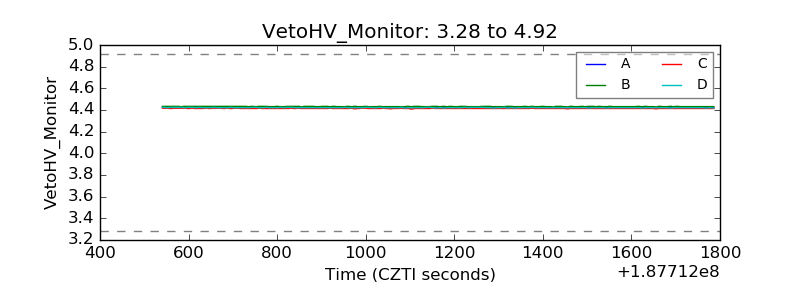 |
| Veto LLD | 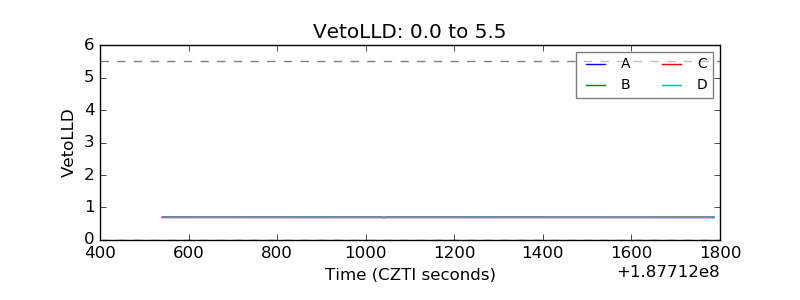 |
| Alpha Counter | 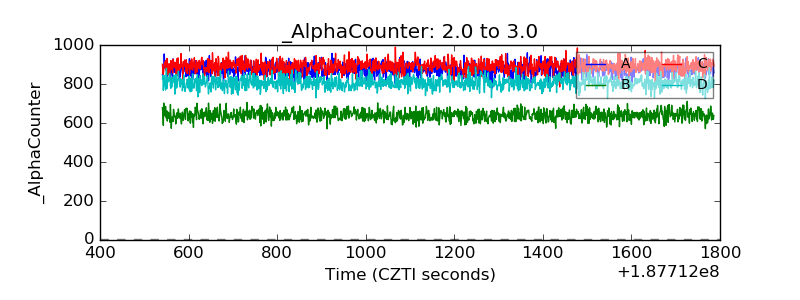 |
| _CPM_Rate | 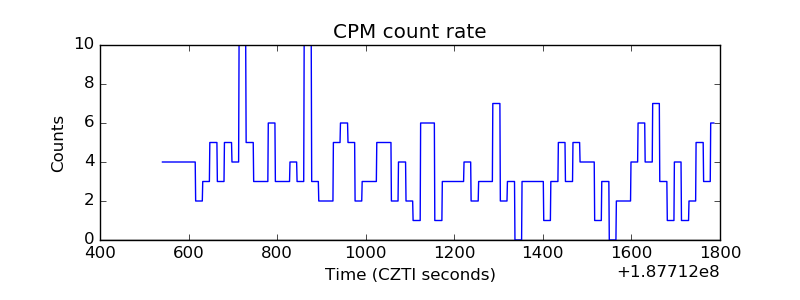 |
| CZT Counter | 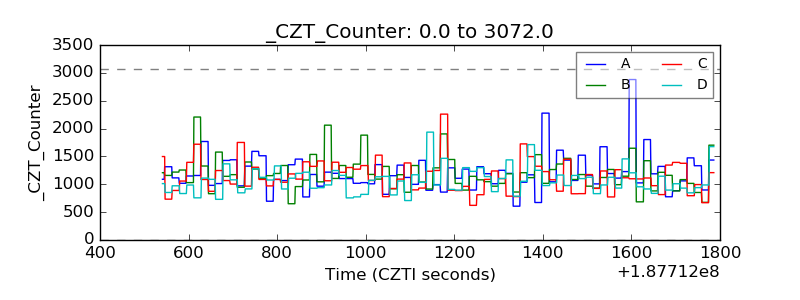 |
| +2.5 Volts monitor |  |
| +5 Volts monitor |  |
| _ROLL_ROT | 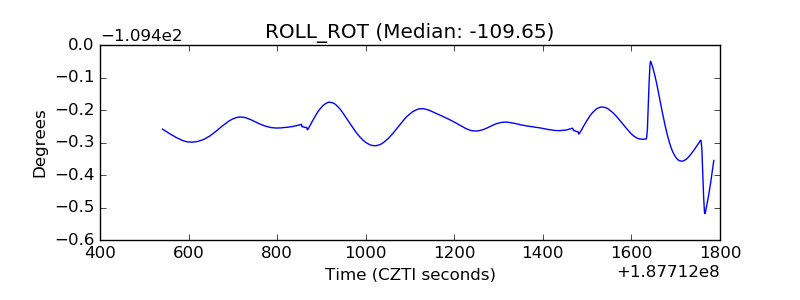 |
| _Roll_DEC | 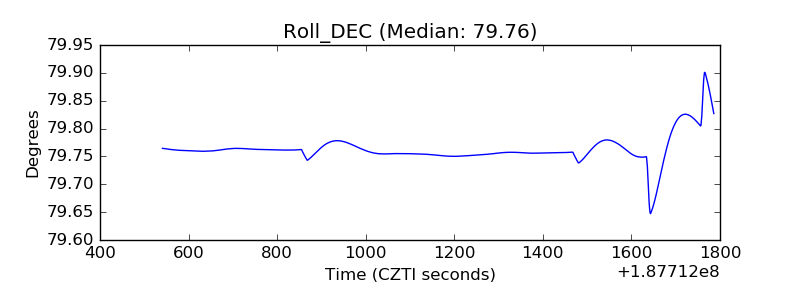 |
| _Roll_RA | 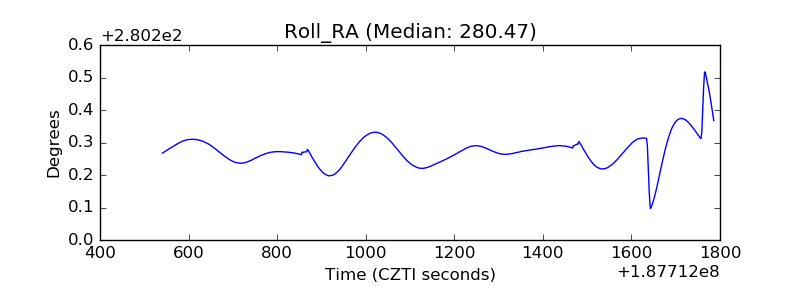 |
| Veto Counter | 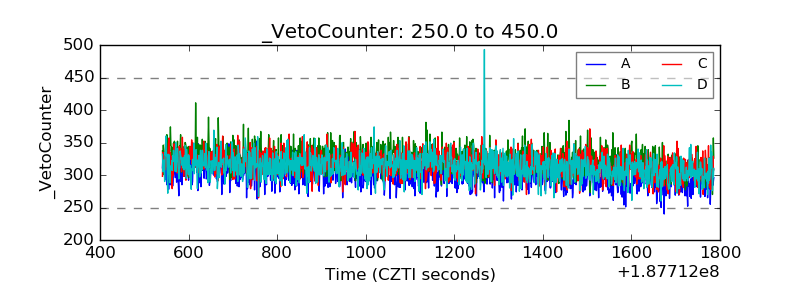 |