| Param | Original file | Final file |
|---|---|---|
| Filename | modeM0/AS1P01_997T03_9000000216_01133cztM0_level2.evt | modeM0/AS1P01_997T03_9000000216_01133cztM0_level2_quad_clean.evt |
| Size (bytes) | 974,499,840 | 90,584,640 |
| Size | 929.4 MB | 86.4 MB |
| Events in quadrant A | 7,345,784 | 589,971 |
| Events in quadrant B | 7,596,787 | 592,285 |
| Events in quadrant C | 7,447,364 | 571,557 |
| Events in quadrant D | 6,721,758 | 567,141 |
| Mode M0 | |||
|---|---|---|---|
| Quadrant | BADHDUFLAG | Total packets | Discarded packets |
| A | 0 | 26107 | 1 |
| B | 0 | 26842 | 0 |
| C | 0 | 26365 | 0 |
| D | 0 | 24273 | 0 |
| Mode SS | |||
|---|---|---|---|
| Quadrant | BADHDUFLAG | Total packets | Discarded packets |
| A | 0 | 122 | 0 |
| B | 0 | 122 | 0 |
| C | 0 | 122 | 0 |
| D | 0 | 122 | 0 |
| Quadrant | Total seconds | Saturated seconds | Saturation percentage |
|---|---|---|---|
| A | 6042 | 14 | 0.231711% |
| B | 6042 | 10 | 0.165508% |
| C | 6042 | 13 | 0.215161% |
| D | 6042 | 21 | 0.347567% |
Noise dominated data is calculated using 1-second bins in cleaned event files. If a bin has >2000 counts, and if more than 50% of those come from <1% of pixels, then it is considered to be noise-dominated and hence unusable.
| Quadrant | # 1 sec bins | Bins with >0 counts | Bins with >2000 counts | High rate bins dominated by noise | Noise dominated (total time) | Noise dominated (detector-on time) | Marked lightcurve |
|---|---|---|---|---|---|---|---|
| A | 6042 | 6042 | 310 | 310 | 5.13% | 5.13% | 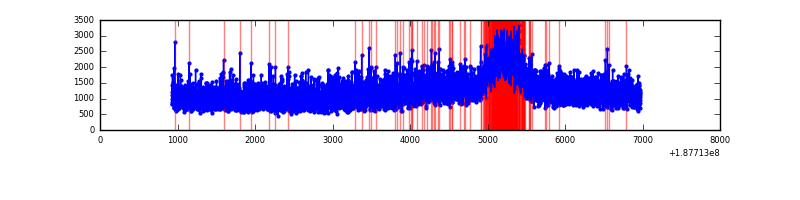 |
| B | 6042 | 6042 | 356 | 356 | 5.89% | 5.89% | 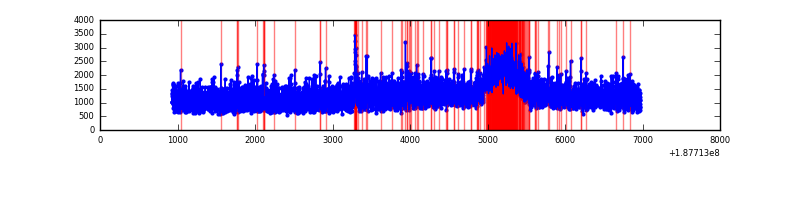 |
| C | 6042 | 6042 | 327 | 327 | 5.41% | 5.41% | 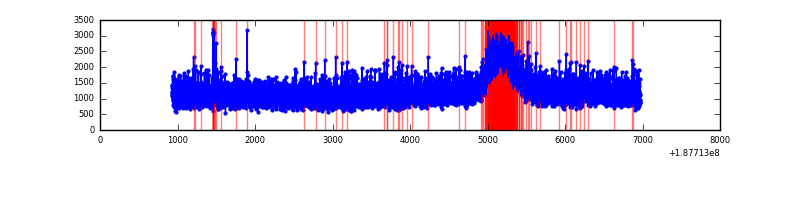 |
| D | 6042 | 6042 | 244 | 244 | 4.04% | 4.04% | 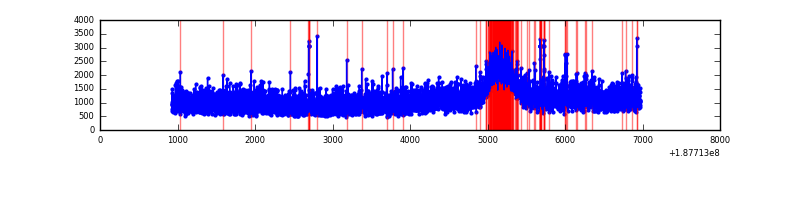 |
Top three noisy pixels from each quadrant. If the there are fewer than three noisy pixels in the level2.evt file, extra rows are filled as -1
| Pixel properties | Quadrant properties | ||||||
|---|---|---|---|---|---|---|---|
| Quadrant | DetID | PixID | Counts | Sigma | Mean | Median | Sigma |
| A | 0 | 175 | 42805 | 88.81 | 1901 | 1915 | 460.4 |
| A | 11 | 79 | 9166 | 15.75 | 1901 | 1915 | 460.4 |
| A | 3 | 111 | 5900 | 8.66 | 1901 | 1915 | 460.4 |
| B | 15 | 22 | 48518 | 100.05 | 1964 | 1975 | 465.2 |
| B | 5 | 249 | 44306 | 90.99 | 1964 | 1975 | 465.2 |
| B | 8 | 4 | 19689 | 38.08 | 1964 | 1975 | 465.2 |
| C | 15 | 241 | 275044 | 540.22 | 1809 | 1872 | 505.7 |
| C | 9 | 54 | 32870 | 61.3 | 1809 | 1872 | 505.7 |
| C | 3 | 111 | 25039 | 45.81 | 1809 | 1872 | 505.7 |
| D | 13 | 252 | 101935 | 182.45 | 1759 | 1822 | 548.7 |
| D | 12 | 22 | 20606 | 34.23 | 1759 | 1822 | 548.7 |
| D | 10 | 125 | 13765 | 21.77 | 1759 | 1822 | 548.7 |
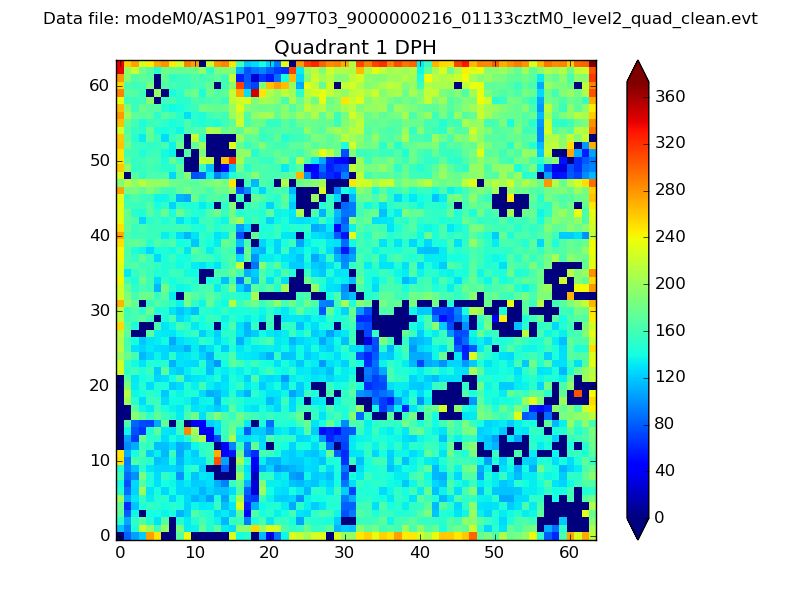
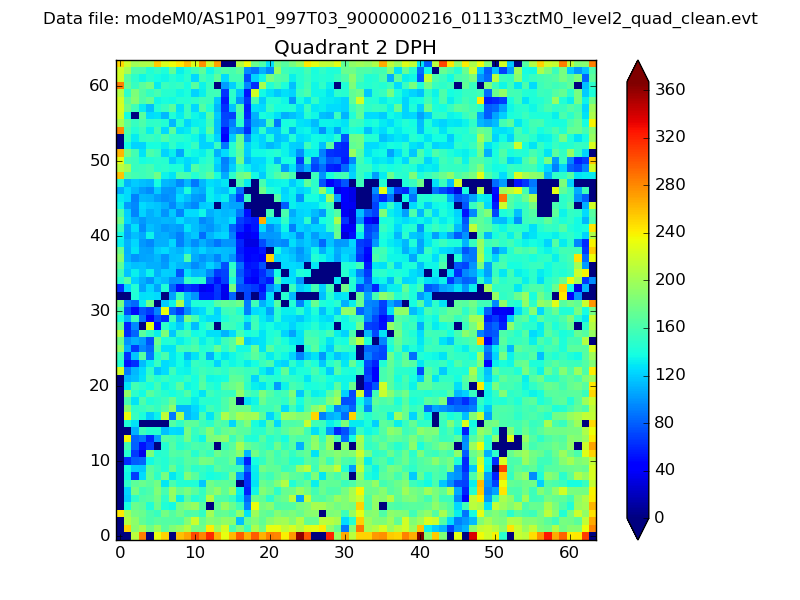
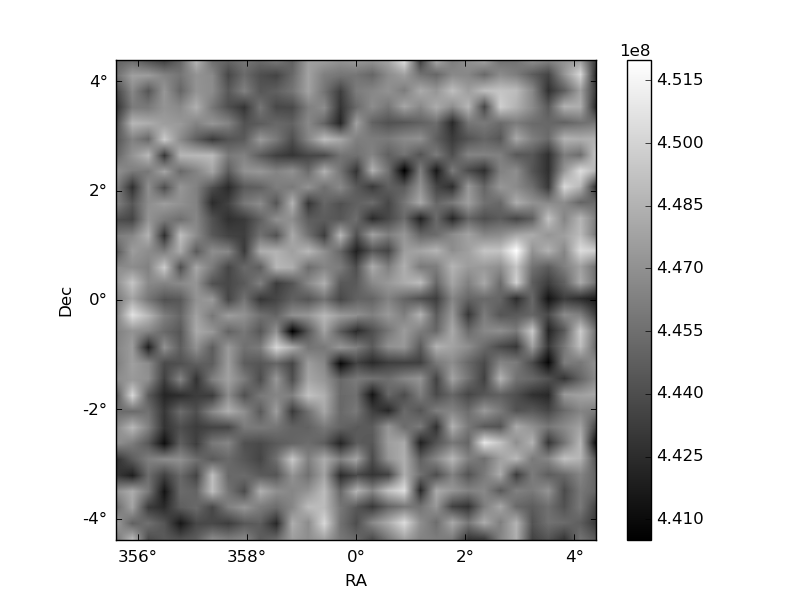
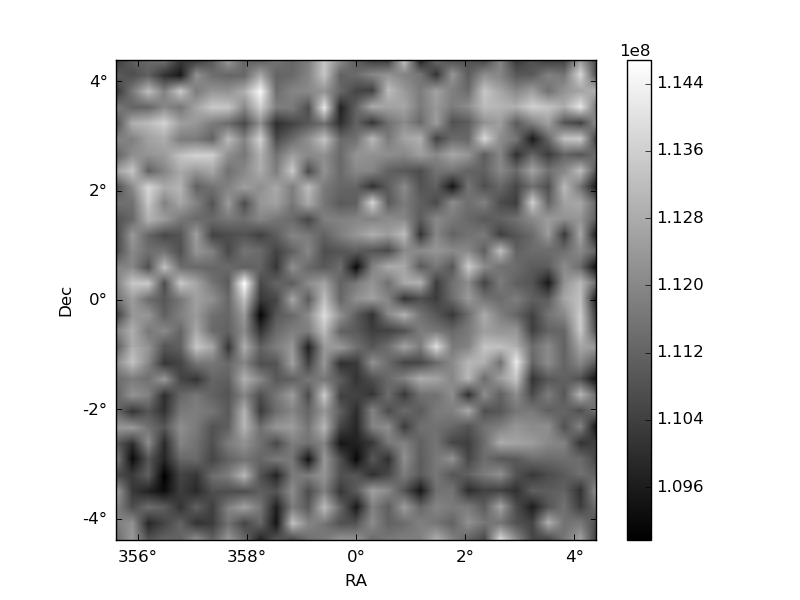
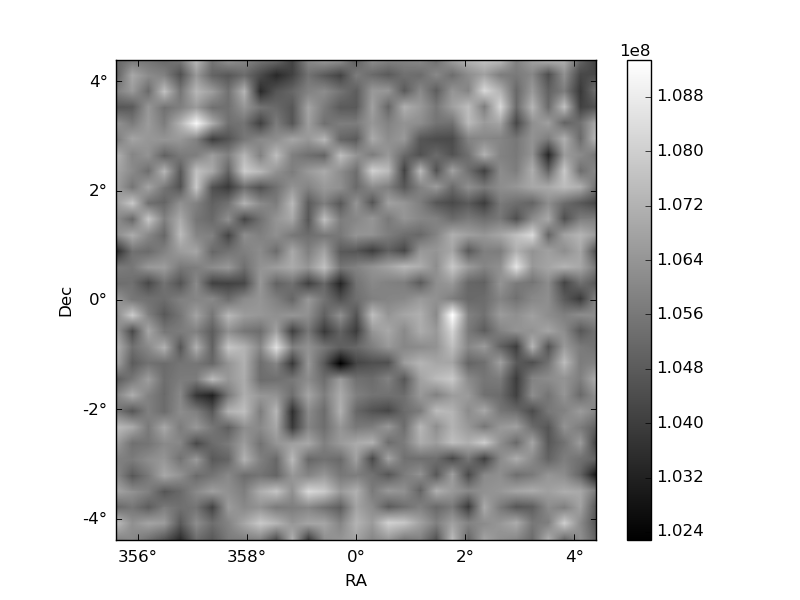
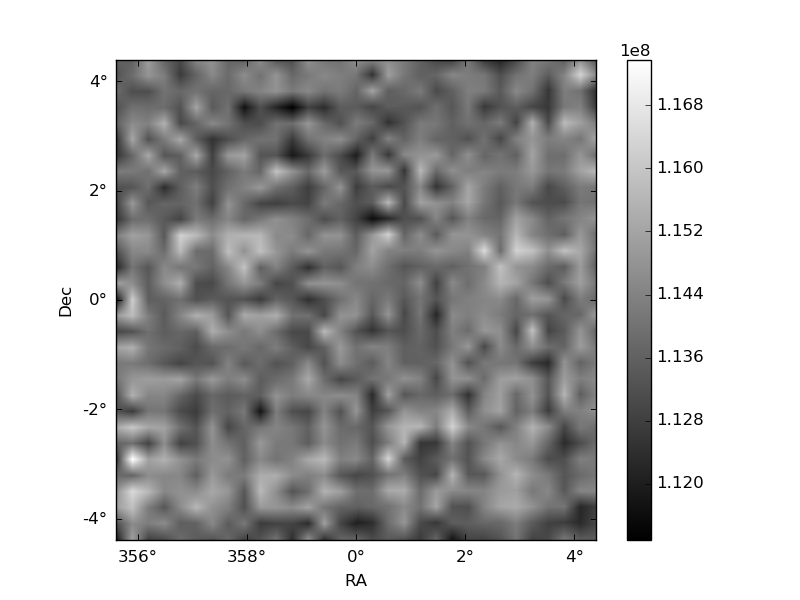
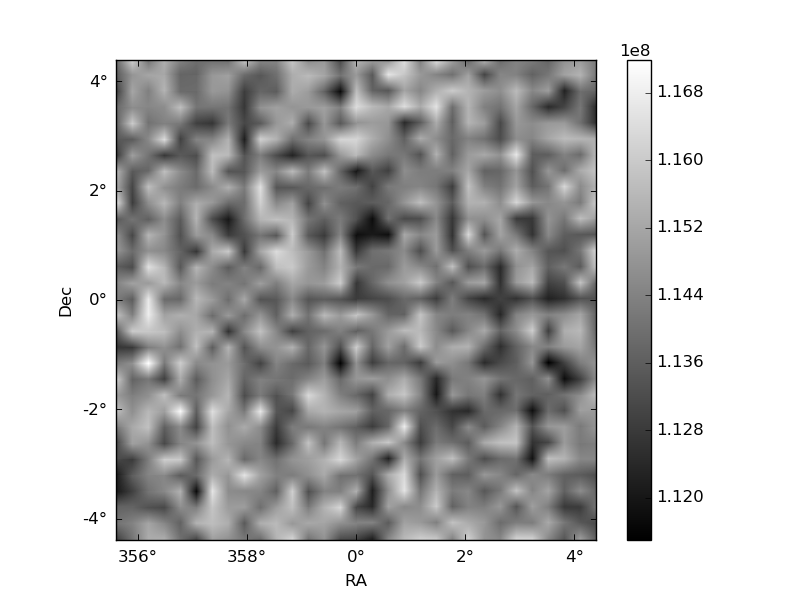
Histogram calculated using DETX and DETY for each event in the final _common_clean file
| Quadrant A |  |
 |
Quadrant B |
|---|---|---|---|
| Quadrant D | 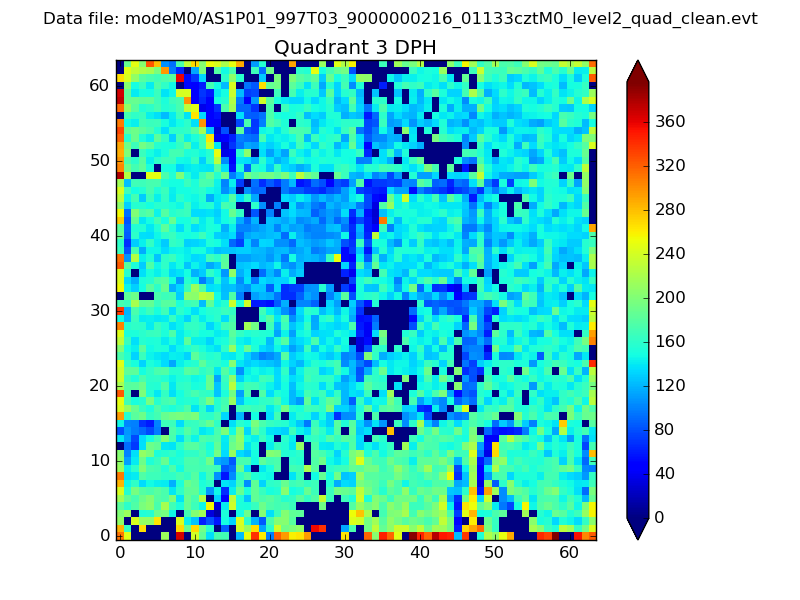 |
 |
Quadrant C |
| Plot type | Count rate plots | Images |
|---|---|---|
| Comparison with Poisson distribution Blue bars denote a histogram of data divided into 1 sec bins. Red curve is a Poisson curve with rate = median count rate of data. |
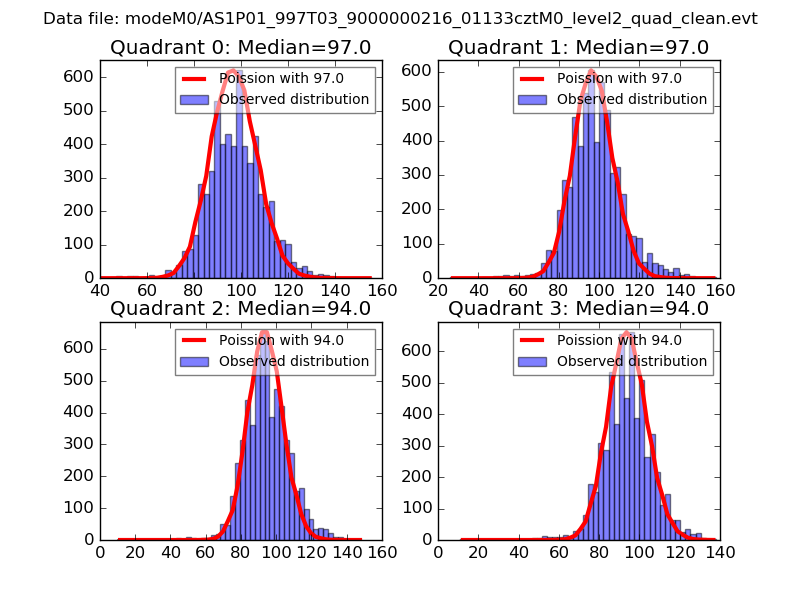 |
 |
| Quadrant-wise count rates Data is divided into 100 sec bins |
 |
|
| Module-wise count rates for Quadrant A Data is divided into 100 sec bins |
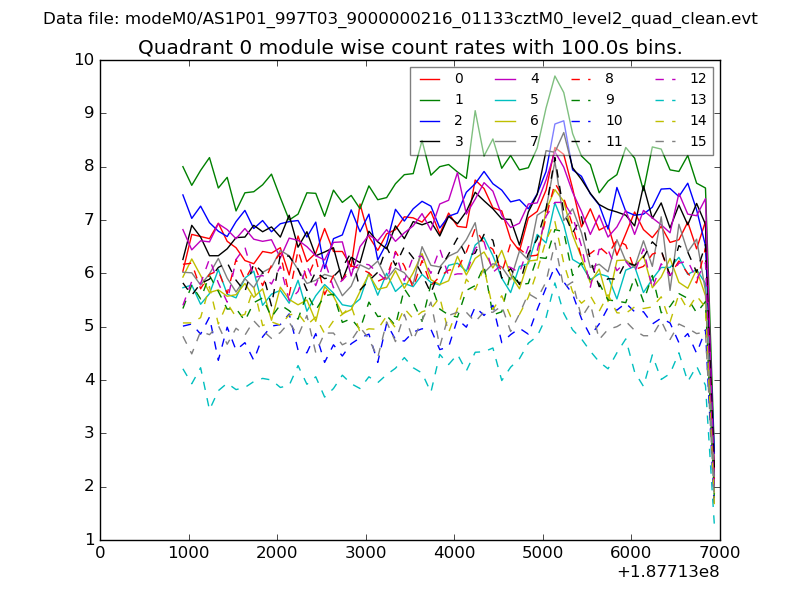 |
 |
| Module-wise count rates for Quadrant B Data is divided into 100 sec bins |
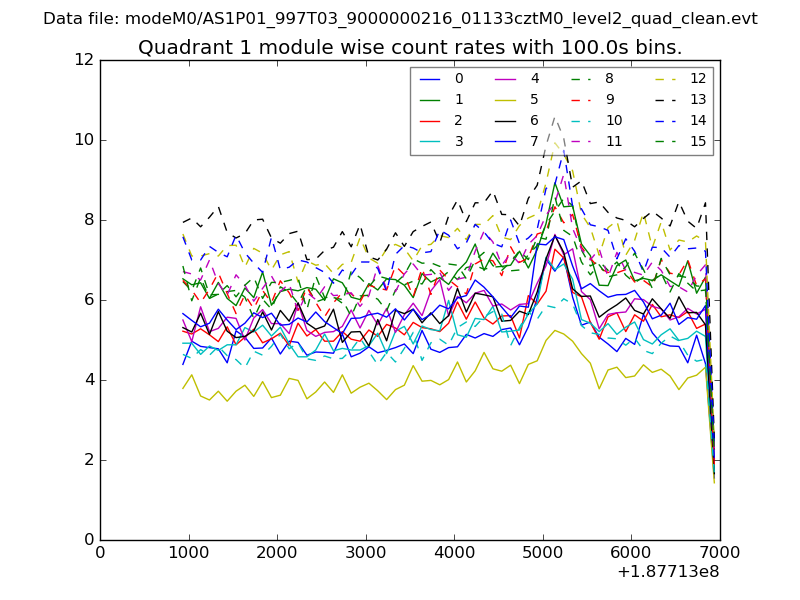 |
 |
| Module-wise count rates for Quadrant C Data is divided into 100 sec bins |
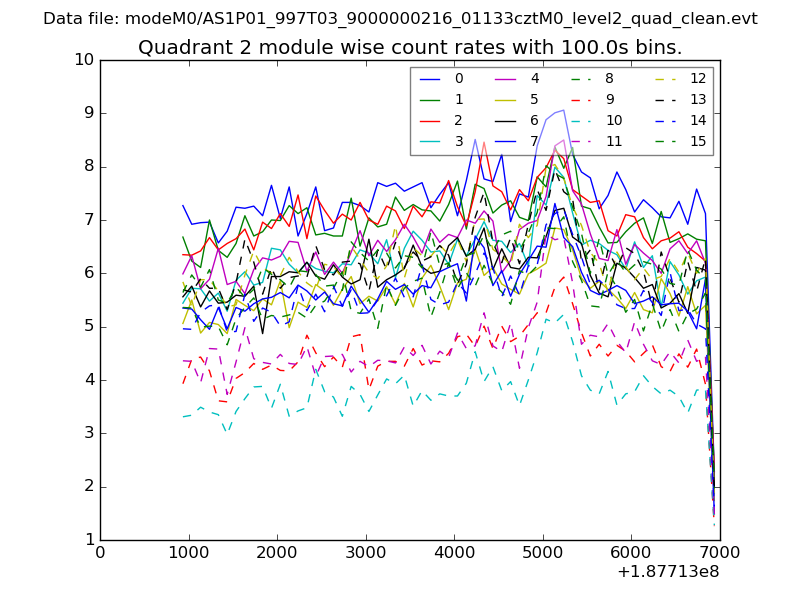 |
 |
| Module-wise count rates for Quadrant D Data is divided into 100 sec bins |
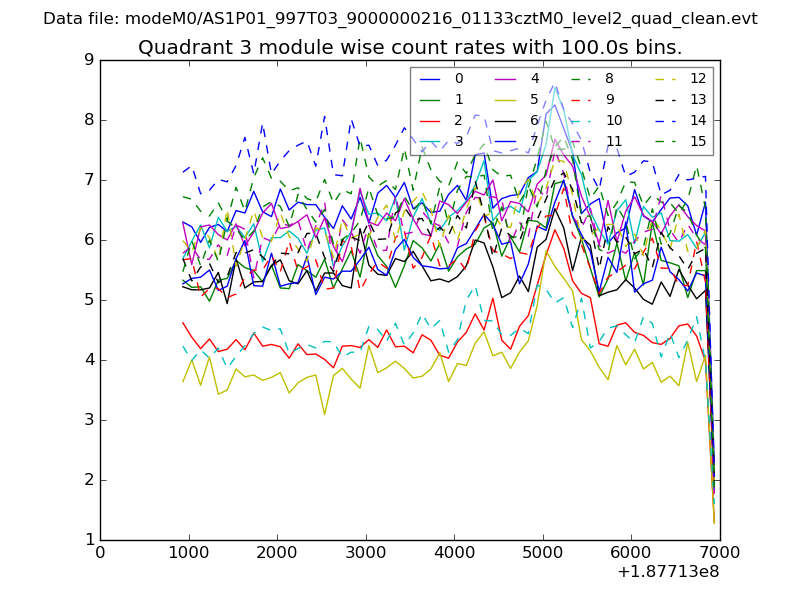 |
 |
| Parameter | Plot |
|---|---|
| CZT HV Monitor | 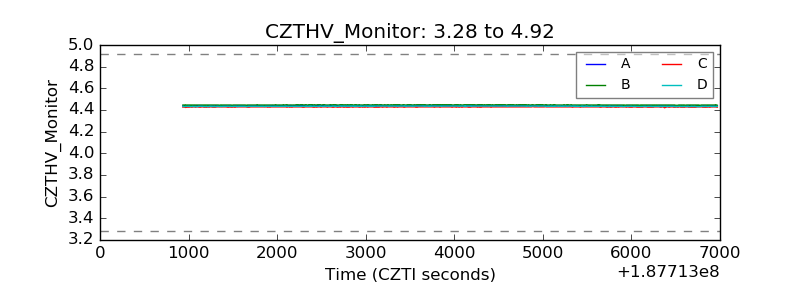 |
| D_VDD | 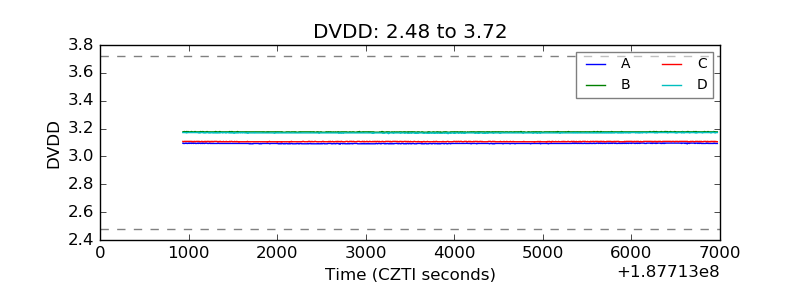 |
| Temperature 1 | 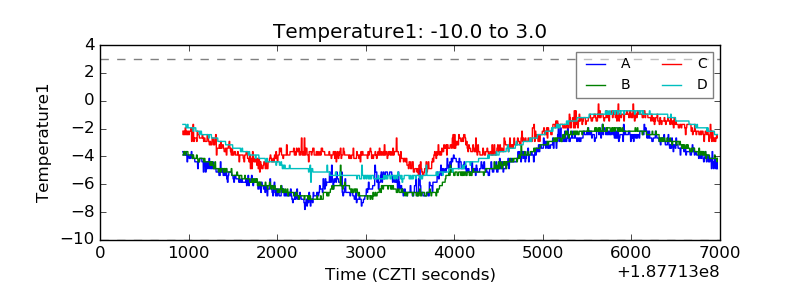 |
| Veto HV Monitor | 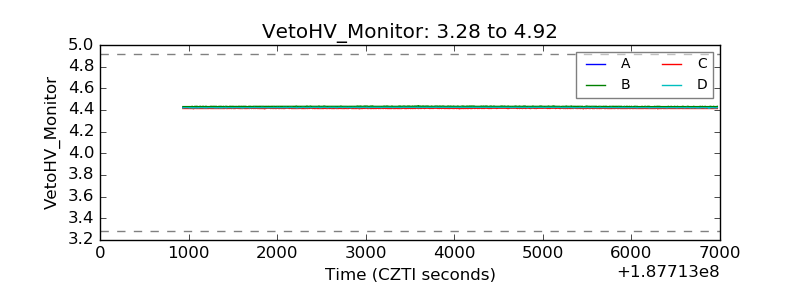 |
| Veto LLD | 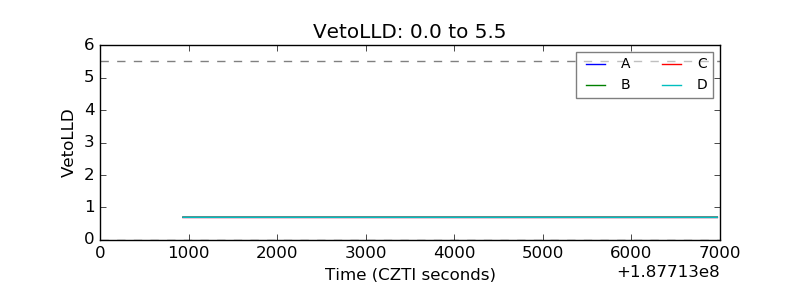 |
| Alpha Counter | 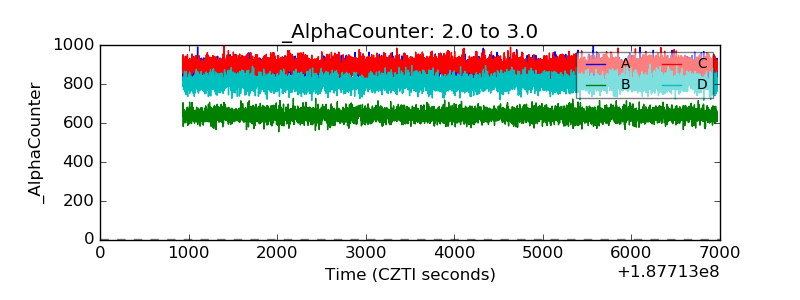 |
| _CPM_Rate | 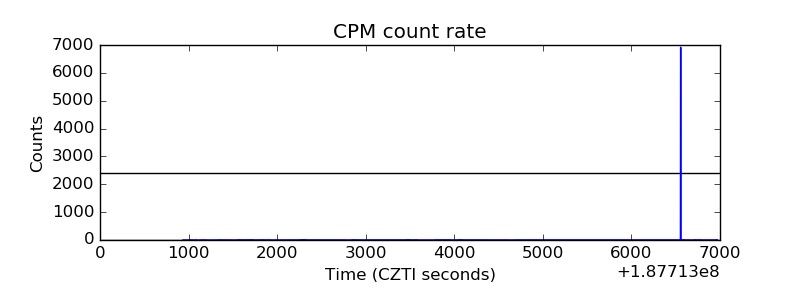 |
| CZT Counter | 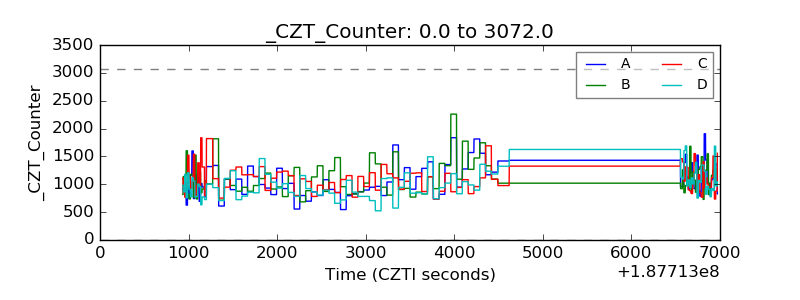 |
| +2.5 Volts monitor |  |
| +5 Volts monitor |  |
| _ROLL_ROT | 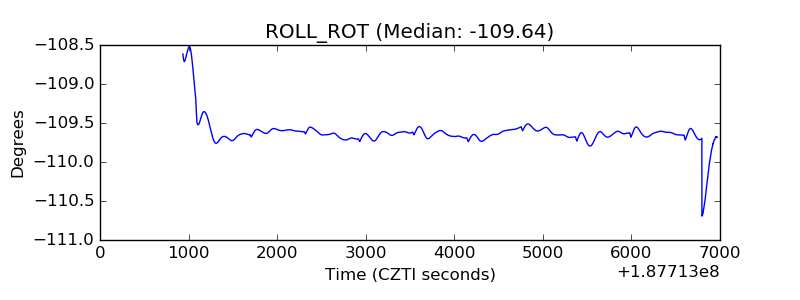 |
| _Roll_DEC | 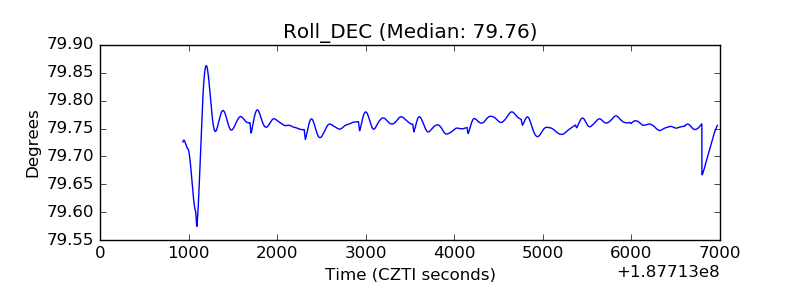 |
| _Roll_RA | 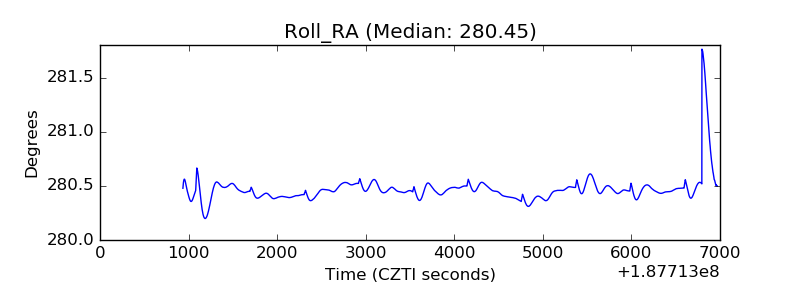 |
| Veto Counter | 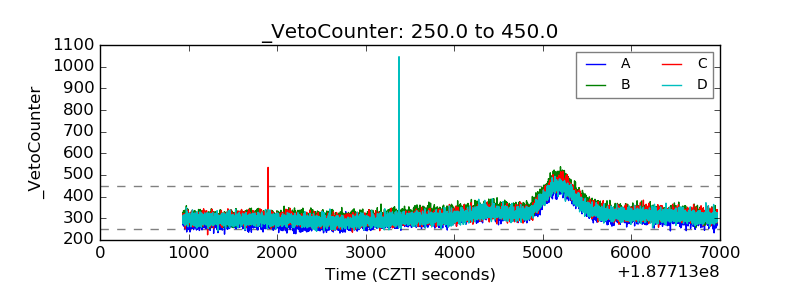 |