| Param | Original file | Final file |
|---|---|---|
| Filename | modeM0/AS1P01_997T03_9000000216_01134cztM0_level2.evt | modeM0/AS1P01_997T03_9000000216_01134cztM0_level2_quad_clean.evt |
| Size (bytes) | 1,131,825,600 | 105,747,840 |
| Size | 1.1 GB | 100.8 MB |
| Events in quadrant A | 8,425,399 | 692,287 |
| Events in quadrant B | 8,771,885 | 691,413 |
| Events in quadrant C | 8,618,487 | 665,311 |
| Events in quadrant D | 7,990,465 | 658,605 |
| Mode M0 | |||
|---|---|---|---|
| Quadrant | BADHDUFLAG | Total packets | Discarded packets |
| A | 0 | 30104 | 3 |
| B | 0 | 31063 | 2 |
| C | 0 | 30606 | 2 |
| D | 0 | 28847 | 2 |
| Mode SS | |||
|---|---|---|---|
| Quadrant | BADHDUFLAG | Total packets | Discarded packets |
| A | 0 | 144 | 0 |
| B | 0 | 144 | 0 |
| C | 0 | 144 | 0 |
| D | 0 | 144 | 0 |
| Mode M9 | |||
|---|---|---|---|
| Quadrant | BADHDUFLAG | Total packets | Discarded packets |
| A | 0 | 1 | 0 |
| B | 0 | 1 | 0 |
| C | 0 | 1 | 0 |
| D | 0 | 1 | 0 |
| Quadrant | Total seconds | Saturated seconds | Saturation percentage |
|---|---|---|---|
| A | 7109 | 15 | 0.211000% |
| B | 7109 | 14 | 0.196933% |
| C | 7109 | 13 | 0.182867% |
| D | 7109 | 67 | 0.942467% |
Noise dominated data is calculated using 1-second bins in cleaned event files. If a bin has >2000 counts, and if more than 50% of those come from <1% of pixels, then it is considered to be noise-dominated and hence unusable.
| Quadrant | # 1 sec bins | Bins with >0 counts | Bins with >2000 counts | High rate bins dominated by noise | Noise dominated (total time) | Noise dominated (detector-on time) | Marked lightcurve |
|---|---|---|---|---|---|---|---|
| A | 7264 | 7110 | 244 | 244 | 3.36% | 3.43% | 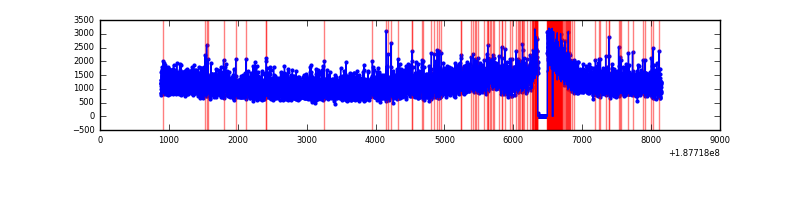 |
| B | 7264 | 7111 | 295 | 295 | 4.06% | 4.15% | 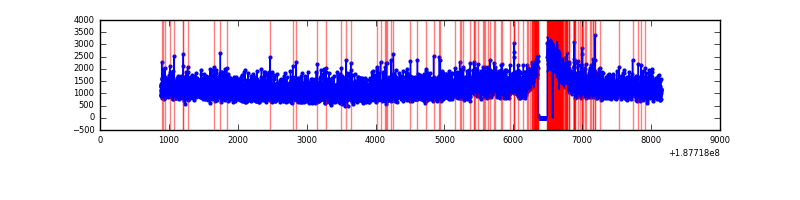 |
| C | 7264 | 7111 | 265 | 265 | 3.65% | 3.73% | 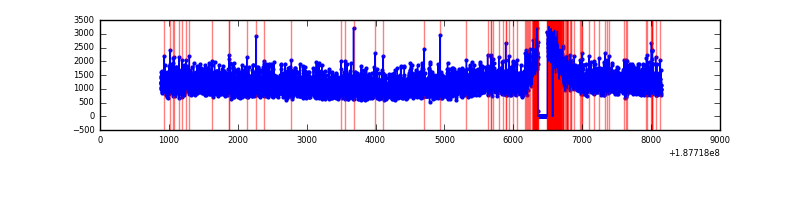 |
| D | 7264 | 7110 | 268 | 268 | 3.69% | 3.77% | 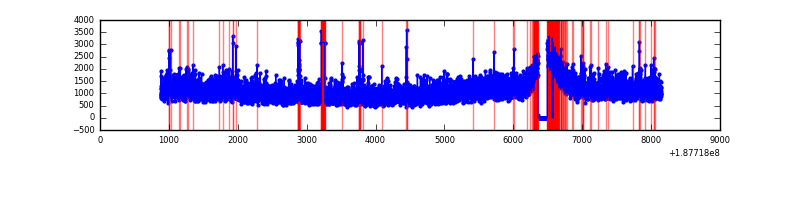 |
Top three noisy pixels from each quadrant. If the there are fewer than three noisy pixels in the level2.evt file, extra rows are filled as -1
| Pixel properties | Quadrant properties | ||||||
|---|---|---|---|---|---|---|---|
| Quadrant | DetID | PixID | Counts | Sigma | Mean | Median | Sigma |
| A | 0 | 175 | 12668 | 19.75 | 2191 | 2202 | 530.0 |
| A | 11 | 79 | 9082 | 12.98 | 2191 | 2202 | 530.0 |
| A | 13 | 9 | 7776 | 10.52 | 2191 | 2202 | 530.0 |
| B | 8 | 4 | 31390 | 54.21 | 2278 | 2286 | 536.9 |
| B | 15 | 22 | 27375 | 46.73 | 2278 | 2286 | 536.9 |
| B | 12 | 52 | 22890 | 38.38 | 2278 | 2286 | 536.9 |
| C | 15 | 241 | 330314 | 562.21 | 2101 | 2181 | 583.6 |
| C | 3 | 111 | 28869 | 45.73 | 2101 | 2181 | 583.6 |
| C | 3 | 79 | 27350 | 43.12 | 2101 | 2181 | 583.6 |
| D | 10 | 85 | 158447 | 246.8 | 2039 | 2111 | 633.5 |
| D | 13 | 252 | 139484 | 216.86 | 2039 | 2111 | 633.5 |
| D | 12 | 22 | 43975 | 66.09 | 2039 | 2111 | 633.5 |
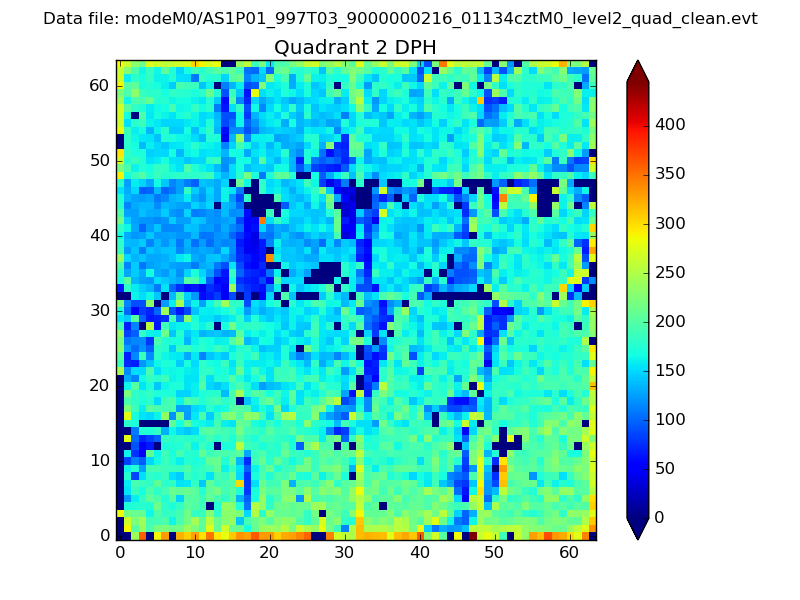
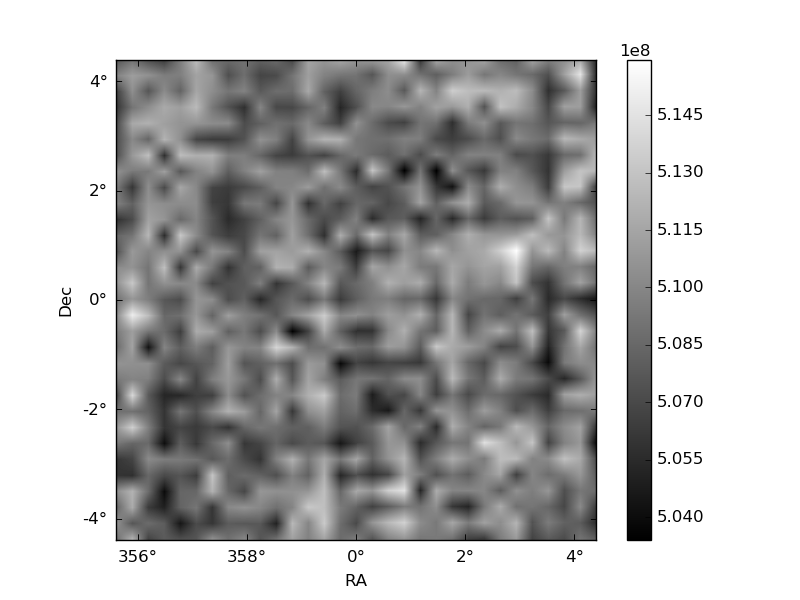
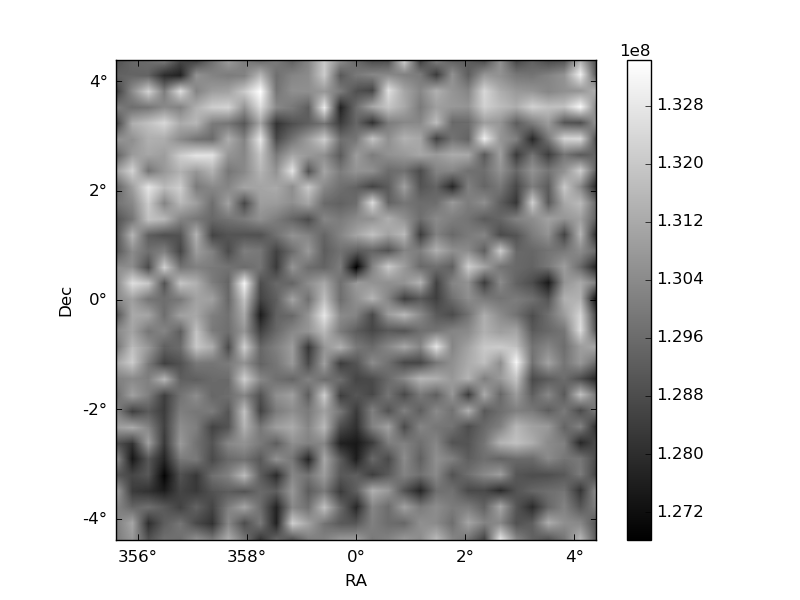
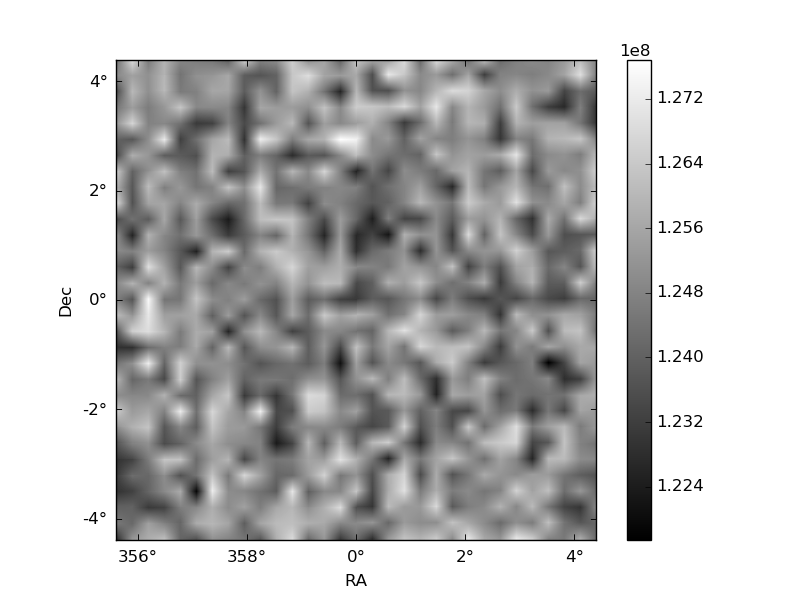
Histogram calculated using DETX and DETY for each event in the final _common_clean file
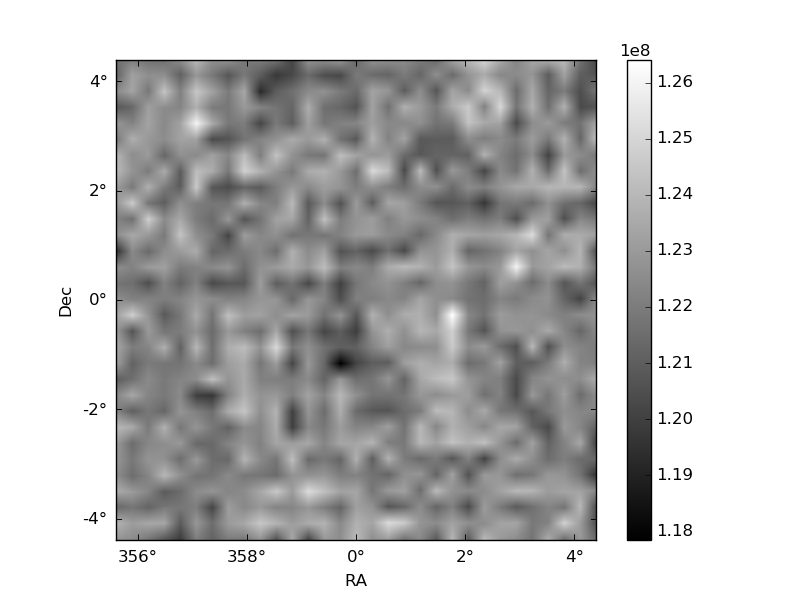
| Quadrant A | 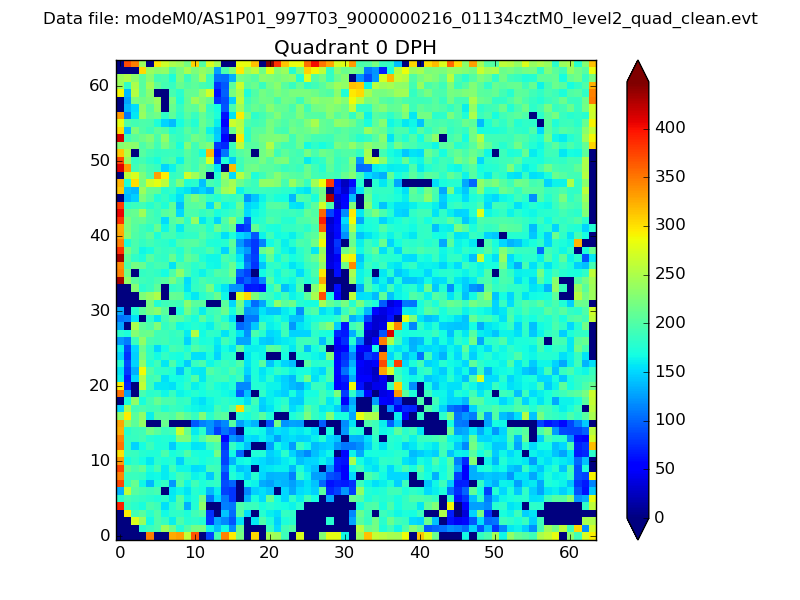 |
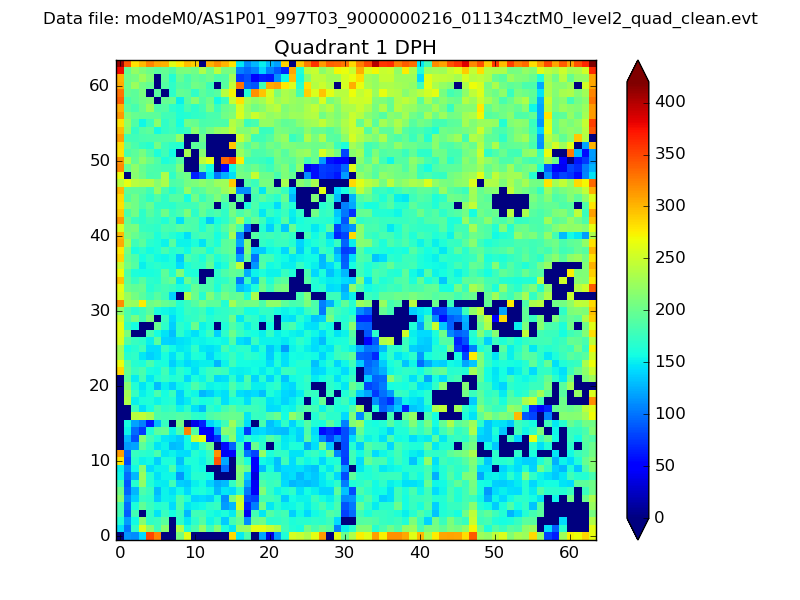 |
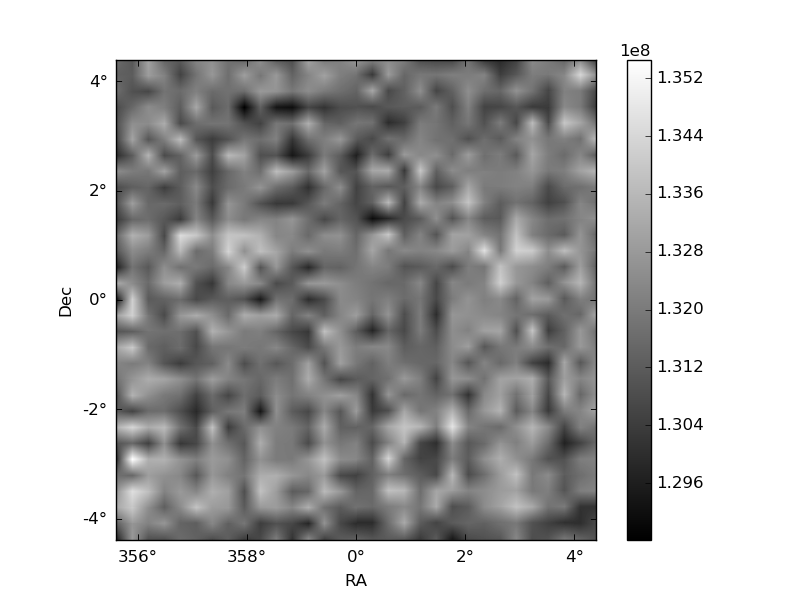
Quadrant B |
|---|---|---|---|
| Quadrant D | 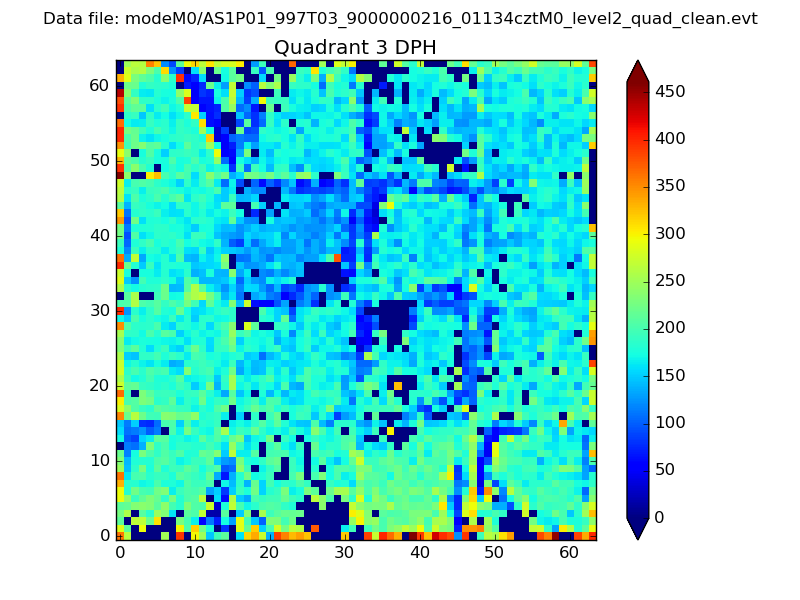 |
 |
Quadrant C |
| Plot type | Count rate plots | Images |
|---|---|---|
| Comparison with Poisson distribution Blue bars denote a histogram of data divided into 1 sec bins. Red curve is a Poisson curve with rate = median count rate of data. |
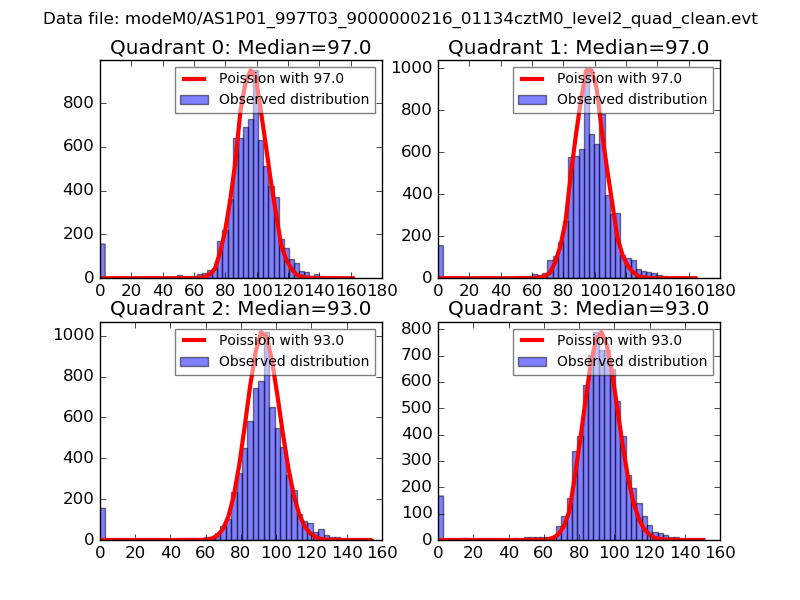 |
 |
| Quadrant-wise count rates Data is divided into 100 sec bins |
 |
|
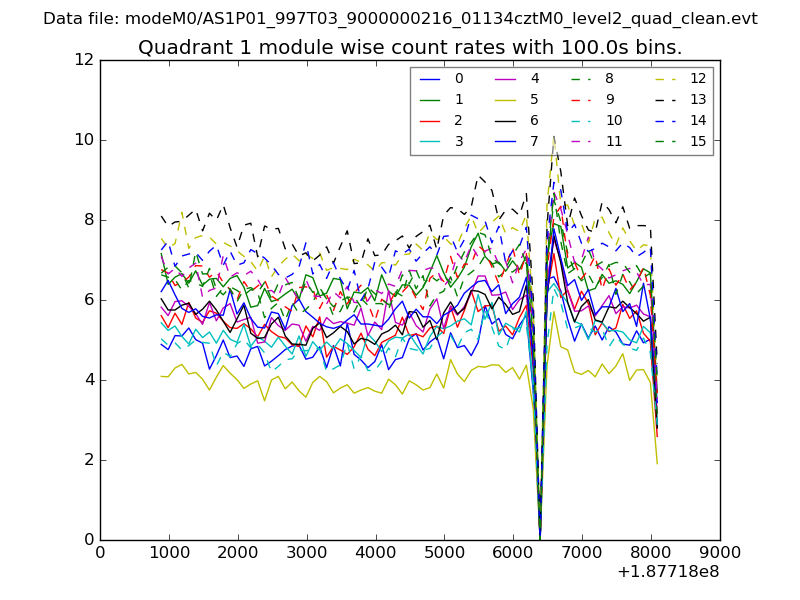
| Module-wise count rates for Quadrant A Data is divided into 100 sec bins |
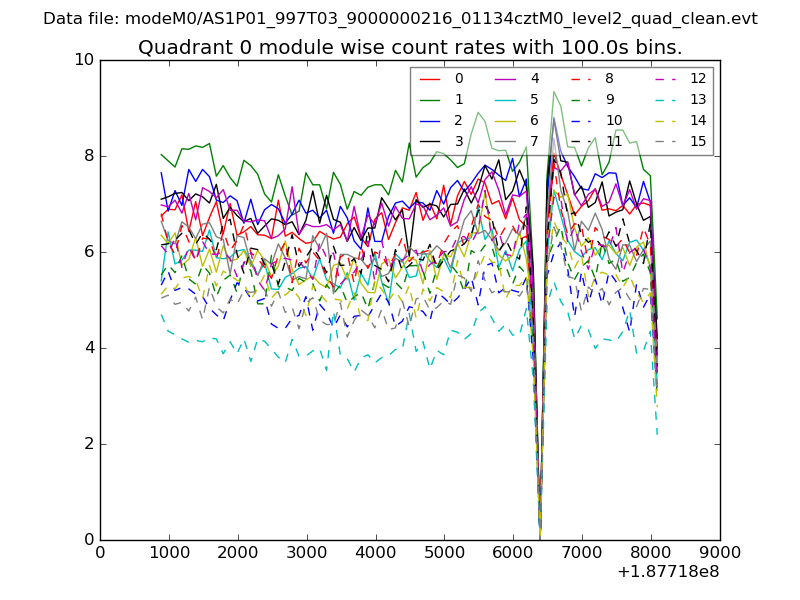 |
 |
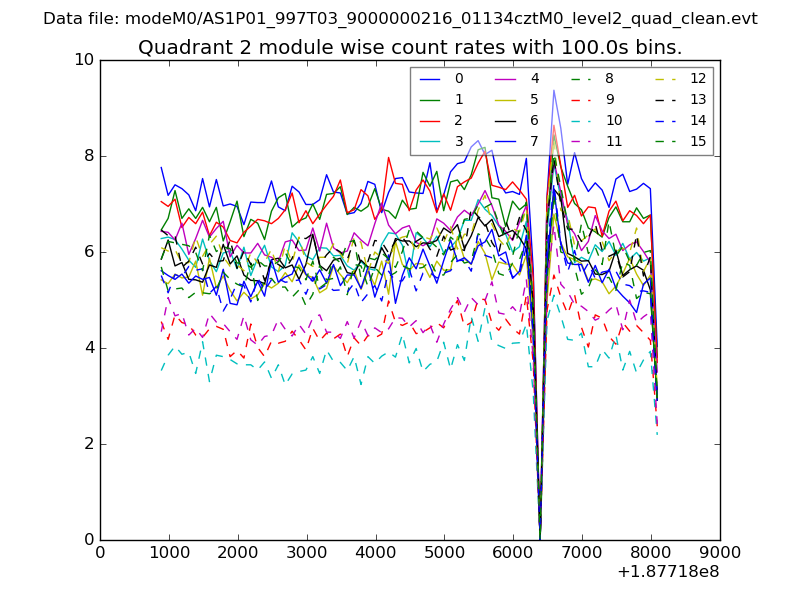
| Module-wise count rates for Quadrant B Data is divided into 100 sec bins |
 |
 |
| Module-wise count rates for Quadrant C Data is divided into 100 sec bins |
 |
 |
| Module-wise count rates for Quadrant D Data is divided into 100 sec bins |
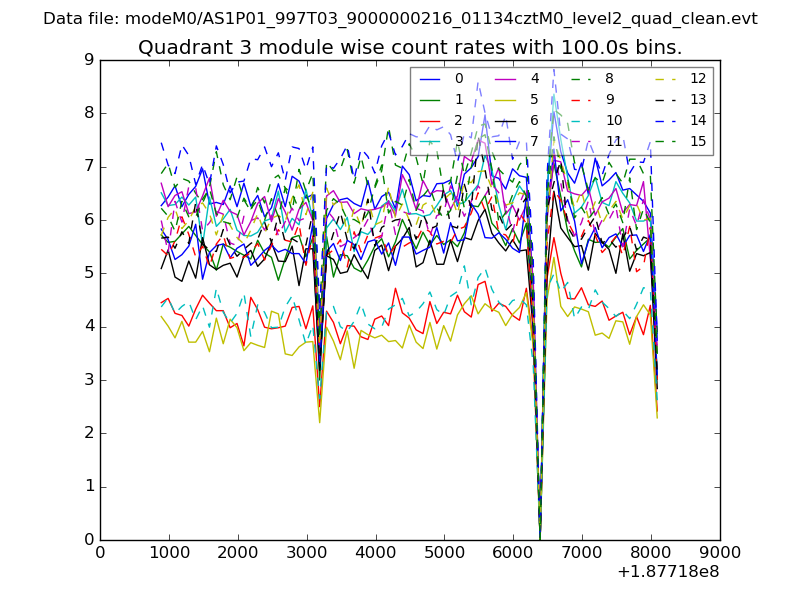 |
 |
| Parameter | Plot |
|---|---|
| CZT HV Monitor | 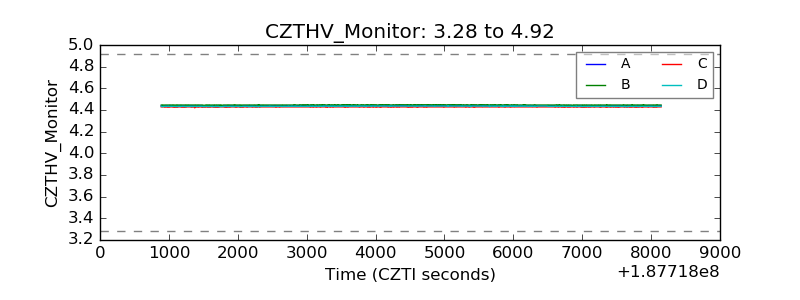 |
| D_VDD | 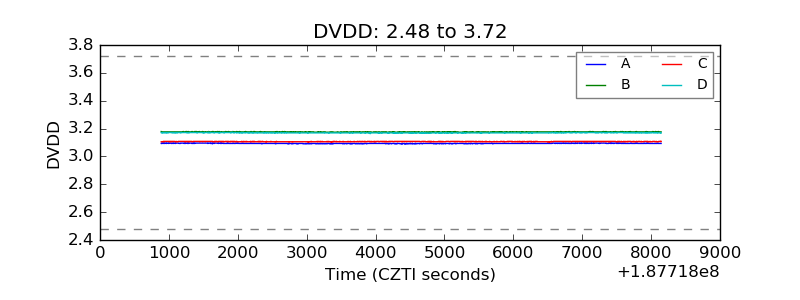 |
| Temperature 1 | 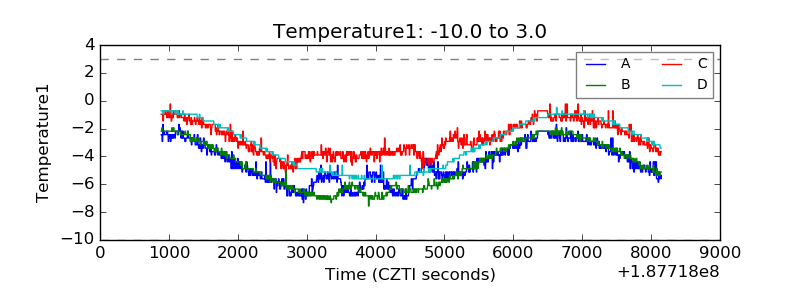 |
| Veto HV Monitor | 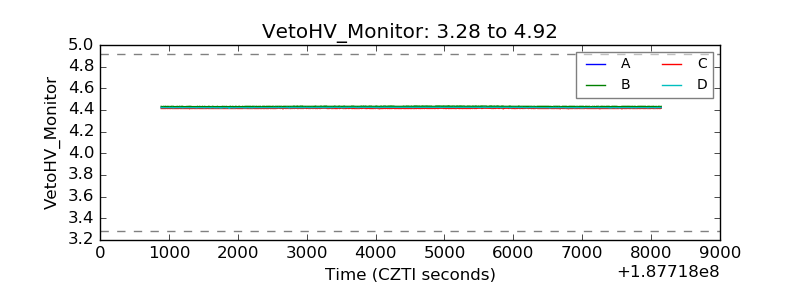 |
| Veto LLD | 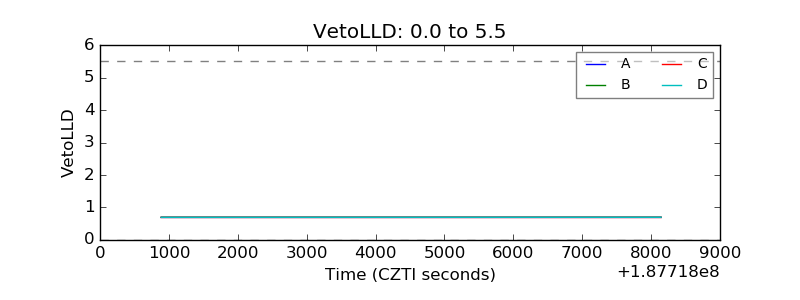 |
| Alpha Counter | 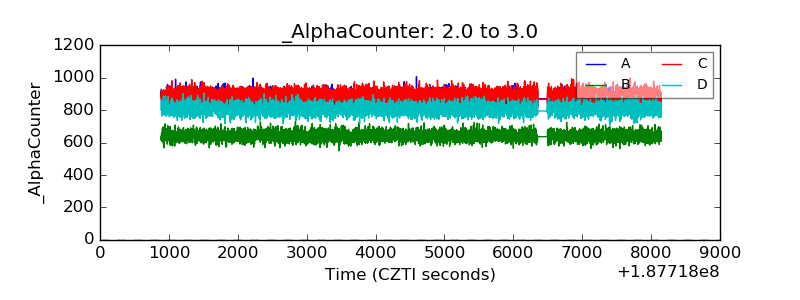 |
| _CPM_Rate | 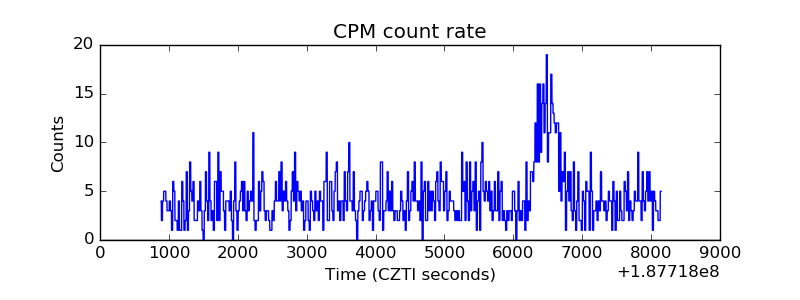 |
| CZT Counter | 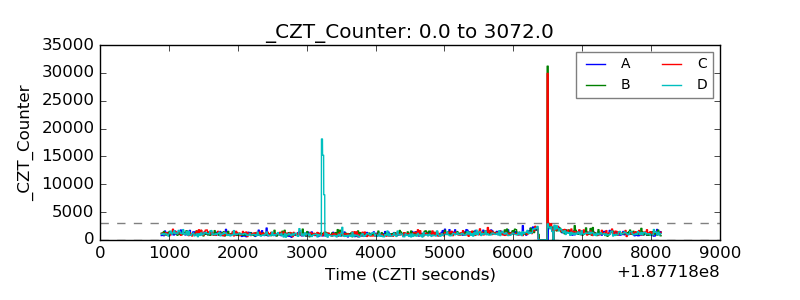 |
| +2.5 Volts monitor |  |
| +5 Volts monitor |  |
| _ROLL_ROT | 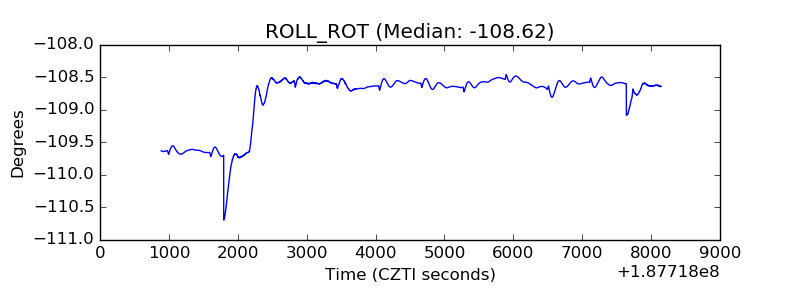 |
| _Roll_DEC | 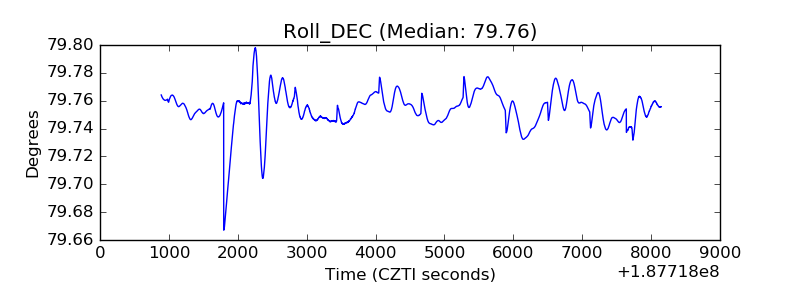 |
| _Roll_RA | 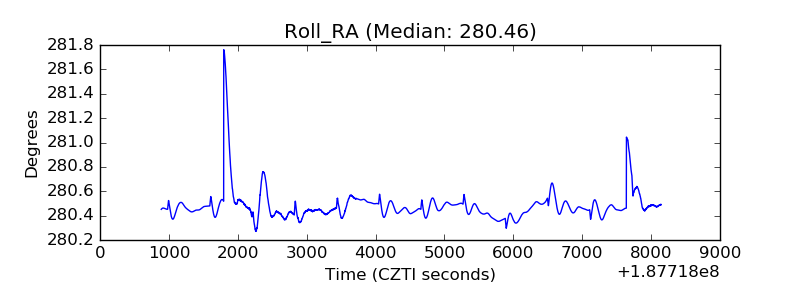 |
| Veto Counter | 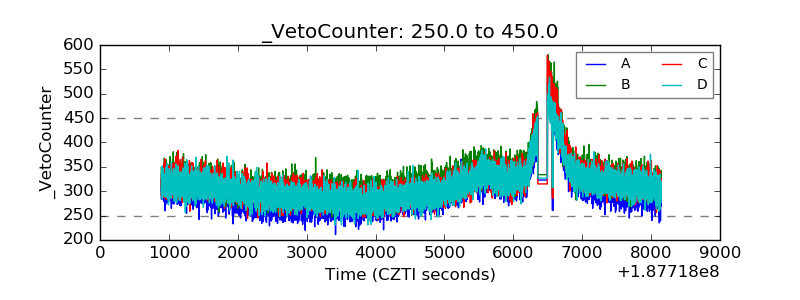 |