| Param | Original file | Final file |
|---|---|---|
| Filename | modeM0/AS1P01_997T03_9000000216_01135cztM0_level2.evt | modeM0/AS1P01_997T03_9000000216_01135cztM0_level2_quad_clean.evt |
| Size (bytes) | 1,184,492,160 | 110,666,880 |
| Size | 1.1 GB | 105.5 MB |
| Events in quadrant A | 8,816,741 | 723,205 |
| Events in quadrant B | 9,187,471 | 719,737 |
| Events in quadrant C | 9,092,315 | 696,827 |
| Events in quadrant D | 8,282,658 | 693,985 |
| Mode M0 | |||
|---|---|---|---|
| Quadrant | BADHDUFLAG | Total packets | Discarded packets |
| A | 0 | 31481 | 2 |
| B | 0 | 32555 | 1 |
| C | 0 | 32297 | 1 |
| D | 0 | 29966 | 1 |
| Mode SS | |||
|---|---|---|---|
| Quadrant | BADHDUFLAG | Total packets | Discarded packets |
| A | 0 | 150 | 0 |
| B | 0 | 150 | 0 |
| C | 0 | 150 | 0 |
| D | 0 | 150 | 0 |
| Mode M9 | |||
|---|---|---|---|
| Quadrant | BADHDUFLAG | Total packets | Discarded packets |
| A | 0 | 4 | 0 |
| B | 0 | 4 | 0 |
| C | 0 | 4 | 0 |
| D | 0 | 4 | 0 |
| Quadrant | Total seconds | Saturated seconds | Saturation percentage |
|---|---|---|---|
| A | 7447 | 4 | 0.053713% |
| B | 7447 | 7 | 0.093998% |
| C | 7447 | 9 | 0.120854% |
| D | 7447 | 27 | 0.362562% |
Noise dominated data is calculated using 1-second bins in cleaned event files. If a bin has >2000 counts, and if more than 50% of those come from <1% of pixels, then it is considered to be noise-dominated and hence unusable.
| Quadrant | # 1 sec bins | Bins with >0 counts | Bins with >2000 counts | High rate bins dominated by noise | Noise dominated (total time) | Noise dominated (detector-on time) | Marked lightcurve |
|---|---|---|---|---|---|---|---|
| A | 7842 | 7448 | 218 | 218 | 2.78% | 2.93% | 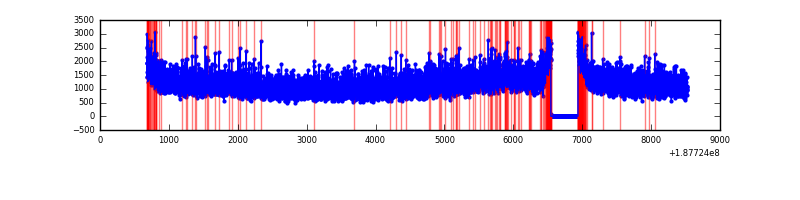 |
| B | 7842 | 7448 | 254 | 254 | 3.24% | 3.41% | 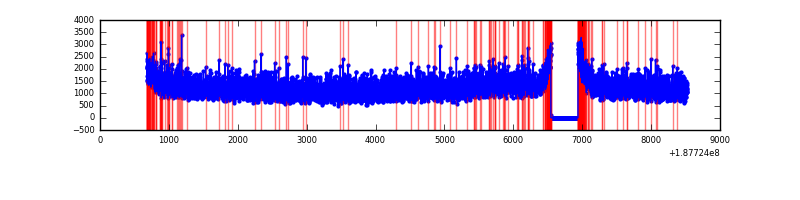 |
| C | 7842 | 7448 | 234 | 234 | 2.98% | 3.14% | 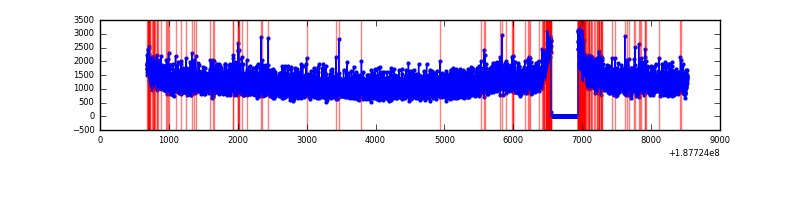 |
| D | 7842 | 7448 | 250 | 250 | 3.19% | 3.36% | 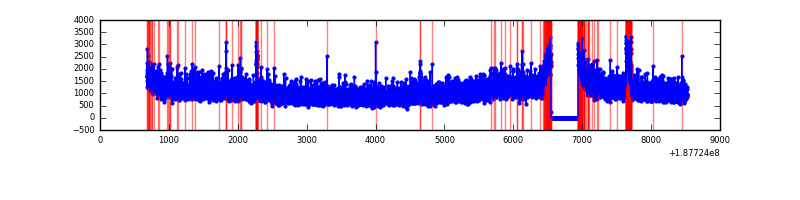 |
Top three noisy pixels from each quadrant. If the there are fewer than three noisy pixels in the level2.evt file, extra rows are filled as -1
| Pixel properties | Quadrant properties | ||||||
|---|---|---|---|---|---|---|---|
| Quadrant | DetID | PixID | Counts | Sigma | Mean | Median | Sigma |
| A | 14 | 238 | 11215 | 16.14 | 2292 | 2307 | 551.8 |
| A | 0 | 175 | 10421 | 14.7 | 2292 | 2307 | 551.8 |
| A | 11 | 79 | 9383 | 12.82 | 2292 | 2307 | 551.8 |
| B | 15 | 22 | 22225 | 35.28 | 2391 | 2395 | 562.1 |
| B | 0 | 187 | 17487 | 26.85 | 2391 | 2395 | 562.1 |
| B | 8 | 4 | 16993 | 25.97 | 2391 | 2395 | 562.1 |
| C | 15 | 241 | 344729 | 554.19 | 2208 | 2287 | 617.9 |
| C | 0 | 236 | 60695 | 94.52 | 2208 | 2287 | 617.9 |
| C | 3 | 111 | 27437 | 40.7 | 2208 | 2287 | 617.9 |
| D | 2 | 16 | 140825 | 207.82 | 2138 | 2213 | 667.0 |
| D | 12 | 22 | 69904 | 101.49 | 2138 | 2213 | 667.0 |
| D | 13 | 252 | 38959 | 55.09 | 2138 | 2213 | 667.0 |
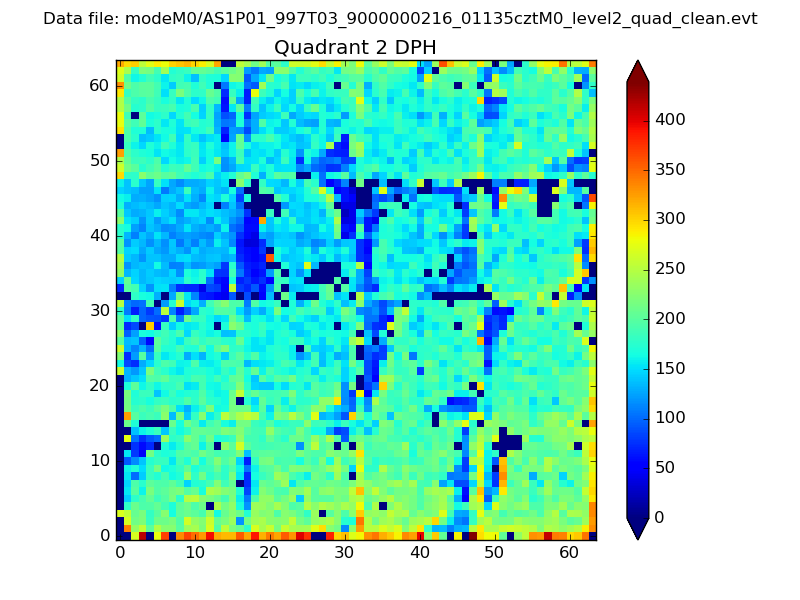
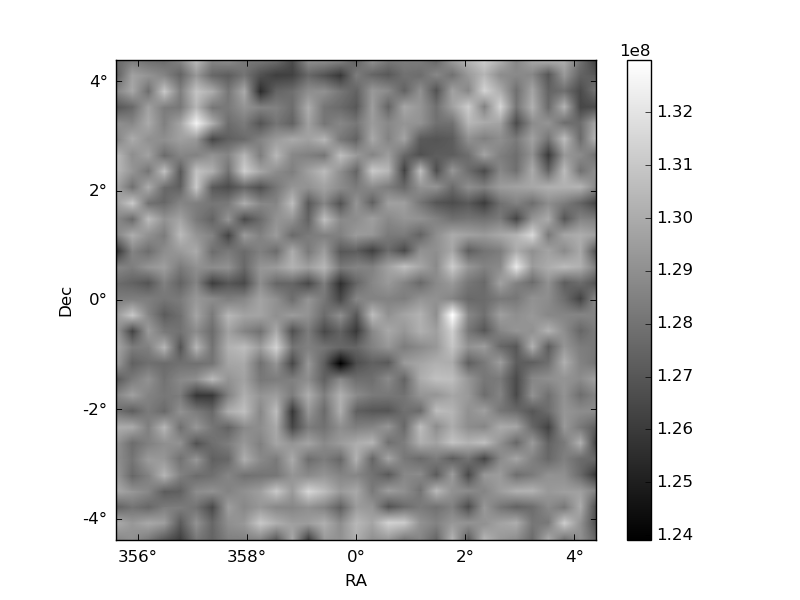
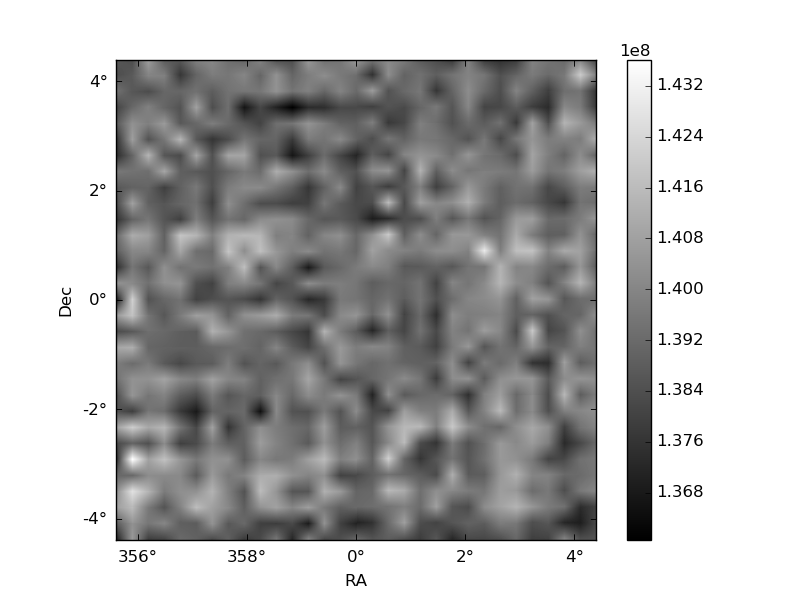
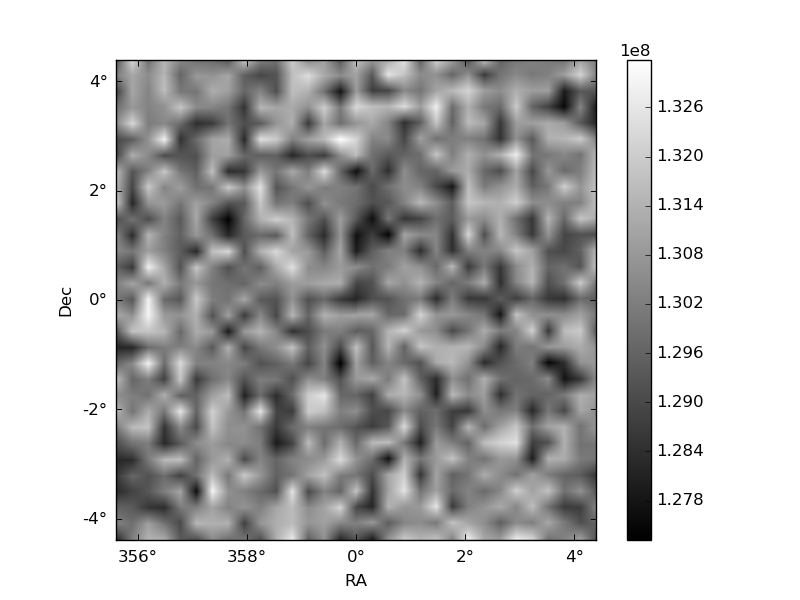
Histogram calculated using DETX and DETY for each event in the final _common_clean file
| Quadrant A | 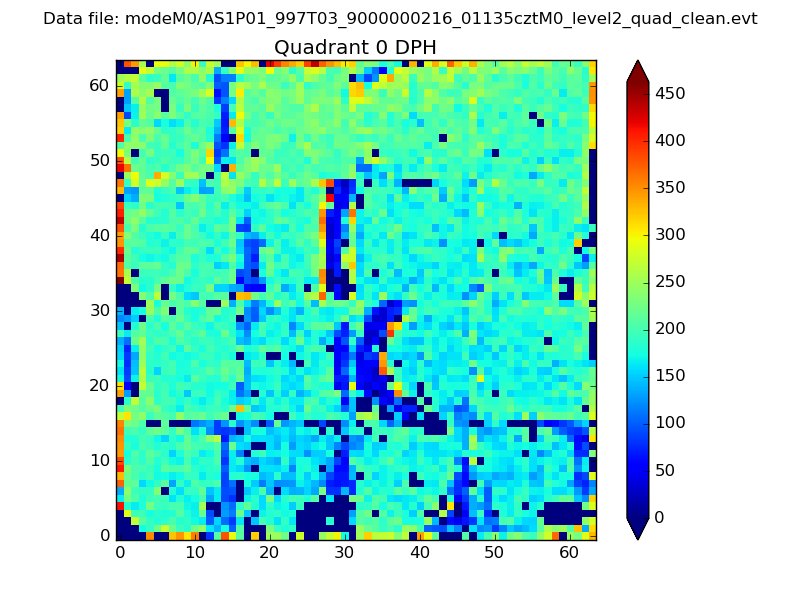 |
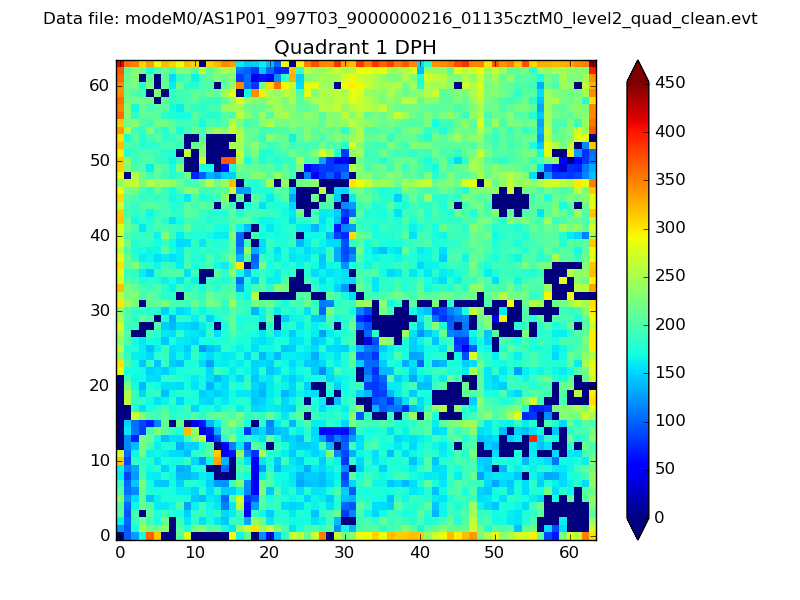 |
Quadrant B |
|---|---|---|---|
| Quadrant D | 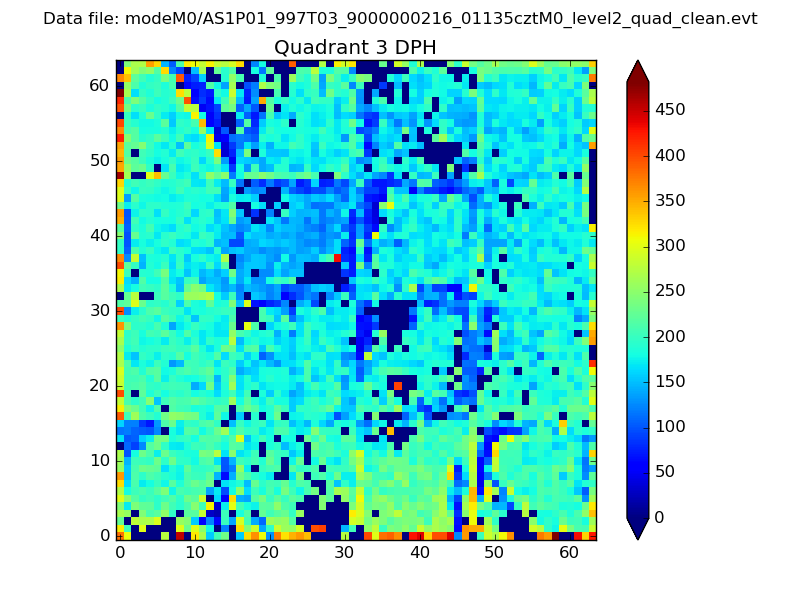 |
 |
Quadrant C |
| Plot type | Count rate plots | Images |
|---|---|---|
| Comparison with Poisson distribution Blue bars denote a histogram of data divided into 1 sec bins. Red curve is a Poisson curve with rate = median count rate of data. |
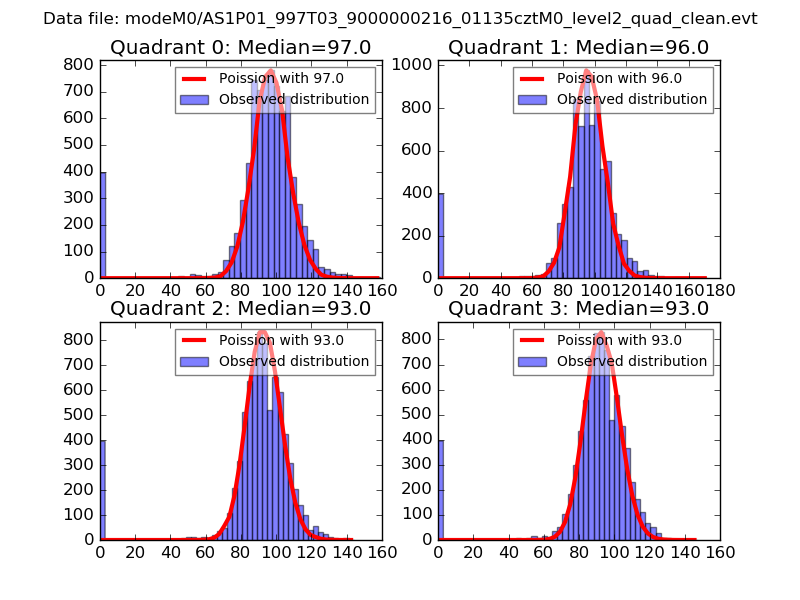 |
 |
| Quadrant-wise count rates Data is divided into 100 sec bins |
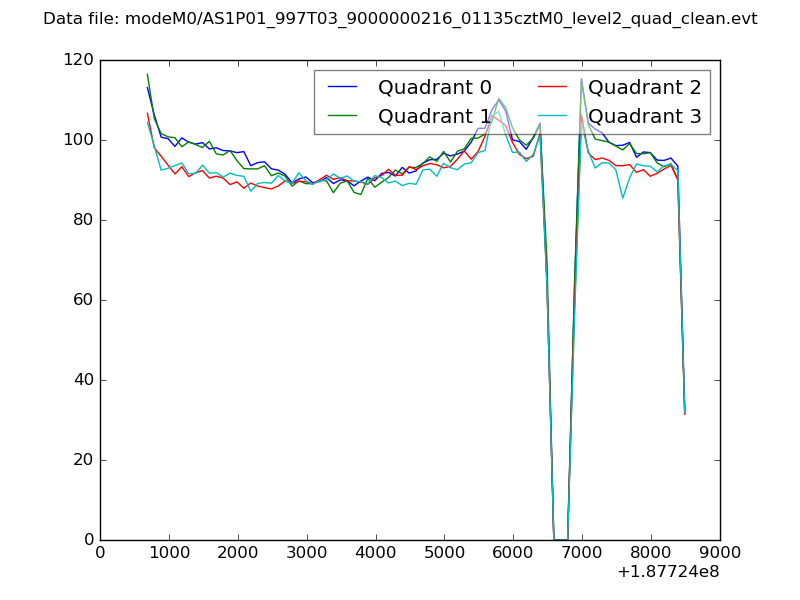 |
|
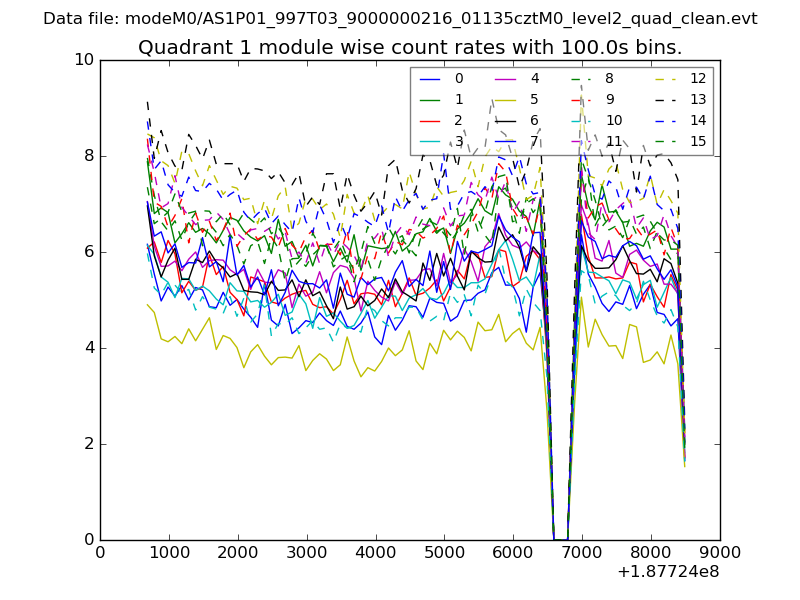
| Module-wise count rates for Quadrant A Data is divided into 100 sec bins |
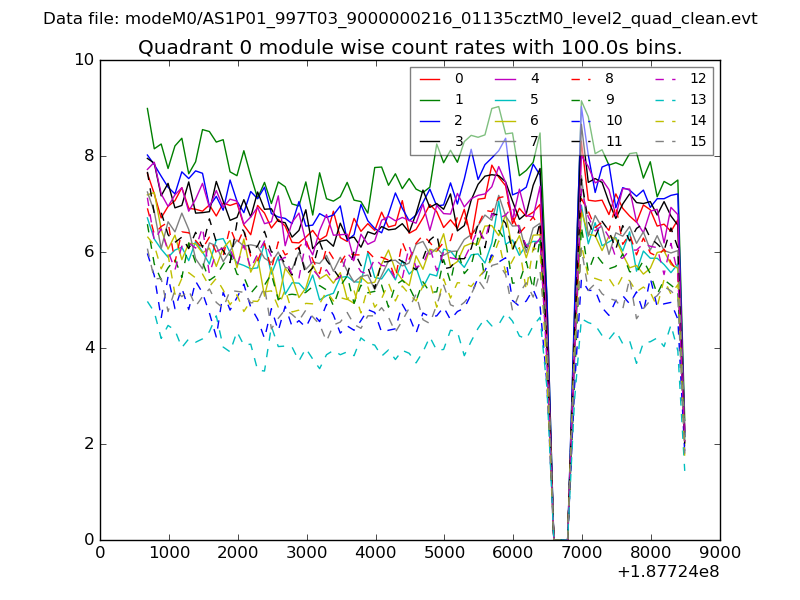 |
 |
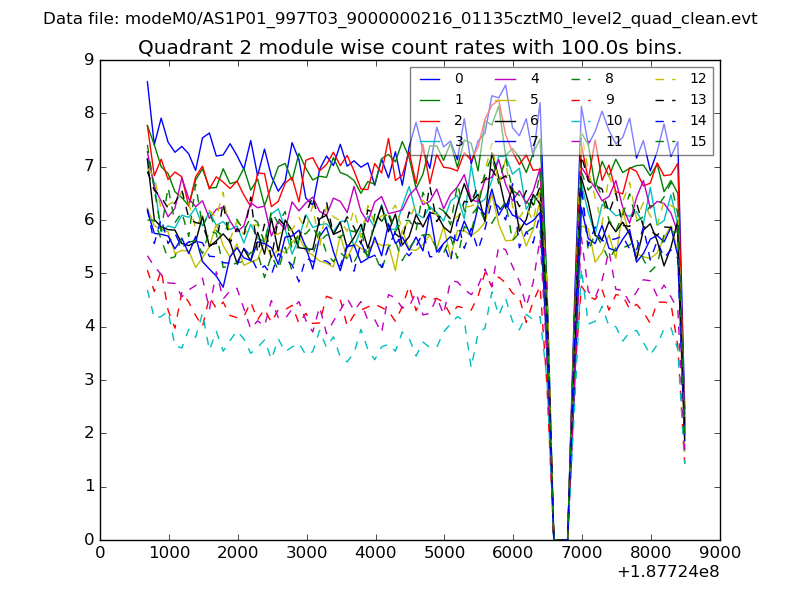
| Module-wise count rates for Quadrant B Data is divided into 100 sec bins |
 |
 |
| Module-wise count rates for Quadrant C Data is divided into 100 sec bins |
 |
 |
| Module-wise count rates for Quadrant D Data is divided into 100 sec bins |
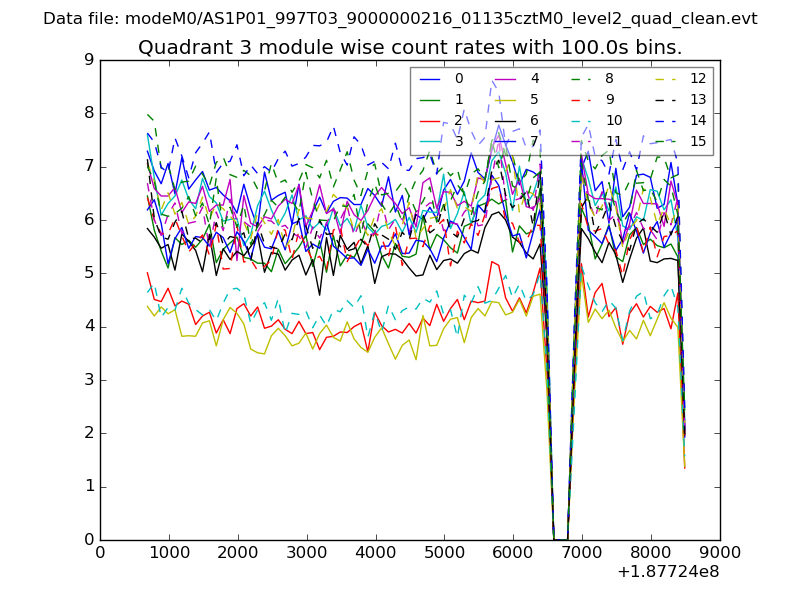 |
 |
| Parameter | Plot |
|---|---|
| CZT HV Monitor | 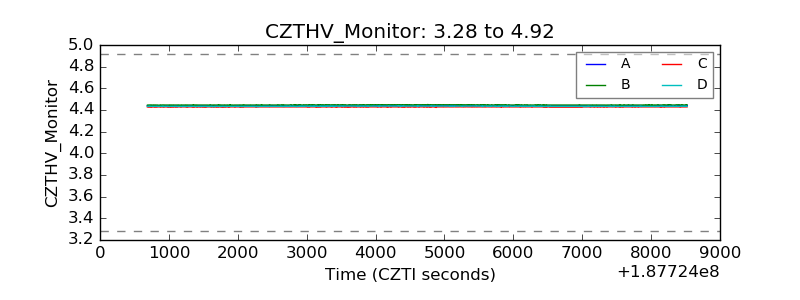 |
| D_VDD | 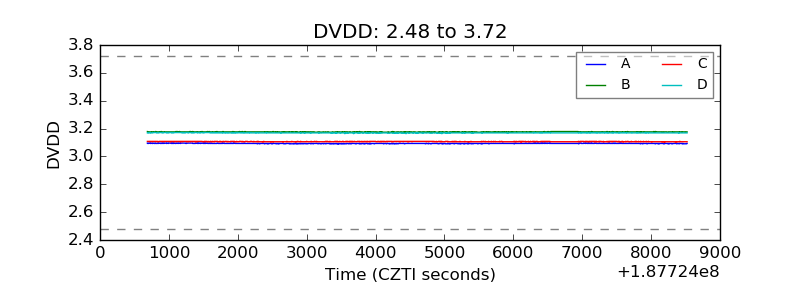 |
| Temperature 1 | 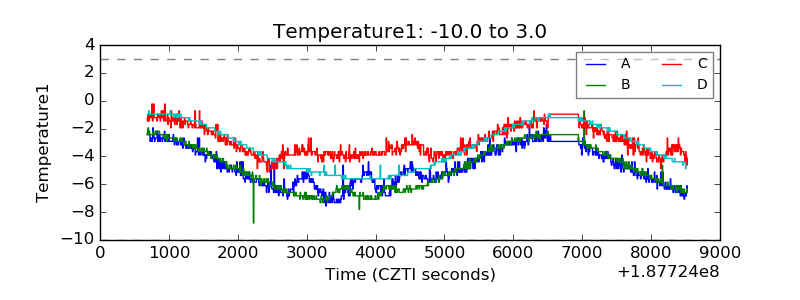 |
| Veto HV Monitor | 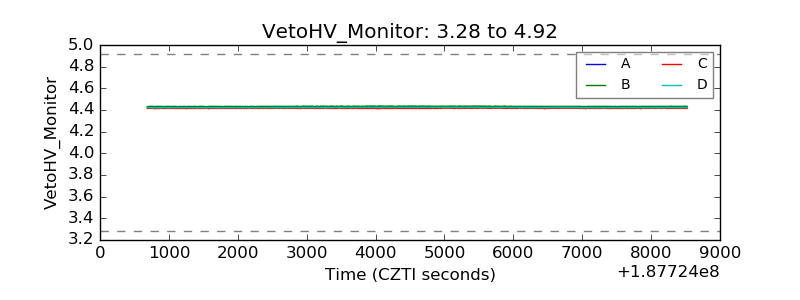 |
| Veto LLD | 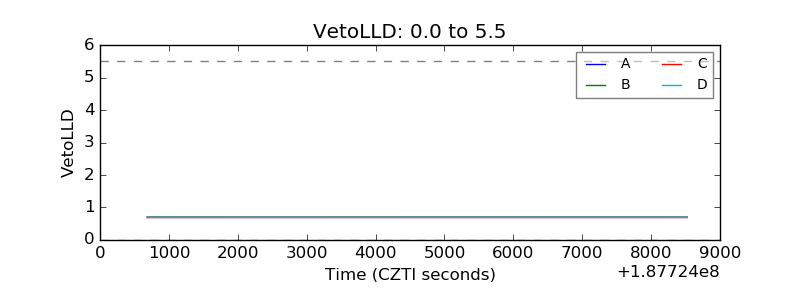 |
| Alpha Counter | 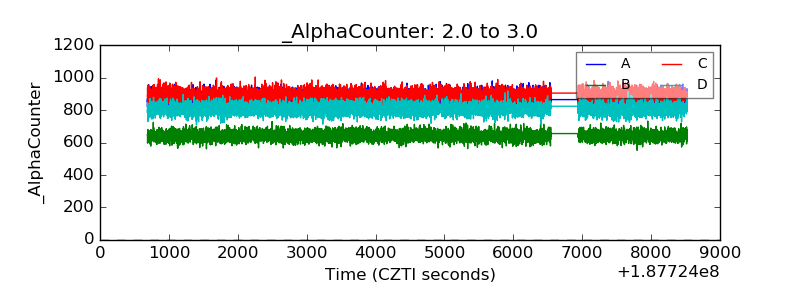 |
| _CPM_Rate | 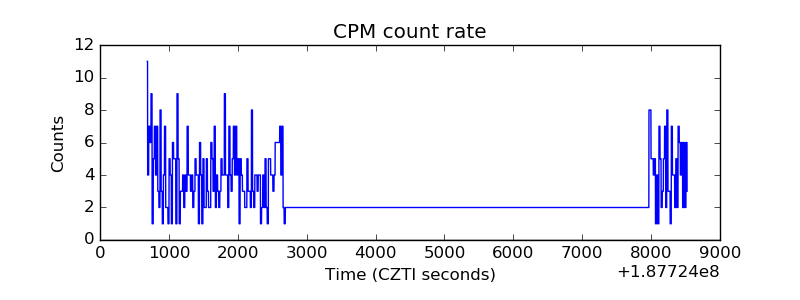 |
| CZT Counter | 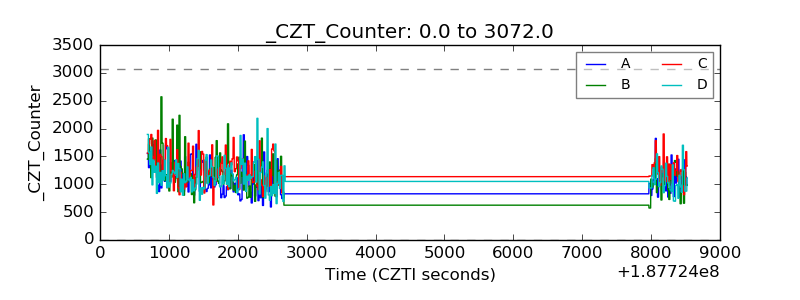 |
| +2.5 Volts monitor |  |
| +5 Volts monitor |  |
| _ROLL_ROT | 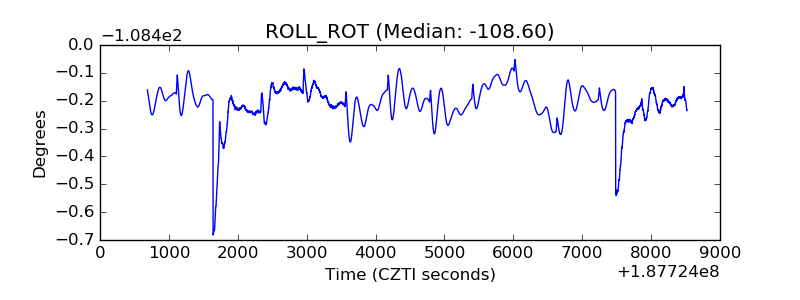 |
| _Roll_DEC | 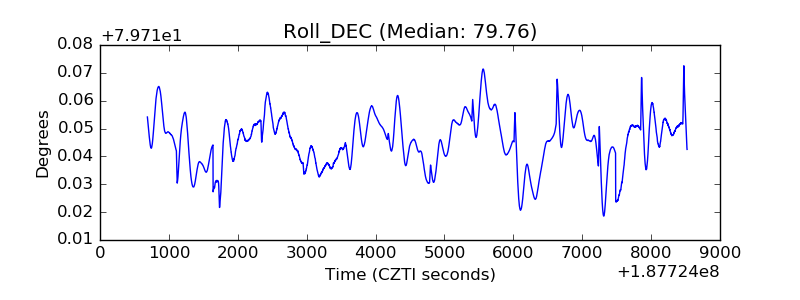 |
| _Roll_RA | 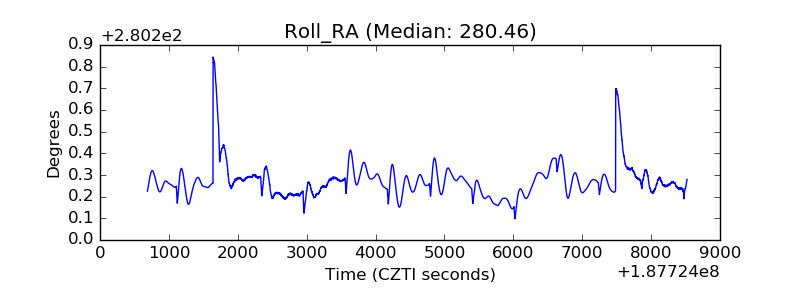 |
| Veto Counter | 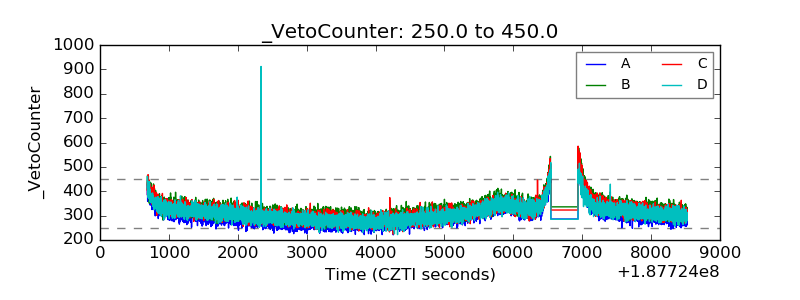 |