| Param | Original file | Final file |
|---|---|---|
| Filename | modeM0/AS1P01_997T03_9000000216_01136cztM0_level2.evt | modeM0/AS1P01_997T03_9000000216_01136cztM0_level2_quad_clean.evt |
| Size (bytes) | 1,057,705,920 | 100,388,160 |
| Size | 1008.7 MB | 95.7 MB |
| Events in quadrant A | 7,874,719 | 653,060 |
| Events in quadrant B | 8,265,783 | 649,000 |
| Events in quadrant C | 8,065,390 | 634,781 |
| Events in quadrant D | 7,375,053 | 629,149 |
| Mode M0 | |||
|---|---|---|---|
| Quadrant | BADHDUFLAG | Total packets | Discarded packets |
| A | 0 | 28271 | 2 |
| B | 0 | 29395 | 1 |
| C | 0 | 28780 | 1 |
| D | 0 | 26779 | 1 |
| Mode SS | |||
|---|---|---|---|
| Quadrant | BADHDUFLAG | Total packets | Discarded packets |
| A | 0 | 140 | 0 |
| B | 0 | 140 | 0 |
| C | 0 | 140 | 0 |
| D | 0 | 140 | 0 |
| Mode M9 | |||
|---|---|---|---|
| Quadrant | BADHDUFLAG | Total packets | Discarded packets |
| A | 0 | 6 | 0 |
| B | 0 | 6 | 0 |
| C | 0 | 6 | 0 |
| D | 0 | 6 | 0 |
| Quadrant | Total seconds | Saturated seconds | Saturation percentage |
|---|---|---|---|
| A | 6801 | 5 | 0.073519% |
| B | 6801 | 21 | 0.308778% |
| C | 6801 | 3 | 0.044111% |
| D | 6801 | 56 | 0.823408% |
Noise dominated data is calculated using 1-second bins in cleaned event files. If a bin has >2000 counts, and if more than 50% of those come from <1% of pixels, then it is considered to be noise-dominated and hence unusable.
| Quadrant | # 1 sec bins | Bins with >0 counts | Bins with >2000 counts | High rate bins dominated by noise | Noise dominated (total time) | Noise dominated (detector-on time) | Marked lightcurve |
|---|---|---|---|---|---|---|---|
| A | 7446 | 6802 | 123 | 123 | 1.65% | 1.81% | 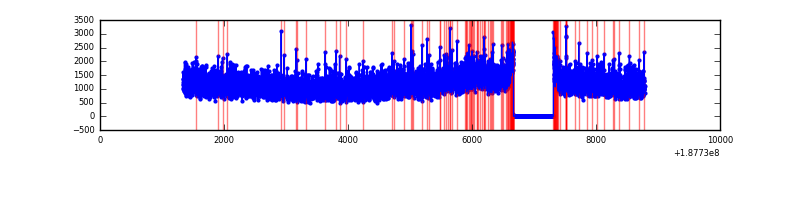 |
| B | 7446 | 6802 | 166 | 166 | 2.23% | 2.44% | 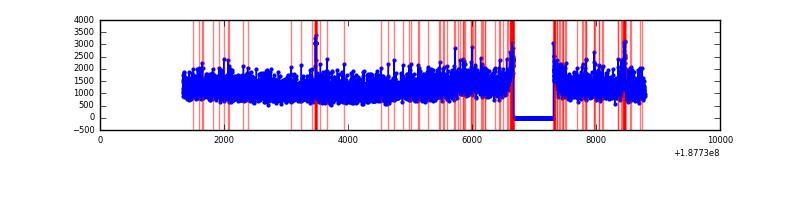 |
| C | 7446 | 6802 | 115 | 115 | 1.54% | 1.69% | 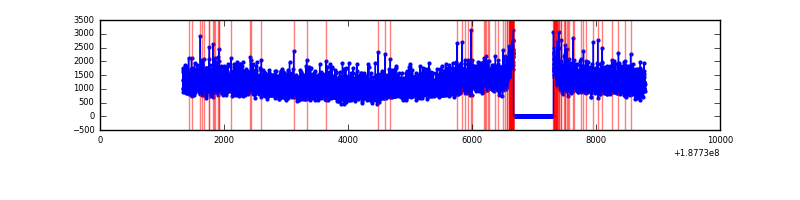 |
| D | 7446 | 6802 | 185 | 185 | 2.48% | 2.72% | 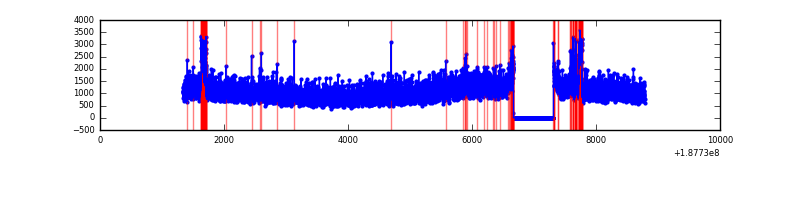 |
Top three noisy pixels from each quadrant. If the there are fewer than three noisy pixels in the level2.evt file, extra rows are filled as -1
| Pixel properties | Quadrant properties | ||||||
|---|---|---|---|---|---|---|---|
| Quadrant | DetID | PixID | Counts | Sigma | Mean | Median | Sigma |
| A | 14 | 238 | 30858 | 58.59 | 2043 | 2061 | 491.5 |
| A | 12 | 243 | 7975 | 12.03 | 2043 | 2061 | 491.5 |
| A | 11 | 79 | 7920 | 11.92 | 2043 | 2061 | 491.5 |
| B | 8 | 4 | 58644 | 112.95 | 2131 | 2141 | 500.2 |
| B | 14 | 3 | 41703 | 79.09 | 2131 | 2141 | 500.2 |
| B | 15 | 22 | 28401 | 52.49 | 2131 | 2141 | 500.2 |
| C | 15 | 241 | 309918 | 560.22 | 1961 | 2030 | 549.6 |
| C | 0 | 236 | 55119 | 96.6 | 1961 | 2030 | 549.6 |
| C | 3 | 111 | 23264 | 38.64 | 1961 | 2030 | 549.6 |
| D | 2 | 16 | 308144 | 528.38 | 1878 | 1943 | 579.5 |
| D | 13 | 189 | 17230 | 26.38 | 1878 | 1943 | 579.5 |
| D | 9 | 11 | 15273 | 23.0 | 1878 | 1943 | 579.5 |
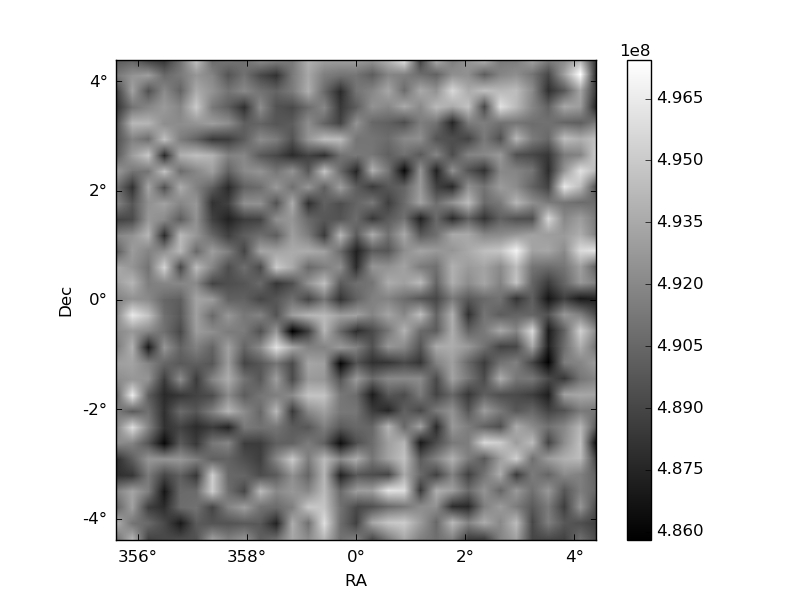
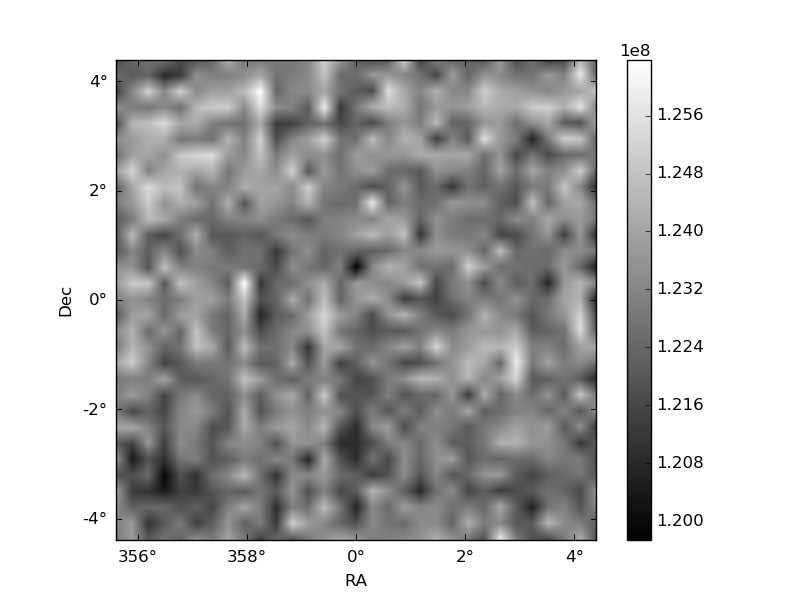
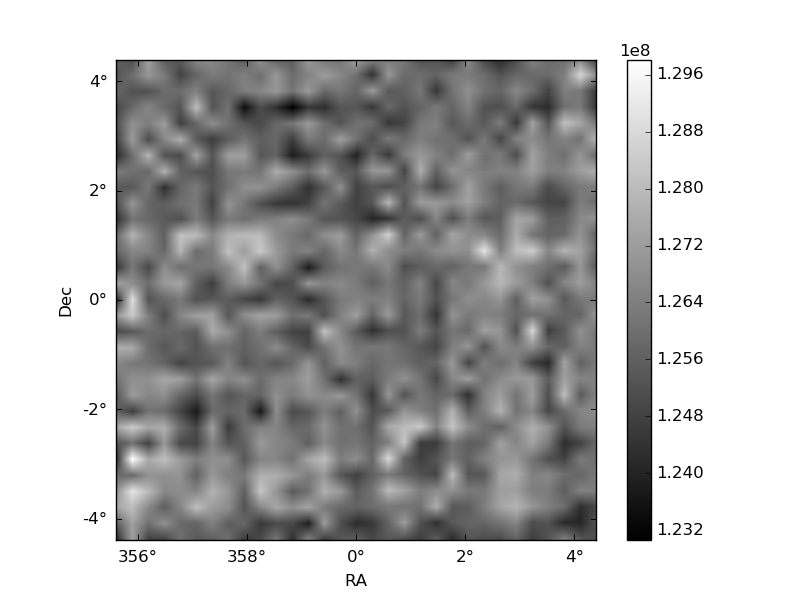
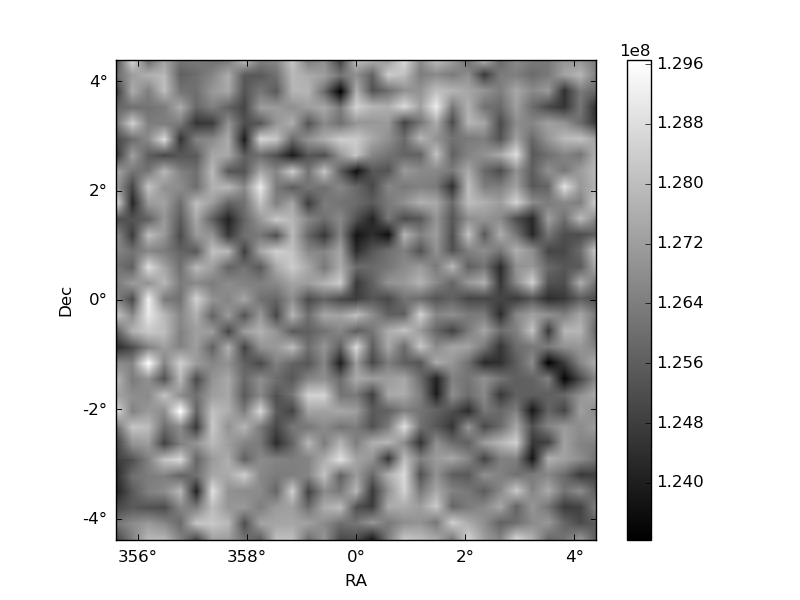
Histogram calculated using DETX and DETY for each event in the final _common_clean file
| Quadrant A | 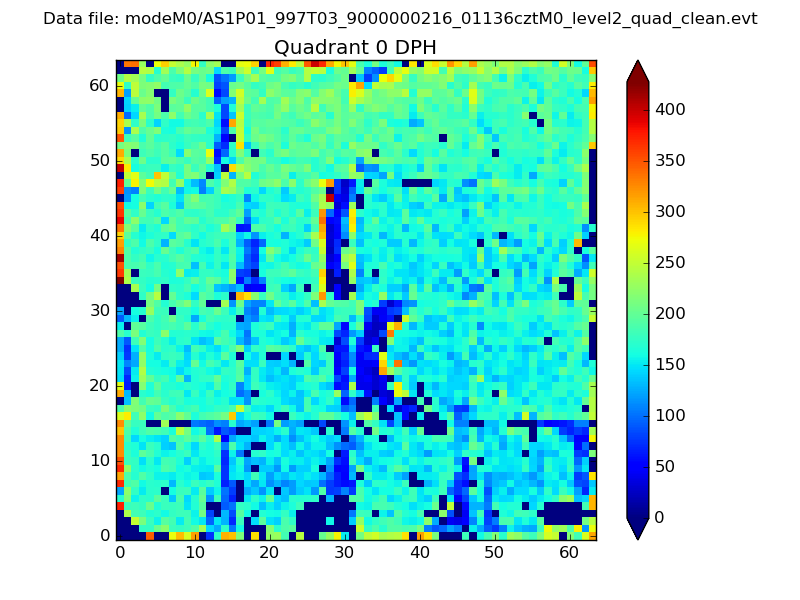 |
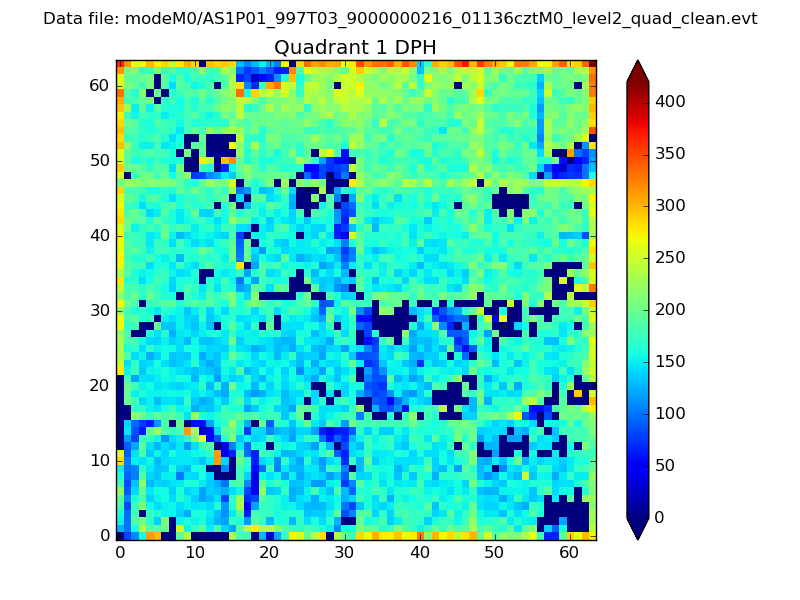 |
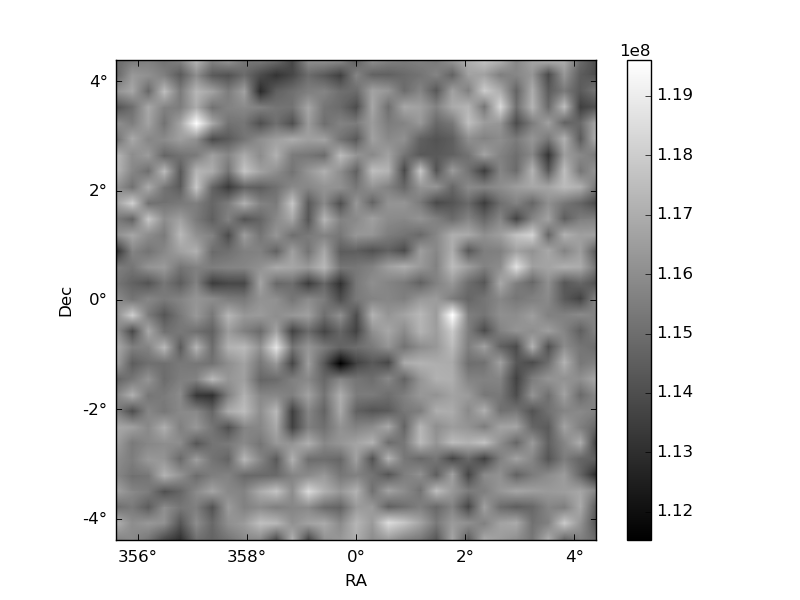
Quadrant B |
|---|---|---|---|
| Quadrant D | 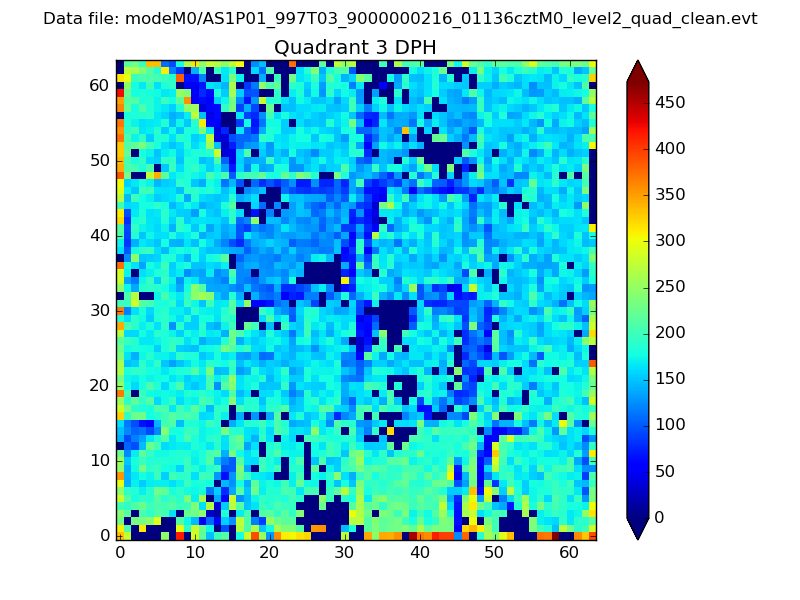 |
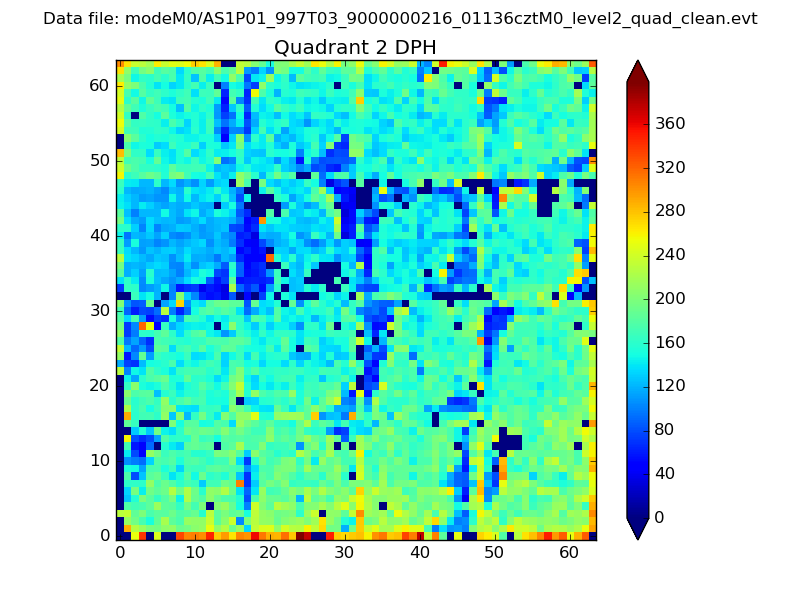 |
Quadrant C |
| Plot type | Count rate plots | Images |
|---|---|---|
| Comparison with Poisson distribution Blue bars denote a histogram of data divided into 1 sec bins. Red curve is a Poisson curve with rate = median count rate of data. |
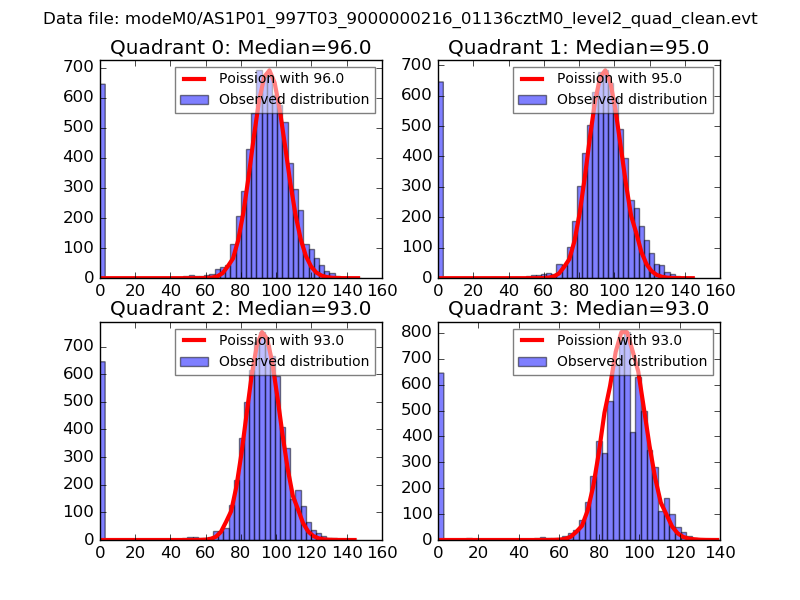 |
 |
| Quadrant-wise count rates Data is divided into 100 sec bins |
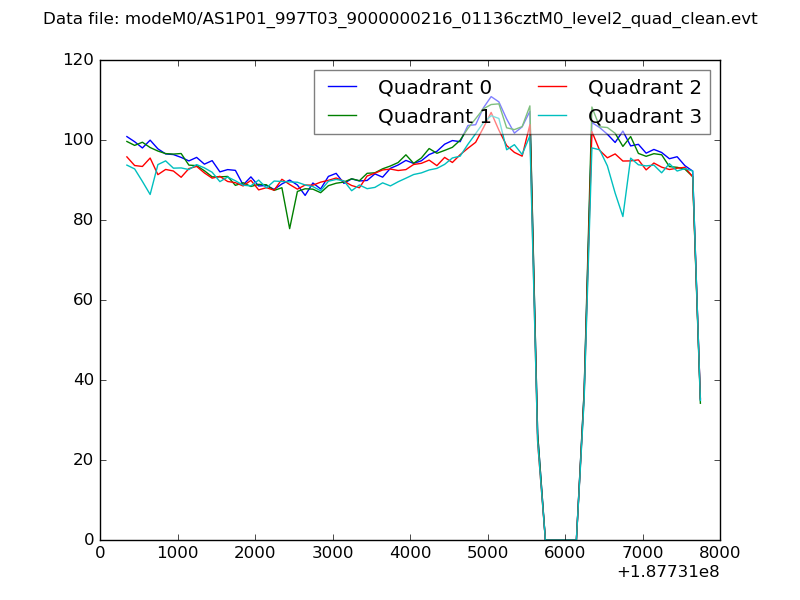 |
|
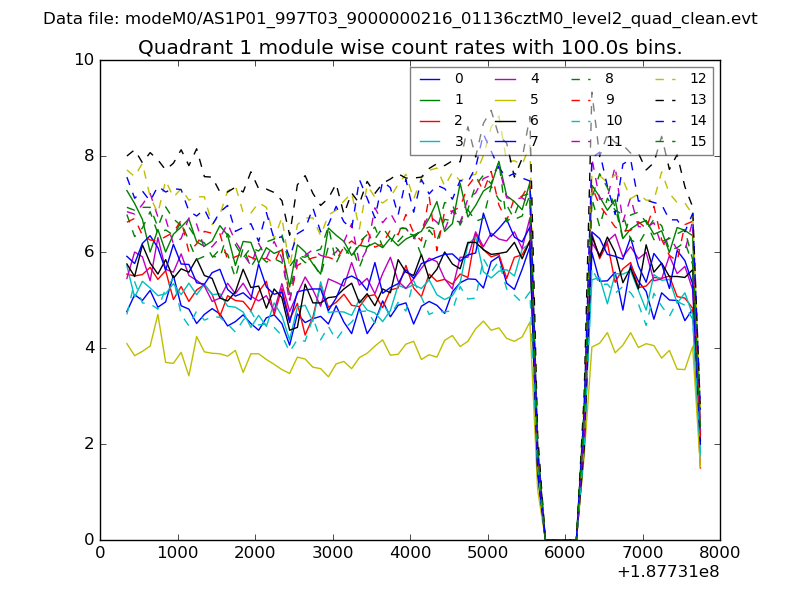
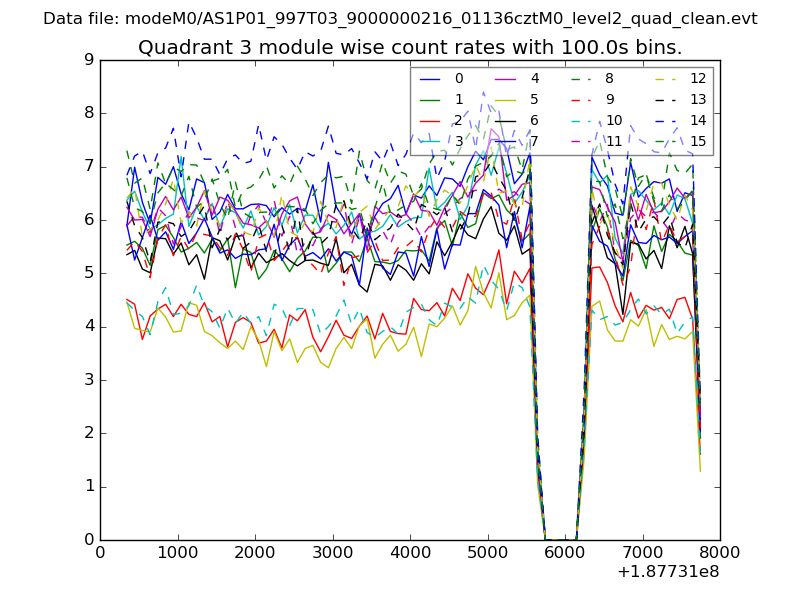
| Module-wise count rates for Quadrant A Data is divided into 100 sec bins |
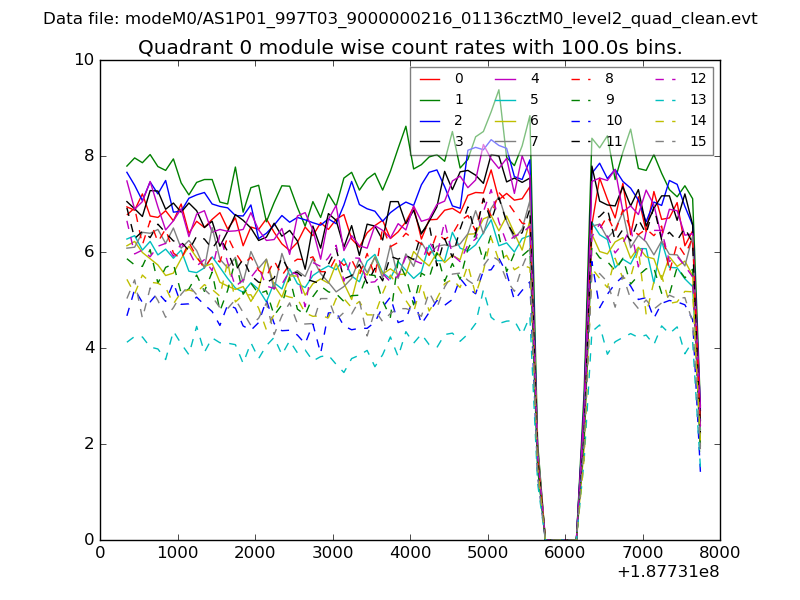 |
 |
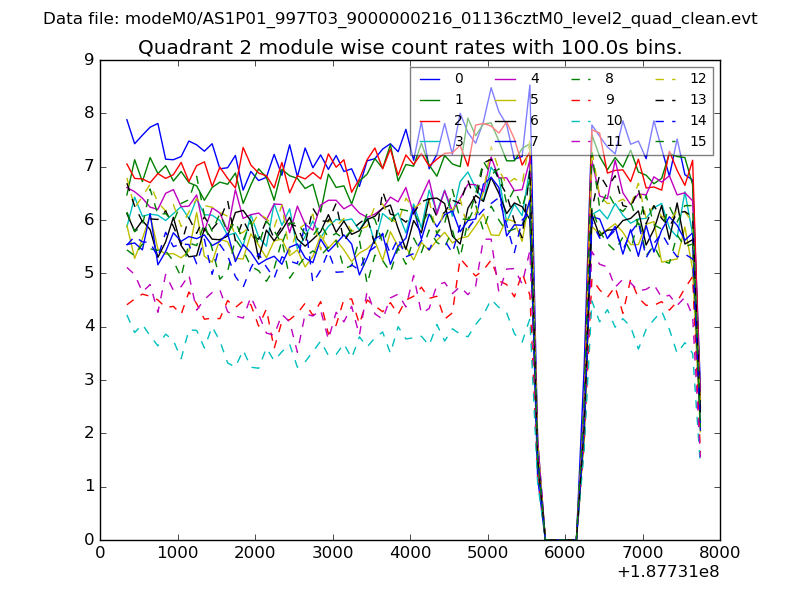
| Module-wise count rates for Quadrant B Data is divided into 100 sec bins |
 |
 |
| Module-wise count rates for Quadrant C Data is divided into 100 sec bins |
 |
 |
| Module-wise count rates for Quadrant D Data is divided into 100 sec bins |
 |
 |
| Parameter | Plot |
|---|---|
| CZT HV Monitor |  |
| D_VDD | 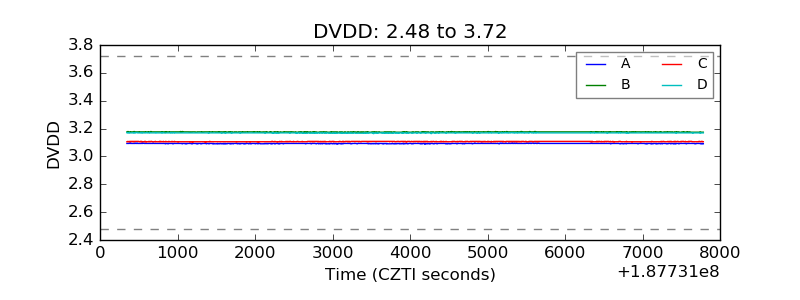 |
| Temperature 1 | 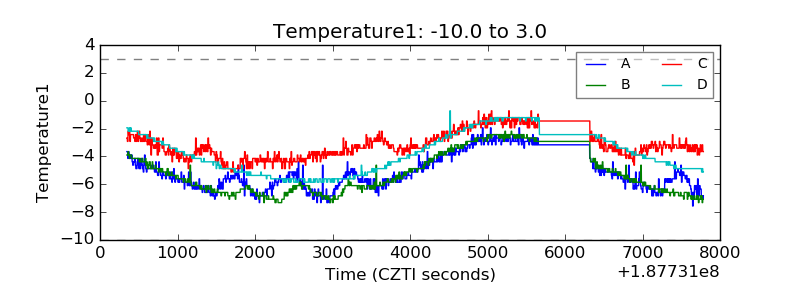 |
| Veto HV Monitor | 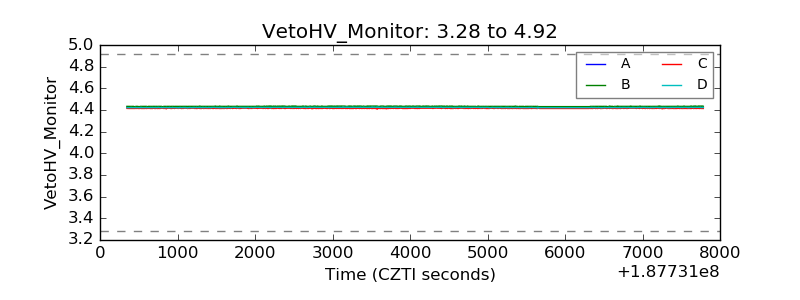 |
| Veto LLD | 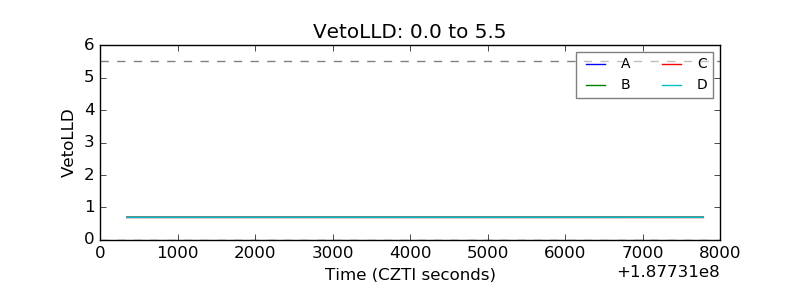 |
| Alpha Counter | 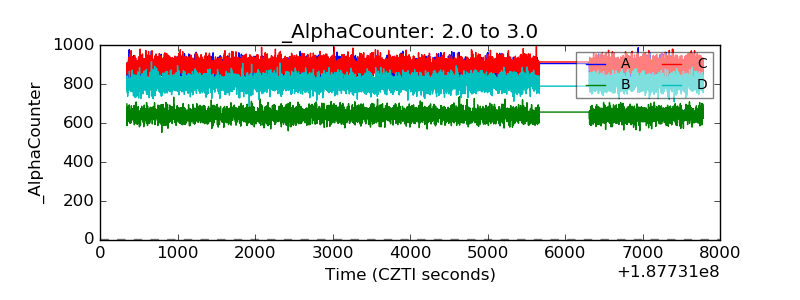 |
| _CPM_Rate | 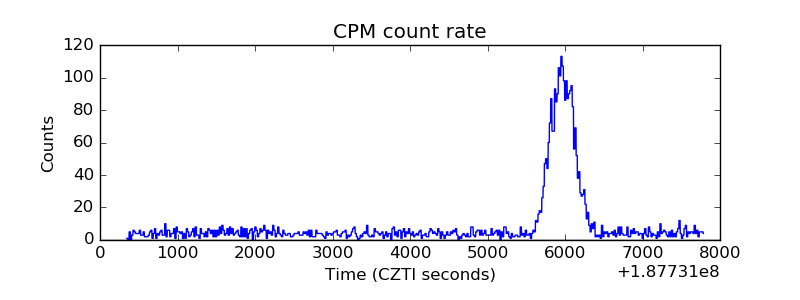 |
| CZT Counter | 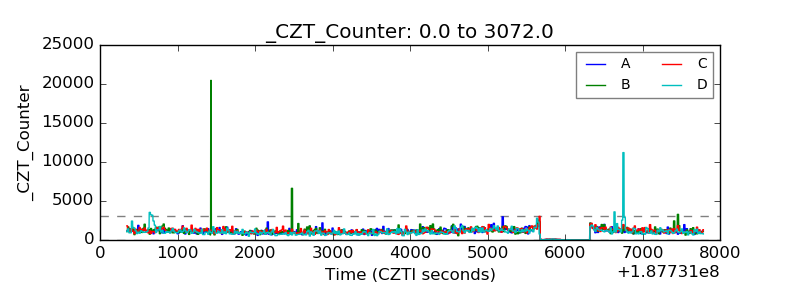 |
| +2.5 Volts monitor | 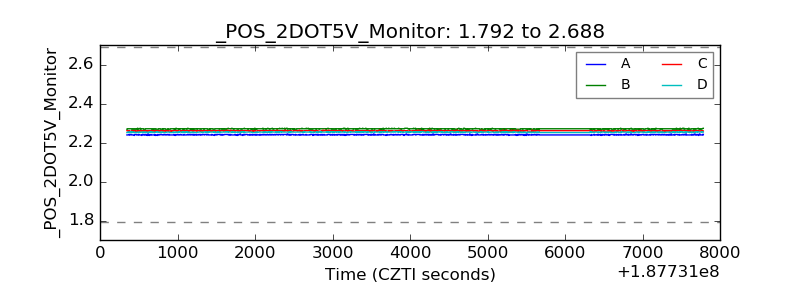 |
| +5 Volts monitor |  |
| _ROLL_ROT | 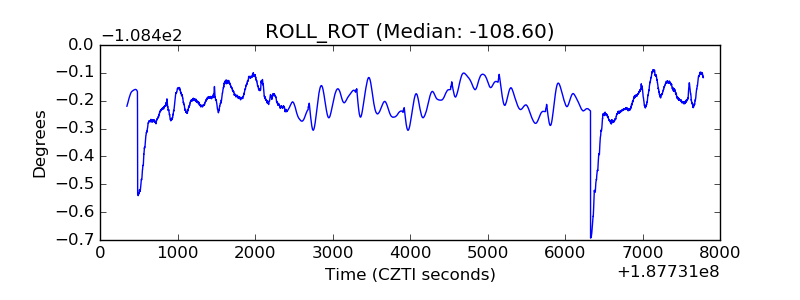 |
| _Roll_DEC | 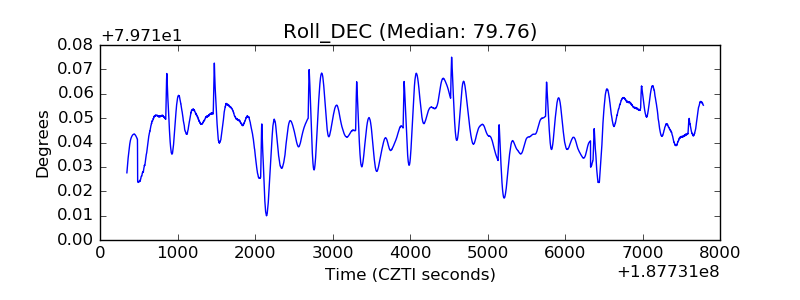 |
| _Roll_RA | 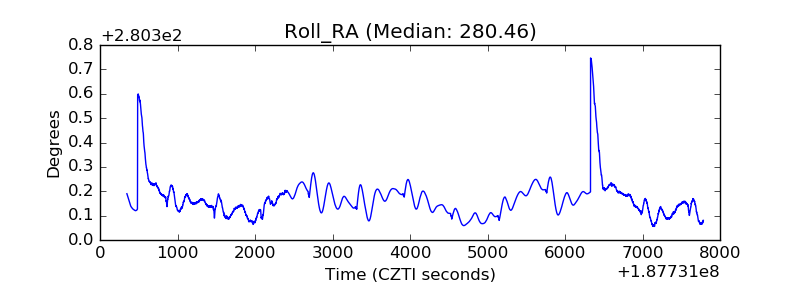 |
| Veto Counter | 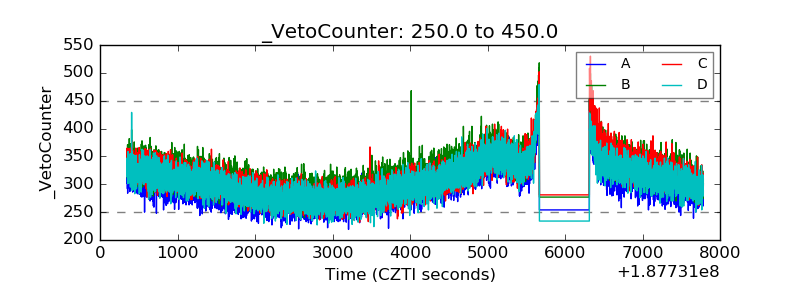 |