| Param | Original file | Final file |
|---|---|---|
| Filename | modeM0/AS1P01_997T03_9000000216_01137cztM0_level2.evt | modeM0/AS1P01_997T03_9000000216_01137cztM0_level2_quad_clean.evt |
| Size (bytes) | 371,900,160 | 36,486,720 |
| Size | 354.7 MB | 34.8 MB |
| Events in quadrant A | 2,692,280 | 233,912 |
| Events in quadrant B | 2,928,695 | 231,456 |
| Events in quadrant C | 2,897,331 | 230,268 |
| Events in quadrant D | 2,574,865 | 228,001 |
| Mode M0 | |||
|---|---|---|---|
| Quadrant | BADHDUFLAG | Total packets | Discarded packets |
| A | 0 | 9839 | 20 |
| B | 0 | 10518 | 24 |
| C | 0 | 10435 | 20 |
| D | 0 | 9489 | 20 |
| Mode SS | |||
|---|---|---|---|
| Quadrant | BADHDUFLAG | Total packets | Discarded packets |
| A | 0 | 50 | 0 |
| B | 0 | 50 | 0 |
| C | 0 | 50 | 0 |
| D | 0 | 50 | 0 |
| Quadrant | Total seconds | Saturated seconds | Saturation percentage |
|---|---|---|---|
| A | 2519 | 1 | 0.039698% |
| B | 2519 | 5 | 0.198491% |
| C | 2519 | 0 | 0.000000% |
| D | 2519 | 34 | 1.349742% |
Noise dominated data is calculated using 1-second bins in cleaned event files. If a bin has >2000 counts, and if more than 50% of those come from <1% of pixels, then it is considered to be noise-dominated and hence unusable.
| Quadrant | # 1 sec bins | Bins with >0 counts | Bins with >2000 counts | High rate bins dominated by noise | Noise dominated (total time) | Noise dominated (detector-on time) | Marked lightcurve |
|---|---|---|---|---|---|---|---|
| A | 2519 | 2519 | 21 | 21 | 0.83% | 0.83% | 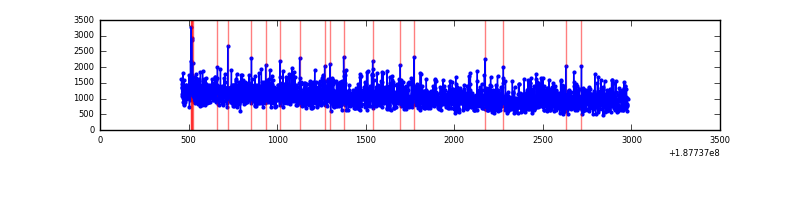 |
| B | 2519 | 2519 | 50 | 50 | 1.98% | 1.98% | 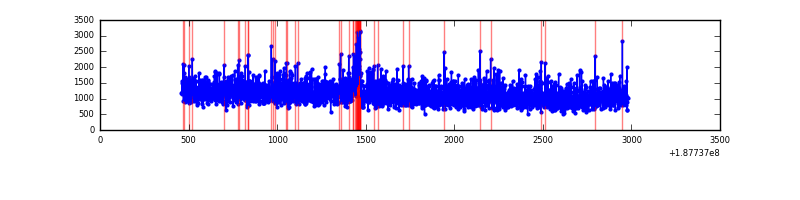 |
| C | 2520 | 2520 | 23 | 23 | 0.91% | 0.91% |  |
| D | 2519 | 2519 | 71 | 71 | 2.82% | 2.82% | 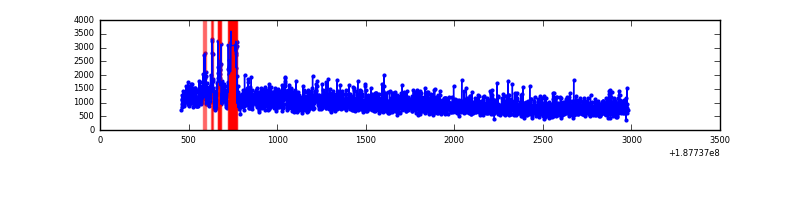 |
Top three noisy pixels from each quadrant. If the there are fewer than three noisy pixels in the level2.evt file, extra rows are filled as -1
| Pixel properties | Quadrant properties | ||||||
|---|---|---|---|---|---|---|---|
| Quadrant | DetID | PixID | Counts | Sigma | Mean | Median | Sigma |
| A | 14 | 238 | 13836 | 77.16 | 696 | 700 | 170.2 |
| A | 0 | 175 | 4617 | 23.01 | 696 | 700 | 170.2 |
| A | 3 | 111 | 2330 | 9.57 | 696 | 700 | 170.2 |
| B | 14 | 3 | 39976 | 221.24 | 753 | 755 | 177.3 |
| B | 15 | 22 | 12895 | 68.48 | 753 | 755 | 177.3 |
| B | 4 | 222 | 5859 | 28.79 | 753 | 755 | 177.3 |
| C | 15 | 241 | 113810 | 572.56 | 701 | 726 | 197.5 |
| C | 0 | 236 | 29114 | 143.73 | 701 | 726 | 197.5 |
| C | 3 | 111 | 8051 | 37.08 | 701 | 726 | 197.5 |
| D | 2 | 16 | 150092 | 753.25 | 641 | 657 | 198.4 |
| D | 2 | 63 | 11310 | 53.7 | 641 | 657 | 198.4 |
| D | 13 | 169 | 6358 | 28.74 | 641 | 657 | 198.4 |
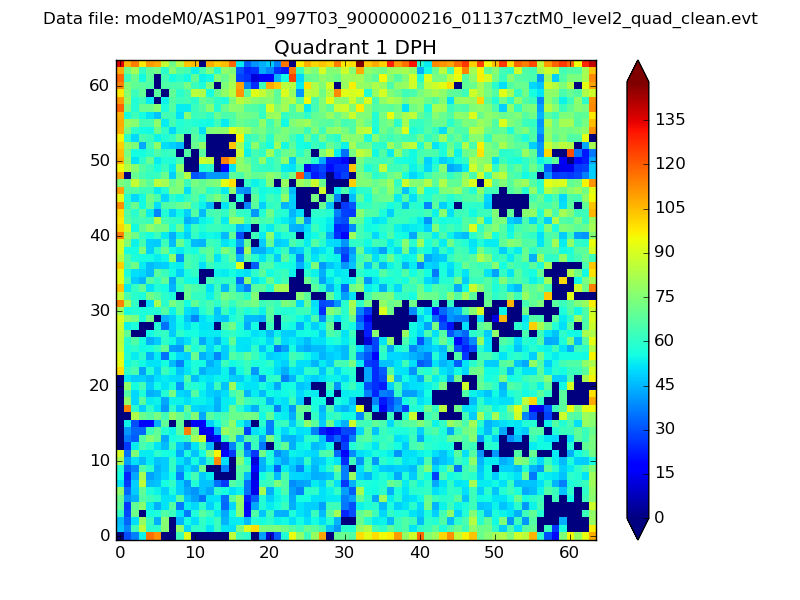
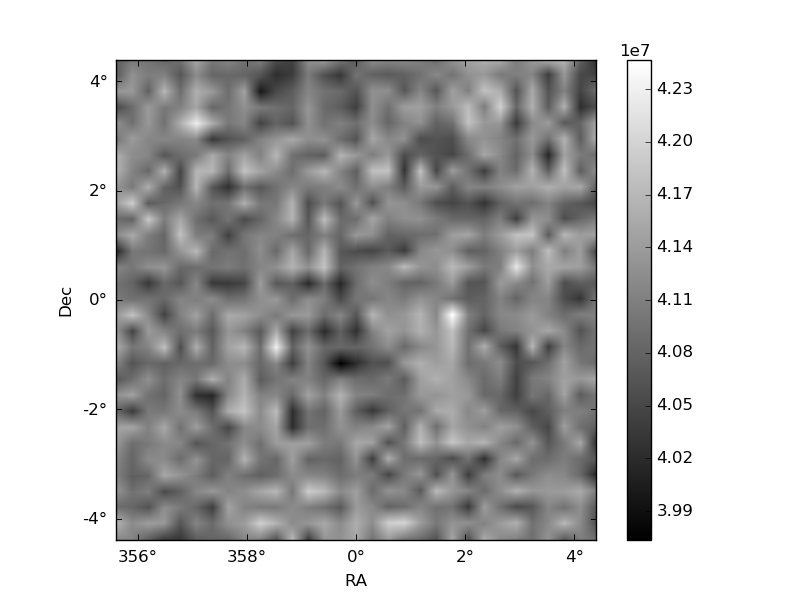
Histogram calculated using DETX and DETY for each event in the final _common_clean file
| Quadrant A | 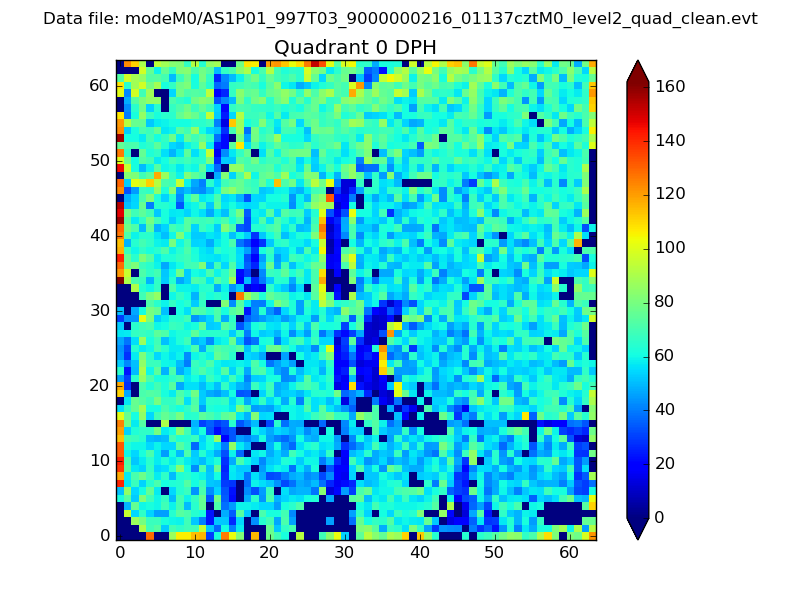 |
 |
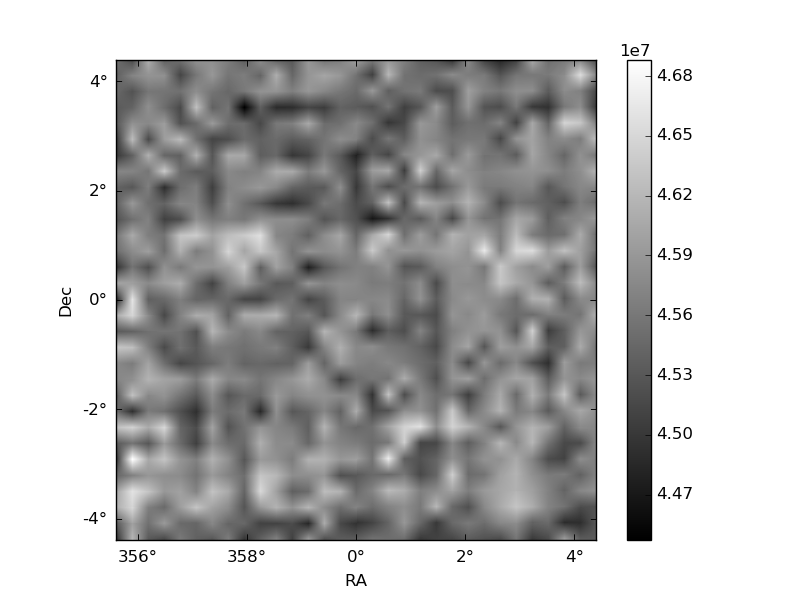
Quadrant B |
|---|---|---|---|
| Quadrant D | 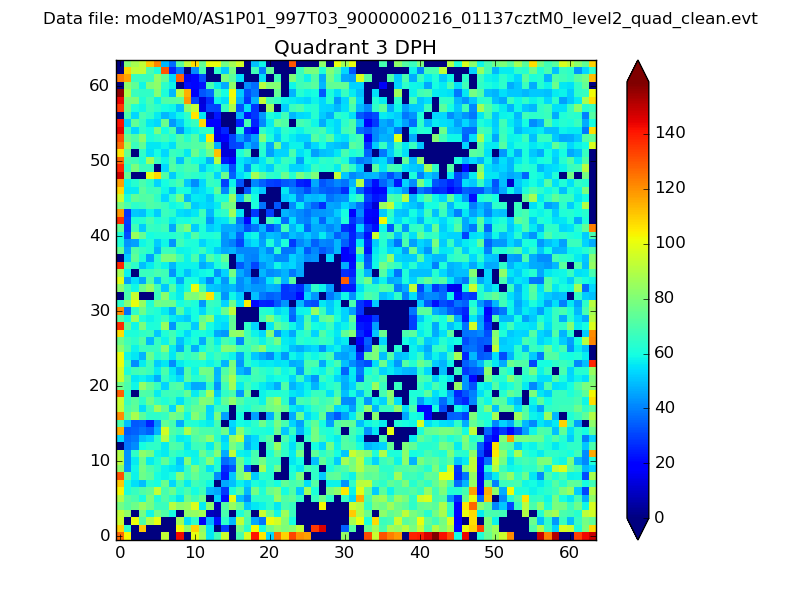 |
 |
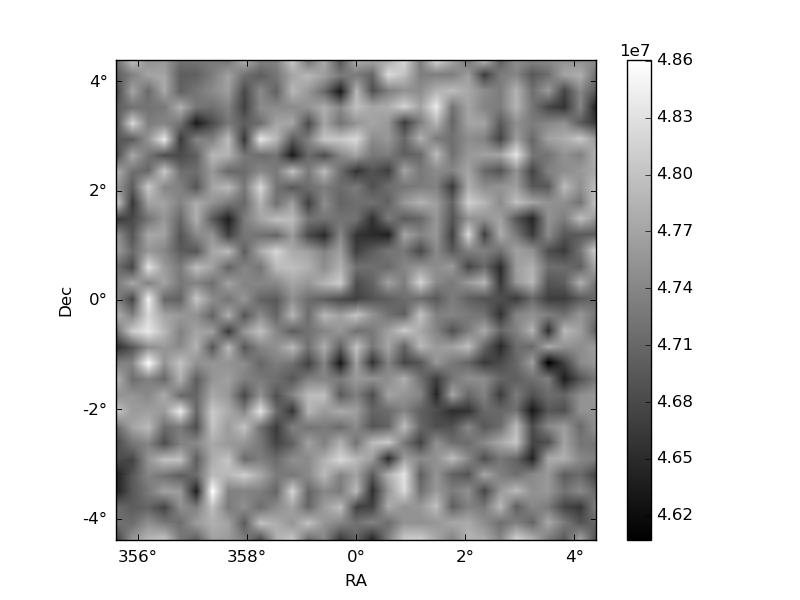
Quadrant C |
| Plot type | Count rate plots | Images |
|---|---|---|
| Comparison with Poisson distribution Blue bars denote a histogram of data divided into 1 sec bins. Red curve is a Poisson curve with rate = median count rate of data. |
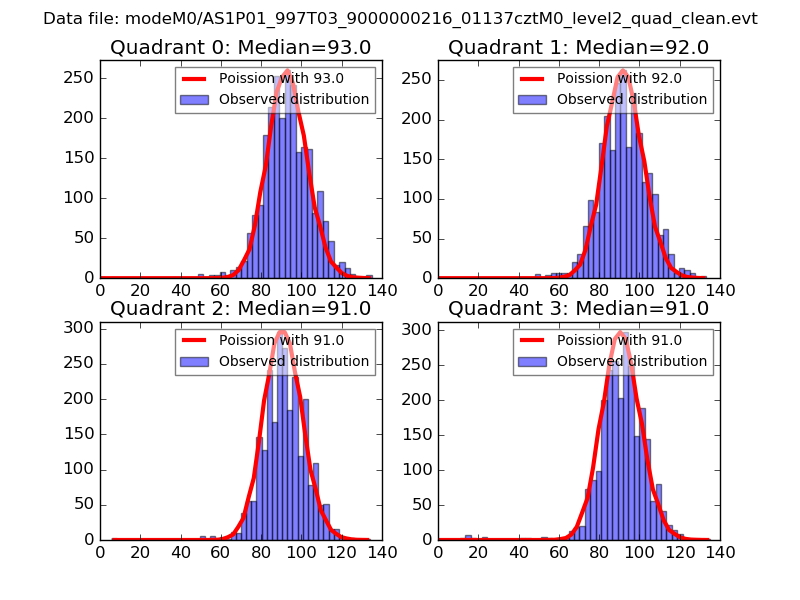 |
 |
| Quadrant-wise count rates Data is divided into 100 sec bins |
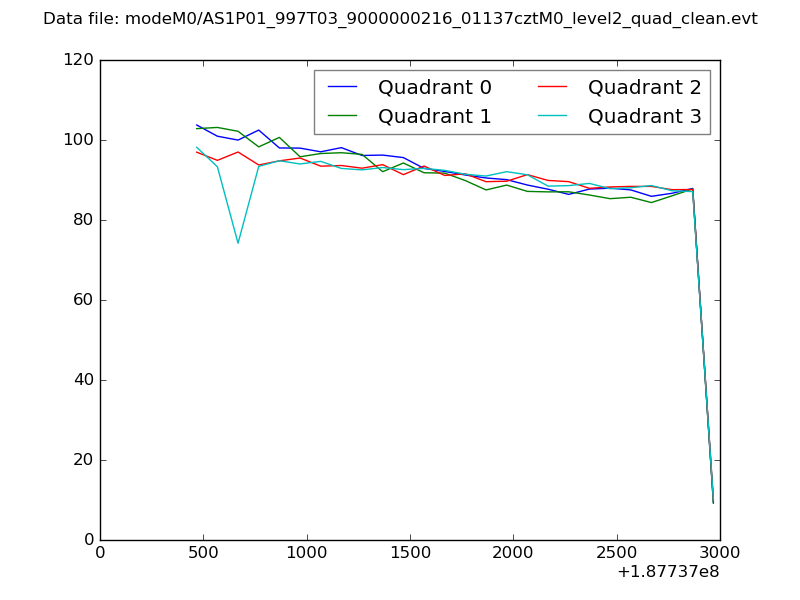 |
|
| Module-wise count rates for Quadrant A Data is divided into 100 sec bins |
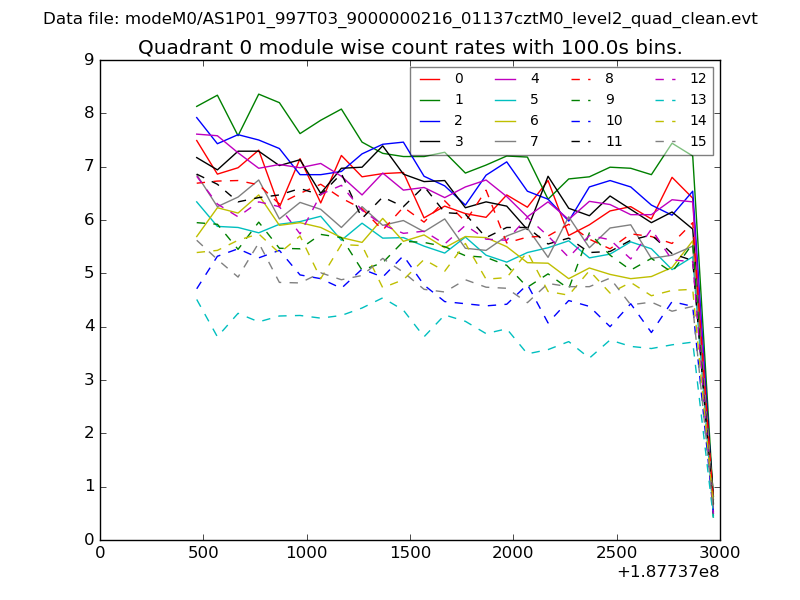 |
 |
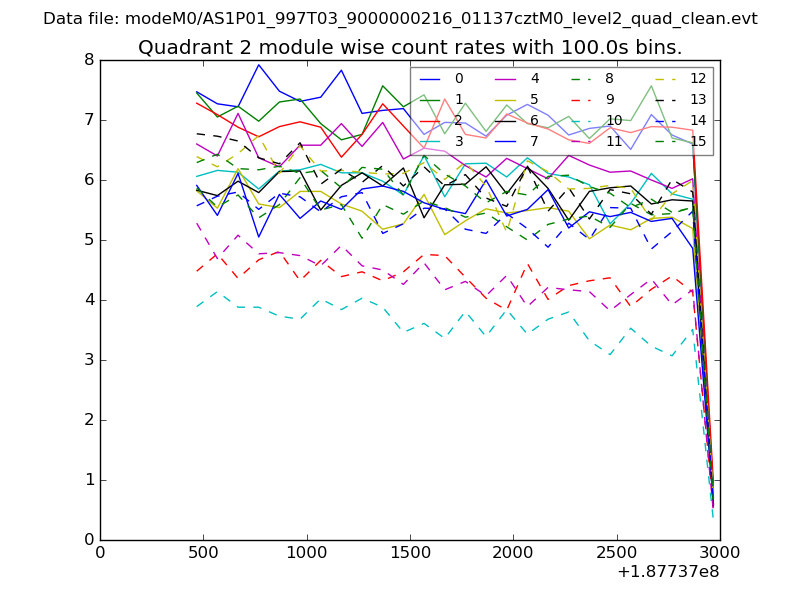
| Module-wise count rates for Quadrant B Data is divided into 100 sec bins |
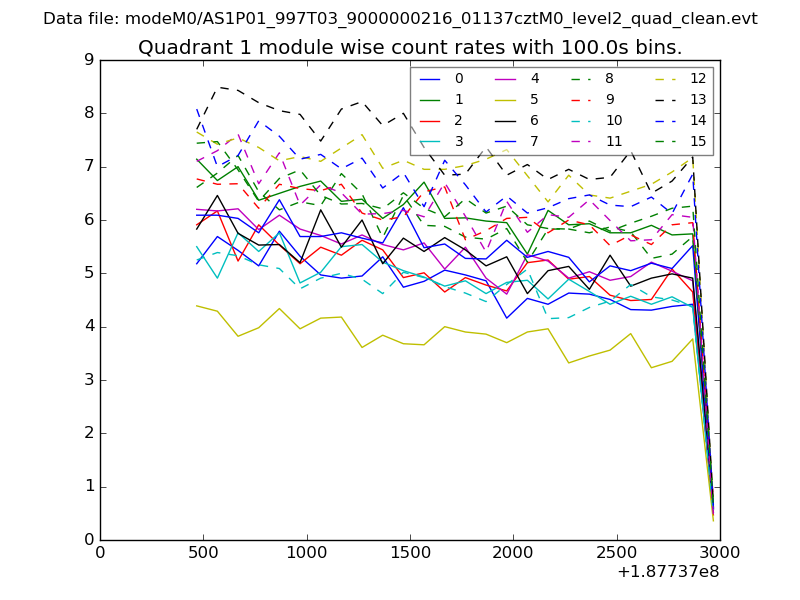 |
 |
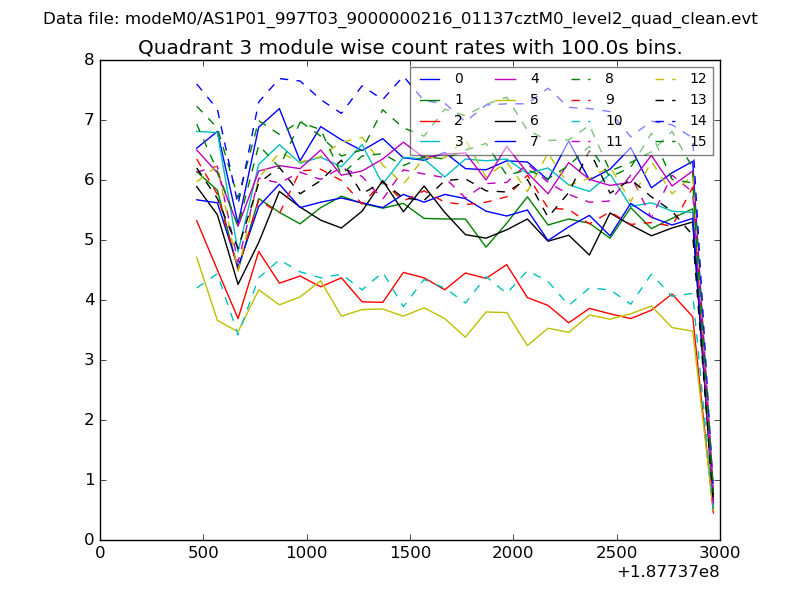
| Module-wise count rates for Quadrant C Data is divided into 100 sec bins |
 |
 |
| Module-wise count rates for Quadrant D Data is divided into 100 sec bins |
 |
 |
| Parameter | Plot |
|---|---|
| CZT HV Monitor | 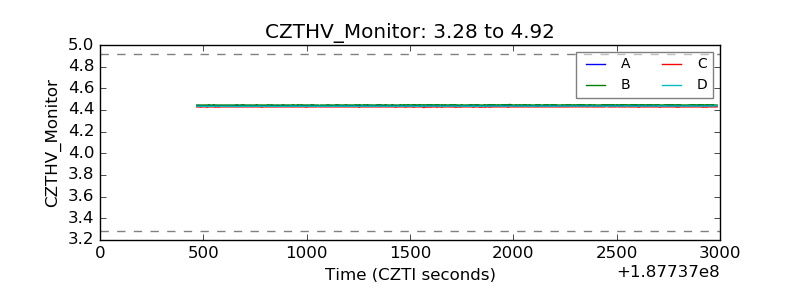 |
| D_VDD | 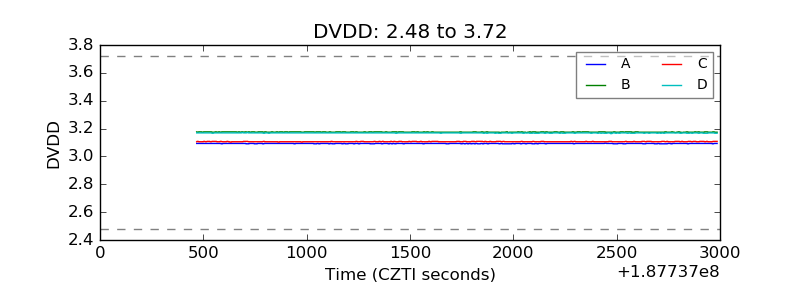 |
| Temperature 1 | 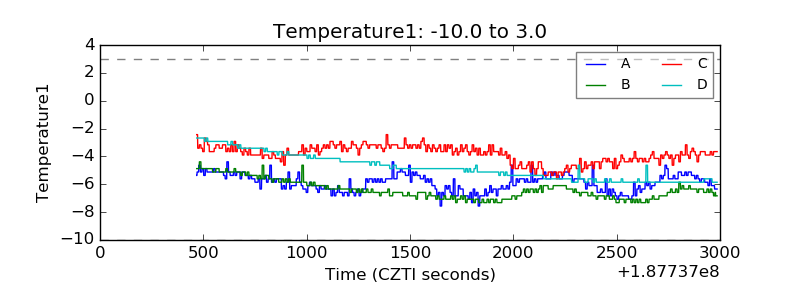 |
| Veto HV Monitor | 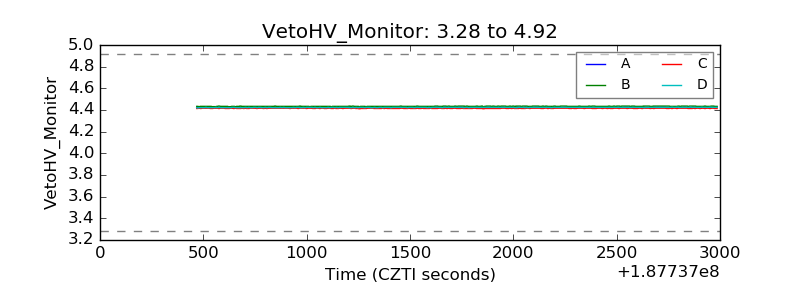 |
| Veto LLD | 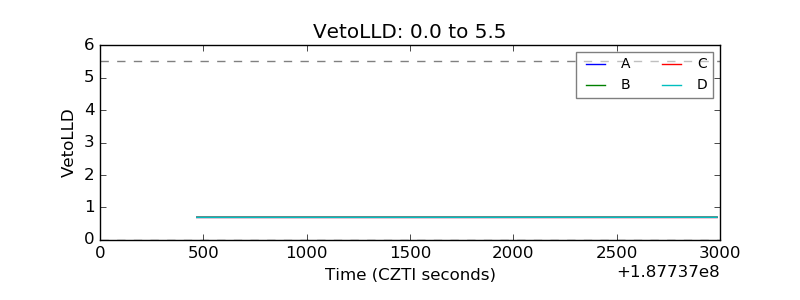 |
| Alpha Counter | 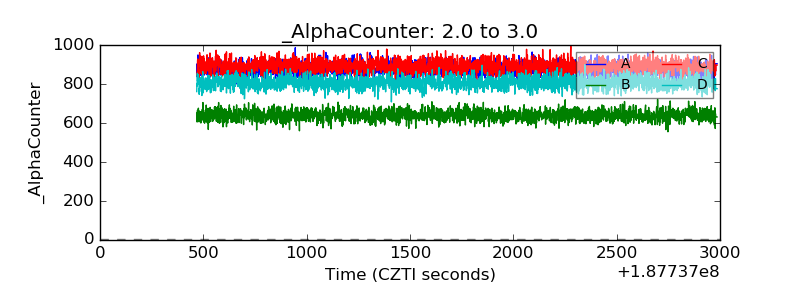 |
| _CPM_Rate | 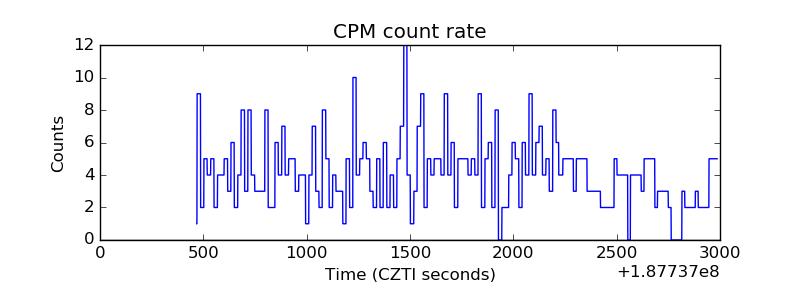 |
| CZT Counter | 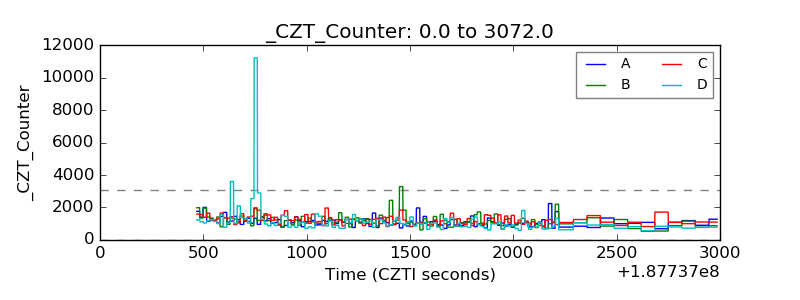 |
| +2.5 Volts monitor |  |
| +5 Volts monitor |  |
| _ROLL_ROT | 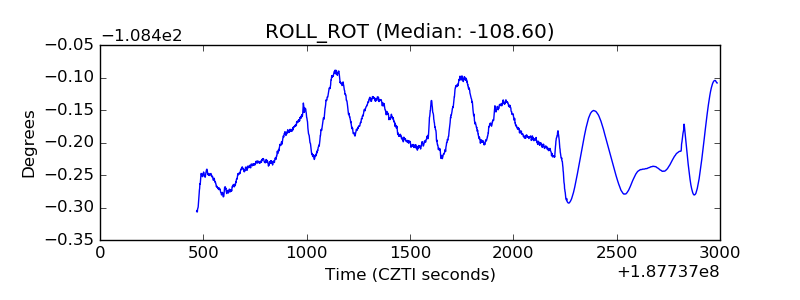 |
| _Roll_DEC | 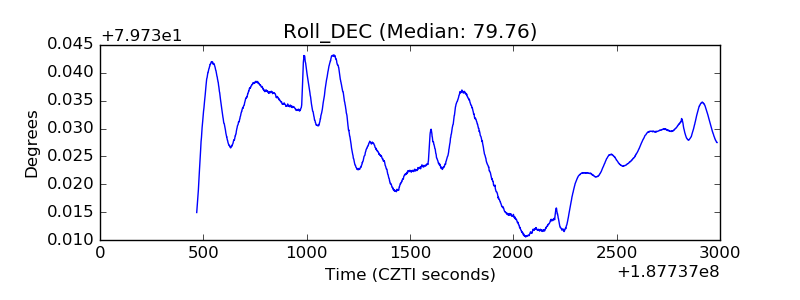 |
| _Roll_RA | 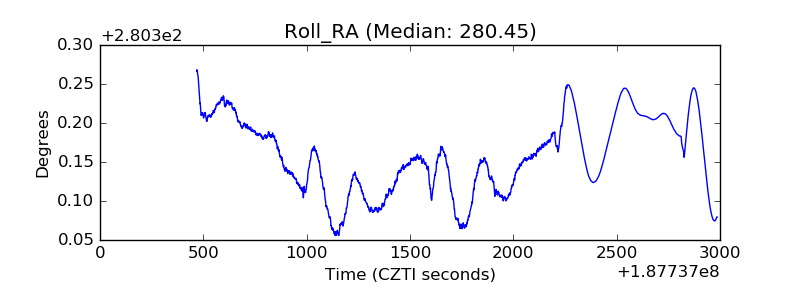 |
| Veto Counter | 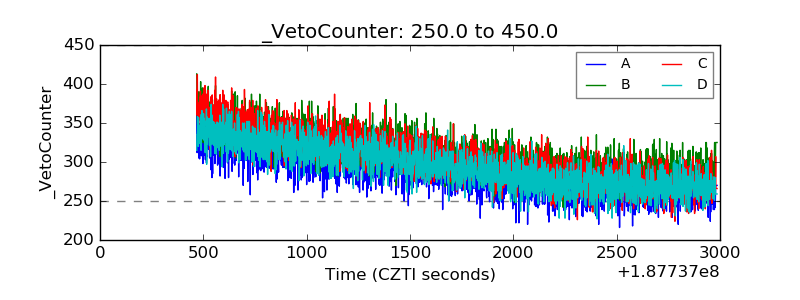 |