| Param | Original file | Final file |
|---|---|---|
| Filename | modeM0/AS1P01_997T03_9000000216_01138cztM0_level2.evt | modeM0/AS1P01_997T03_9000000216_01138cztM0_level2_quad_clean.evt |
| Size (bytes) | 1,087,709,760 | 102,962,880 |
| Size | 1.0 GB | 98.2 MB |
| Events in quadrant A | 7,969,858 | 669,509 |
| Events in quadrant B | 8,400,066 | 670,229 |
| Events in quadrant C | 8,723,394 | 650,161 |
| Events in quadrant D | 7,392,036 | 649,367 |
| Mode M0 | |||
|---|---|---|---|
| Quadrant | BADHDUFLAG | Total packets | Discarded packets |
| A | 0 | 28610 | 3 |
| B | 0 | 29812 | 2 |
| C | 0 | 30863 | 2 |
| D | 0 | 26866 | 2 |
| Mode SS | |||
|---|---|---|---|
| Quadrant | BADHDUFLAG | Total packets | Discarded packets |
| A | 0 | 138 | 0 |
| B | 0 | 138 | 0 |
| C | 0 | 138 | 0 |
| D | 0 | 138 | 0 |
| Mode M9 | |||
|---|---|---|---|
| Quadrant | BADHDUFLAG | Total packets | Discarded packets |
| A | 0 | 12 | 0 |
| B | 0 | 12 | 0 |
| C | 0 | 12 | 0 |
| D | 0 | 13 | 0 |
| Quadrant | Total seconds | Saturated seconds | Saturation percentage |
|---|---|---|---|
| A | 6881 | 4 | 0.058131% |
| B | 6881 | 10 | 0.145328% |
| C | 6881 | 95 | 1.380613% |
| D | 6881 | 15 | 0.217992% |
Noise dominated data is calculated using 1-second bins in cleaned event files. If a bin has >2000 counts, and if more than 50% of those come from <1% of pixels, then it is considered to be noise-dominated and hence unusable.
| Quadrant | # 1 sec bins | Bins with >0 counts | Bins with >2000 counts | High rate bins dominated by noise | Noise dominated (total time) | Noise dominated (detector-on time) | Marked lightcurve |
|---|---|---|---|---|---|---|---|
| A | 7826 | 6882 | 130 | 130 | 1.66% | 1.89% | 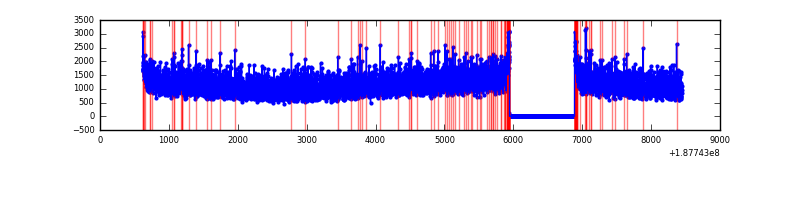 |
| B | 7826 | 6882 | 190 | 190 | 2.43% | 2.76% | 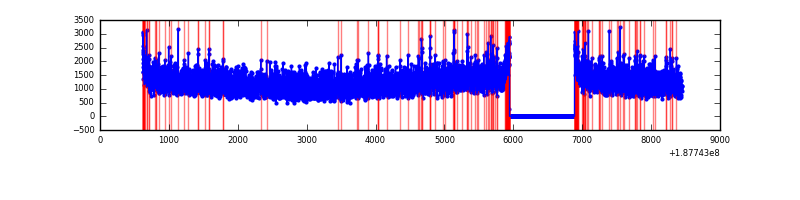 |
| C | 7826 | 6882 | 382 | 382 | 4.88% | 5.55% | 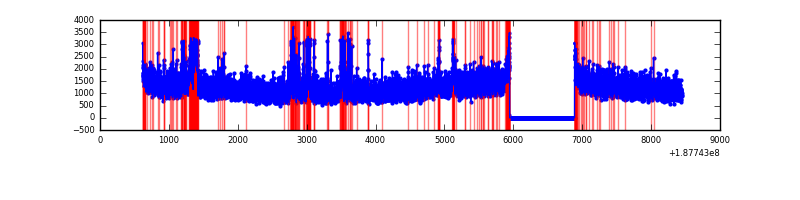 |
| D | 7826 | 6882 | 98 | 98 | 1.25% | 1.42% | 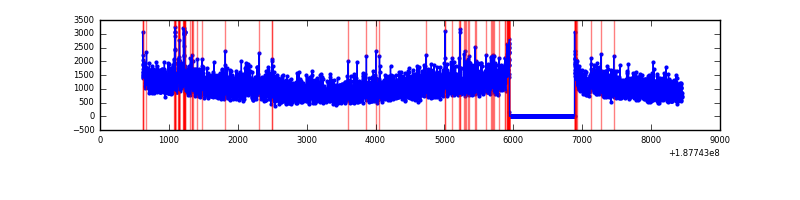 |
Top three noisy pixels from each quadrant. If the there are fewer than three noisy pixels in the level2.evt file, extra rows are filled as -1
| Pixel properties | Quadrant properties | ||||||
|---|---|---|---|---|---|---|---|
| Quadrant | DetID | PixID | Counts | Sigma | Mean | Median | Sigma |
| A | 0 | 175 | 17167 | 30.25 | 2068 | 2081 | 498.7 |
| A | 12 | 243 | 12523 | 20.94 | 2068 | 2081 | 498.7 |
| A | 11 | 79 | 10853 | 17.59 | 2068 | 2081 | 498.7 |
| B | 15 | 22 | 47555 | 88.14 | 2176 | 2187 | 514.7 |
| B | 0 | 190 | 25643 | 45.57 | 2176 | 2187 | 514.7 |
| B | 5 | 249 | 17993 | 30.71 | 2176 | 2187 | 514.7 |
| C | 12 | 206 | 642914 | 1160.74 | 1971 | 2035 | 552.1 |
| C | 15 | 241 | 325748 | 586.3 | 1971 | 2035 | 552.1 |
| C | 3 | 111 | 22048 | 36.25 | 1971 | 2035 | 552.1 |
| D | 9 | 11 | 299698 | 511.41 | 1887 | 1956 | 582.2 |
| D | 13 | 252 | 16995 | 25.83 | 1887 | 1956 | 582.2 |
| D | 7 | 207 | 16721 | 25.36 | 1887 | 1956 | 582.2 |
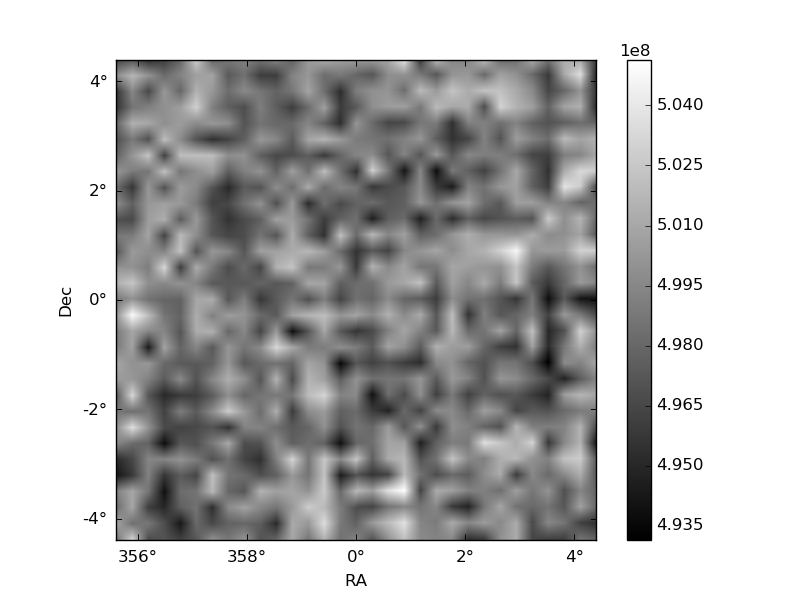
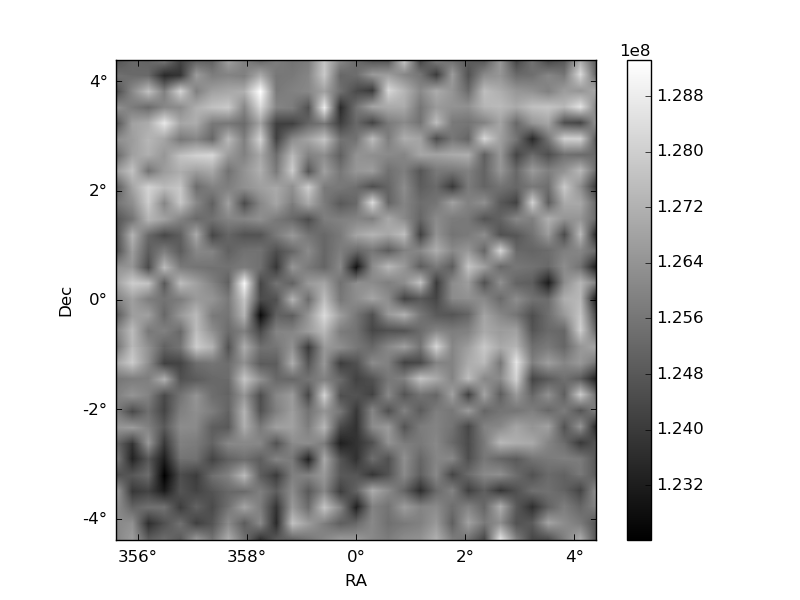
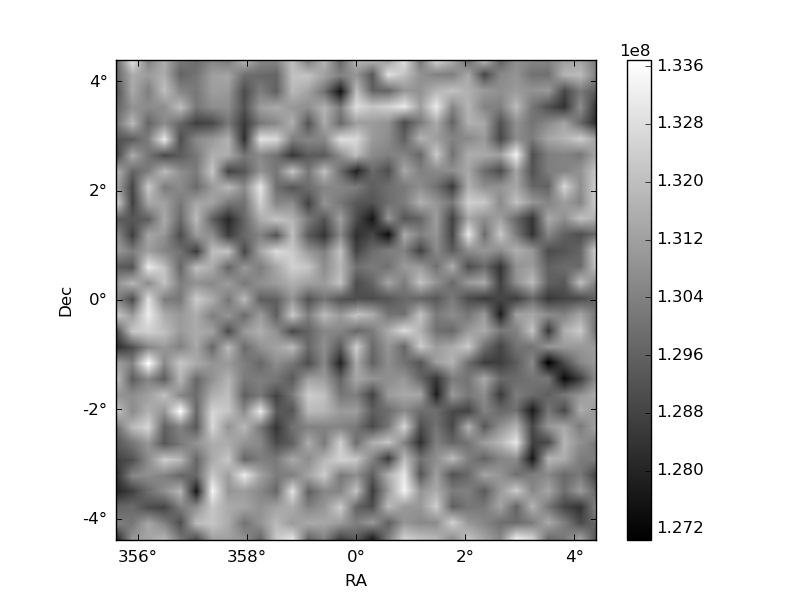
Histogram calculated using DETX and DETY for each event in the final _common_clean file
| Quadrant A | 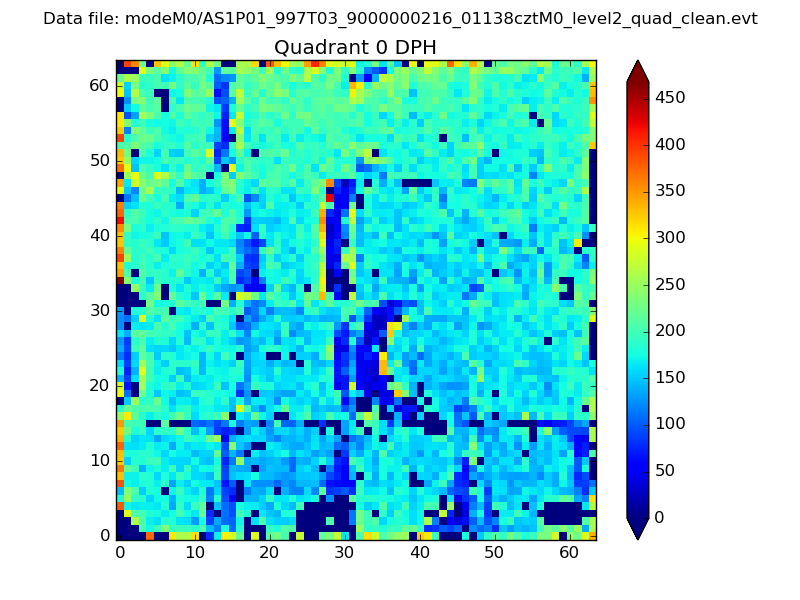 |
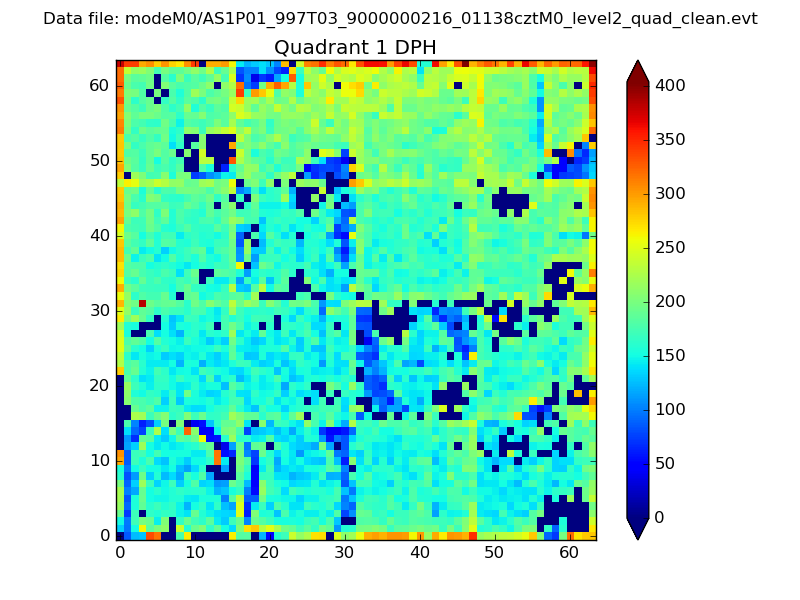 |
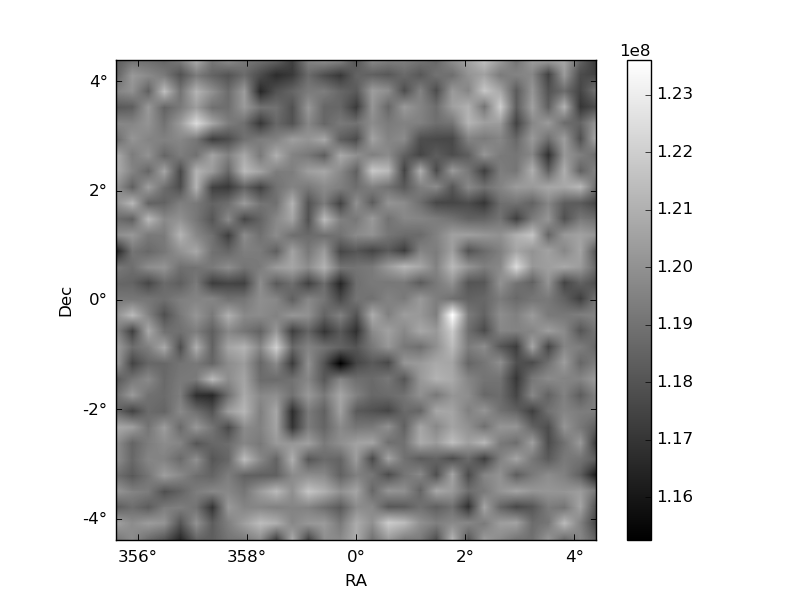
Quadrant B |
|---|---|---|---|
| Quadrant D | 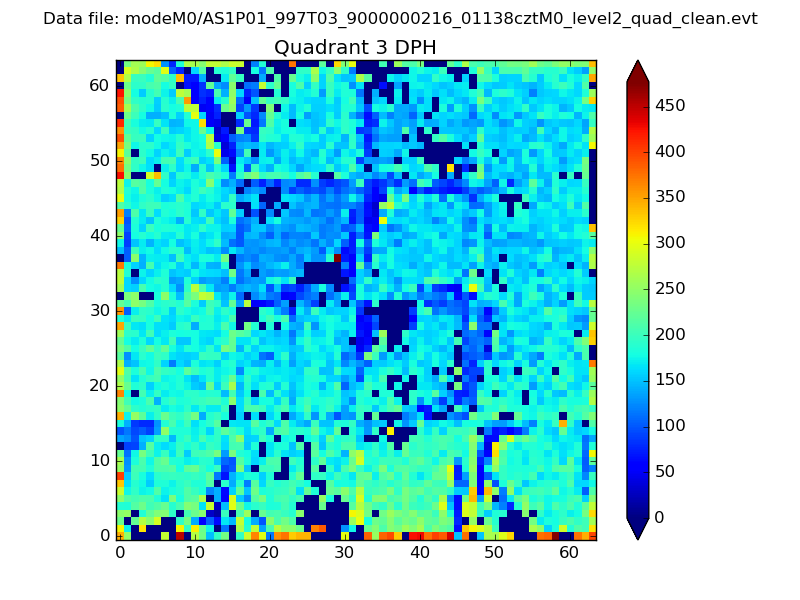 |
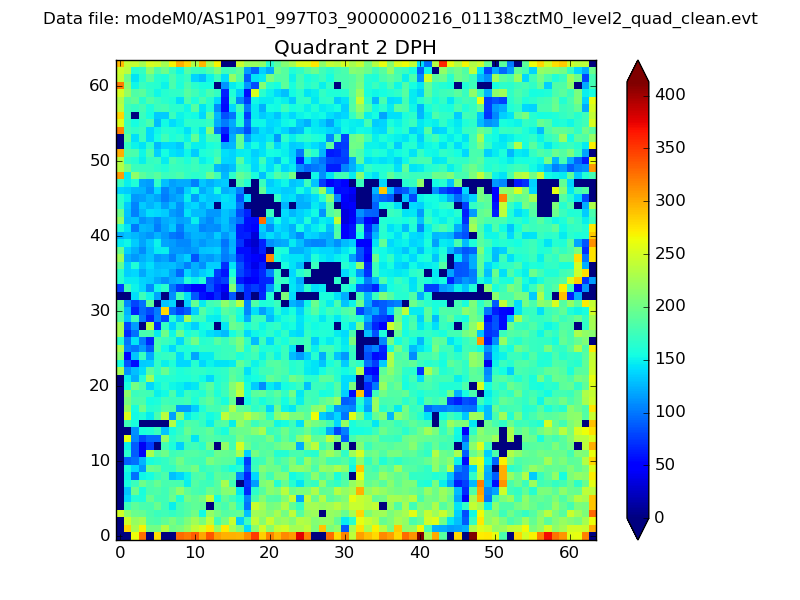 |
Quadrant C |
| Plot type | Count rate plots | Images |
|---|---|---|
| Comparison with Poisson distribution Blue bars denote a histogram of data divided into 1 sec bins. Red curve is a Poisson curve with rate = median count rate of data. |
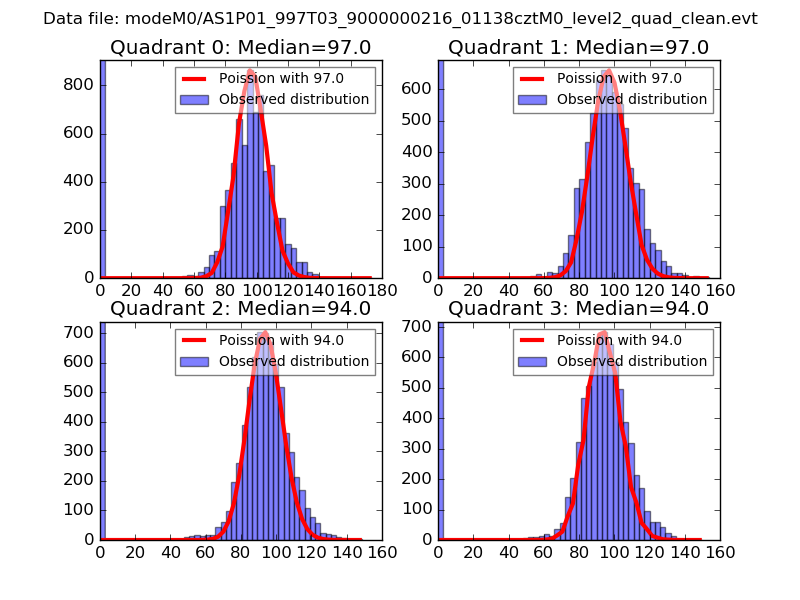 |
 |
| Quadrant-wise count rates Data is divided into 100 sec bins |
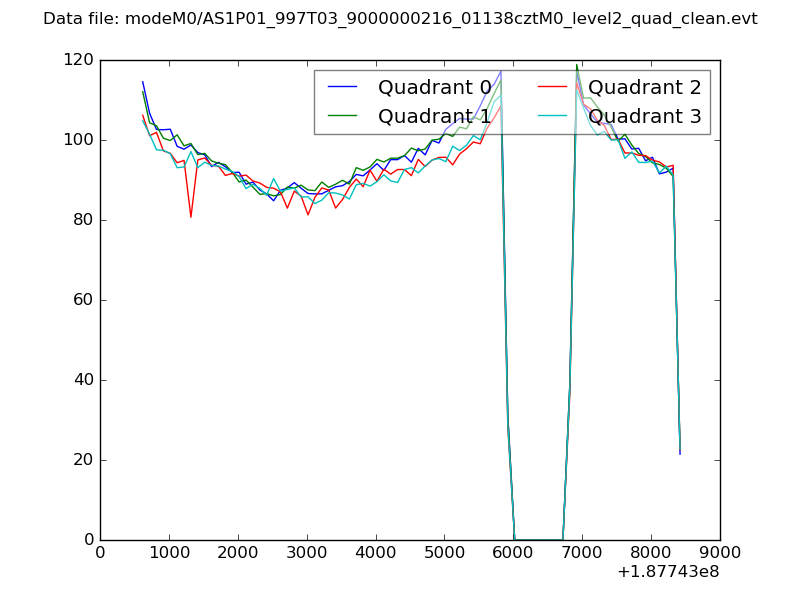 |
|
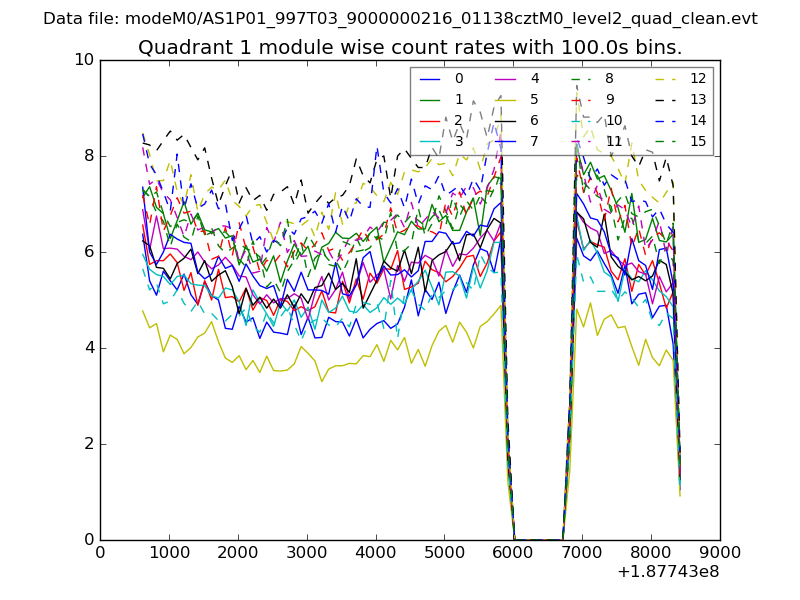
| Module-wise count rates for Quadrant A Data is divided into 100 sec bins |
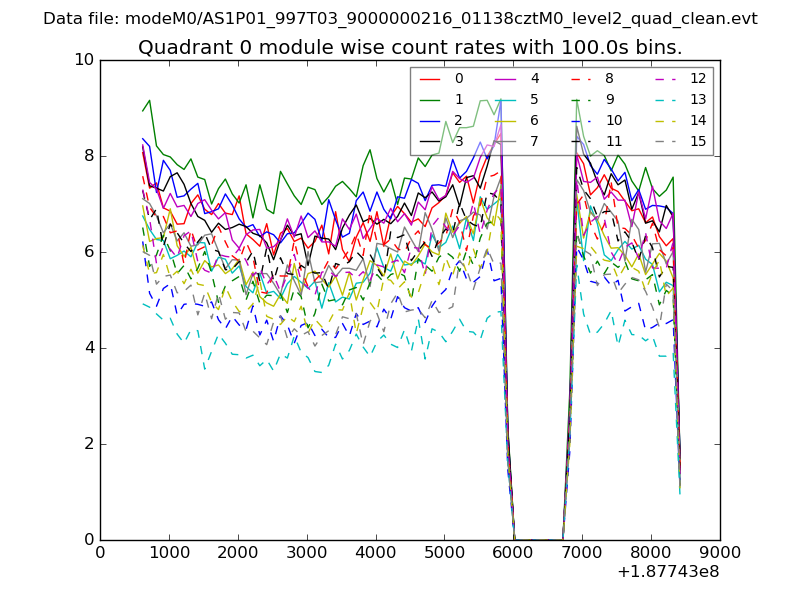 |
 |
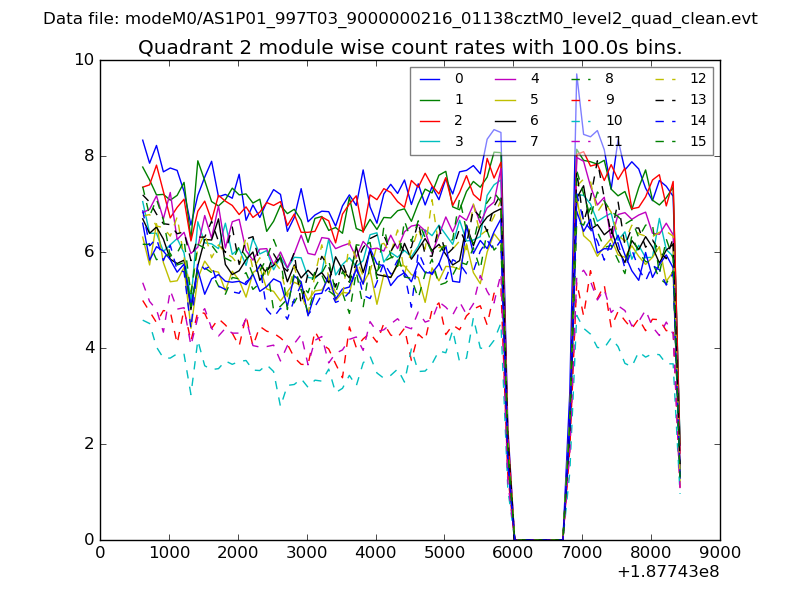
| Module-wise count rates for Quadrant B Data is divided into 100 sec bins |
 |
 |
| Module-wise count rates for Quadrant C Data is divided into 100 sec bins |
 |
 |
| Module-wise count rates for Quadrant D Data is divided into 100 sec bins |
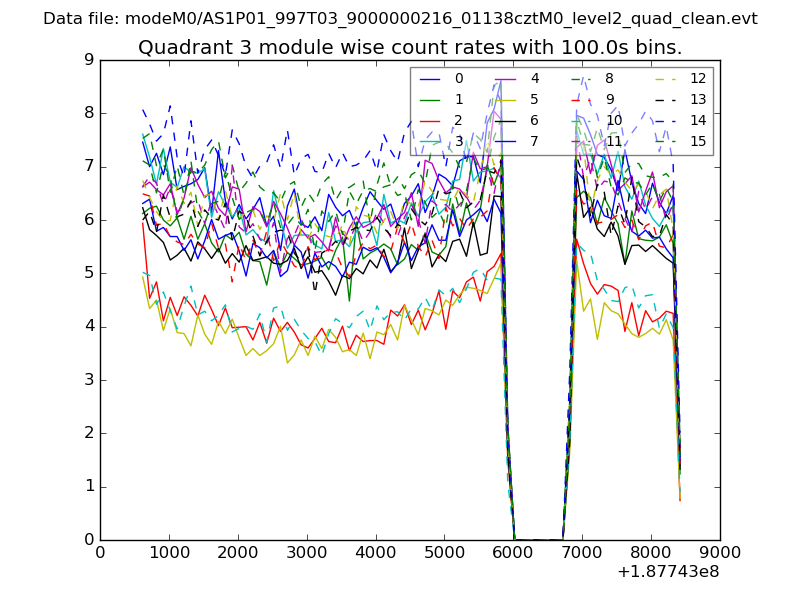 |
 |
| Parameter | Plot |
|---|---|
| CZT HV Monitor | 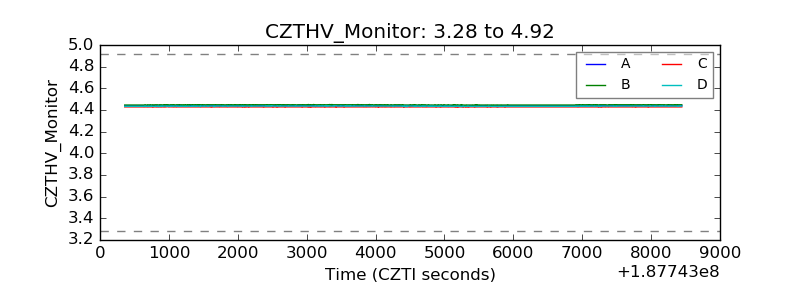 |
| D_VDD | 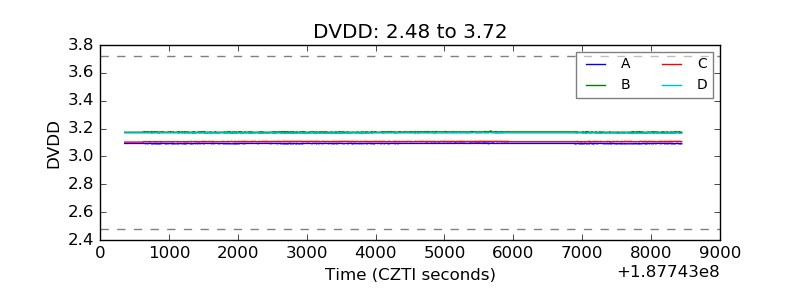 |
| Temperature 1 | 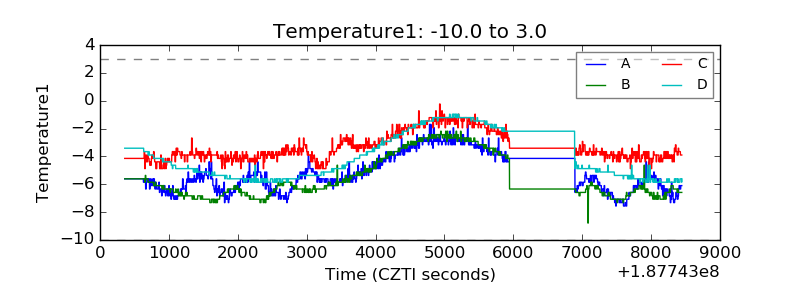 |
| Veto HV Monitor | 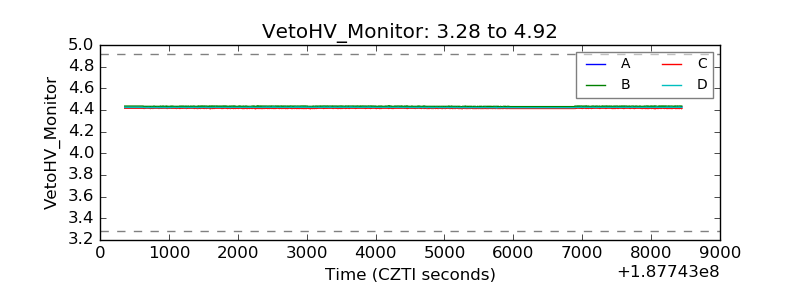 |
| Veto LLD | 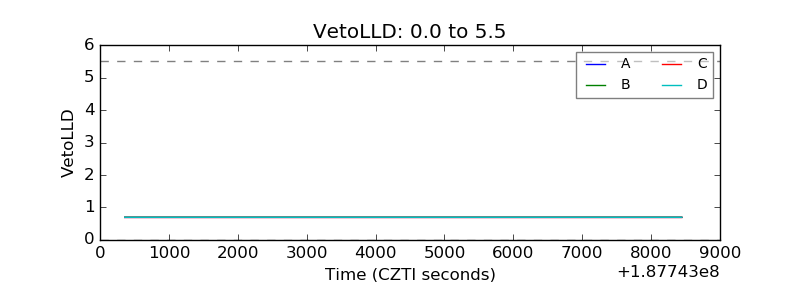 |
| Alpha Counter | 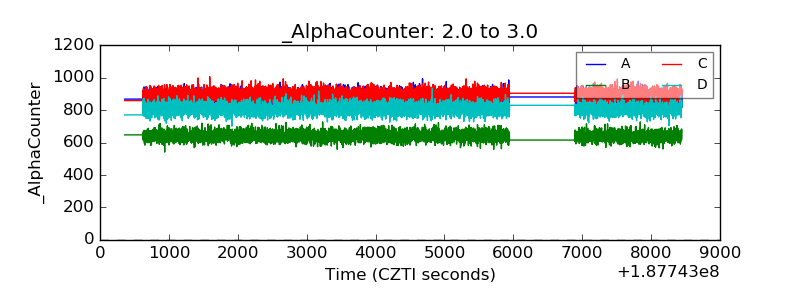 |
| _CPM_Rate | 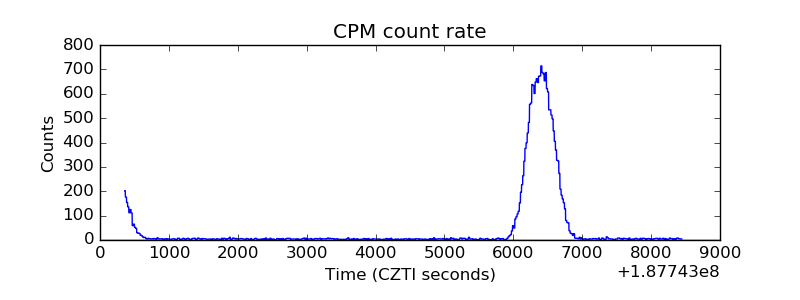 |
| CZT Counter | 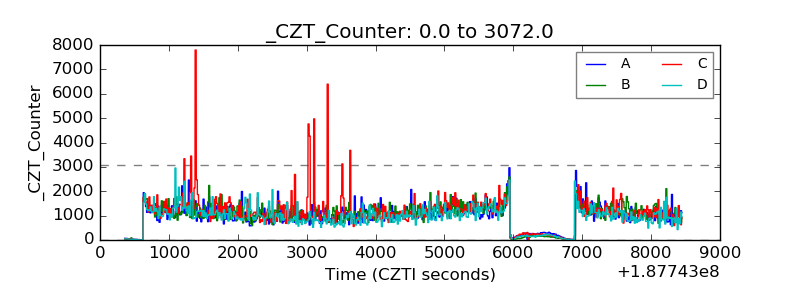 |
| +2.5 Volts monitor |  |
| +5 Volts monitor |  |
| _ROLL_ROT | 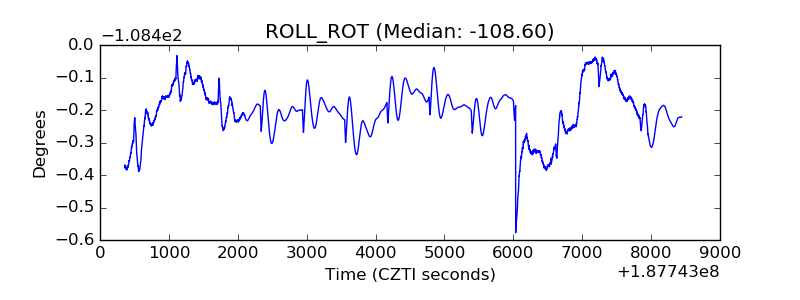 |
| _Roll_DEC | 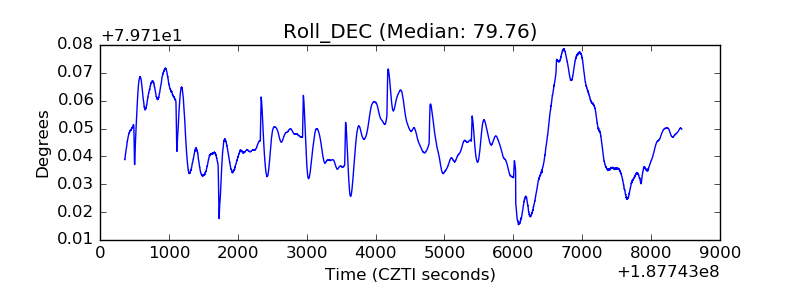 |
| _Roll_RA | 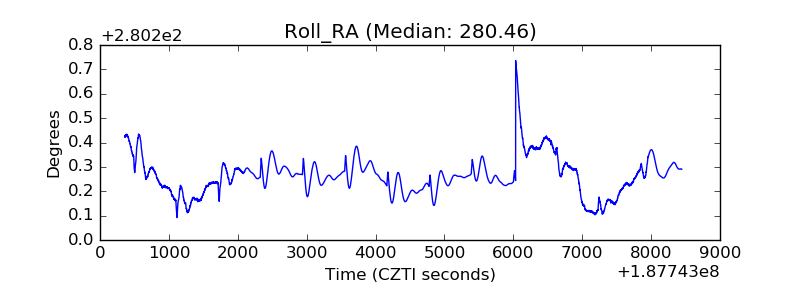 |
| Veto Counter | 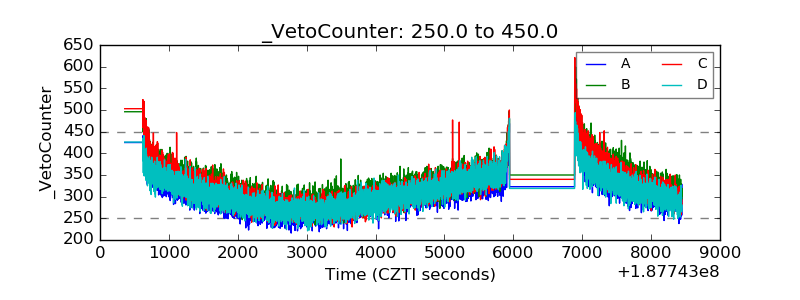 |