| Param | Original file | Final file |
|---|---|---|
| Filename | modeM0/AS1P01_997T03_9000000216_01140cztM0_level2.evt | modeM0/AS1P01_997T03_9000000216_01140cztM0_level2_quad_clean.evt |
| Size (bytes) | 1,032,514,560 | 102,251,520 |
| Size | 984.7 MB | 97.5 MB |
| Events in quadrant A | 7,794,209 | 667,324 |
| Events in quadrant B | 8,243,791 | 670,159 |
| Events in quadrant C | 7,927,551 | 652,411 |
| Events in quadrant D | 6,861,300 | 641,847 |
| Mode M0 | |||
|---|---|---|---|
| Quadrant | BADHDUFLAG | Total packets | Discarded packets |
| A | 0 | 27927 | 3 |
| B | 0 | 29258 | 2 |
| C | 0 | 28347 | 2 |
| D | 0 | 25171 | 2 |
| Mode SS | |||
|---|---|---|---|
| Quadrant | BADHDUFLAG | Total packets | Discarded packets |
| A | 0 | 134 | 0 |
| B | 0 | 134 | 0 |
| C | 0 | 134 | 0 |
| D | 0 | 134 | 0 |
| Mode M9 | |||
|---|---|---|---|
| Quadrant | BADHDUFLAG | Total packets | Discarded packets |
| A | 0 | 16 | 0 |
| B | 0 | 16 | 0 |
| C | 0 | 16 | 0 |
| D | 0 | 17 | 0 |
| Quadrant | Total seconds | Saturated seconds | Saturation percentage |
|---|---|---|---|
| A | 6675 | 7 | 0.104869% |
| B | 6675 | 22 | 0.329588% |
| C | 6675 | 10 | 0.149813% |
| D | 6675 | 8 | 0.119850% |
Noise dominated data is calculated using 1-second bins in cleaned event files. If a bin has >2000 counts, and if more than 50% of those come from <1% of pixels, then it is considered to be noise-dominated and hence unusable.
| Quadrant | # 1 sec bins | Bins with >0 counts | Bins with >2000 counts | High rate bins dominated by noise | Noise dominated (total time) | Noise dominated (detector-on time) | Marked lightcurve |
|---|---|---|---|---|---|---|---|
| A | 7740 | 6676 | 159 | 159 | 2.05% | 2.38% | 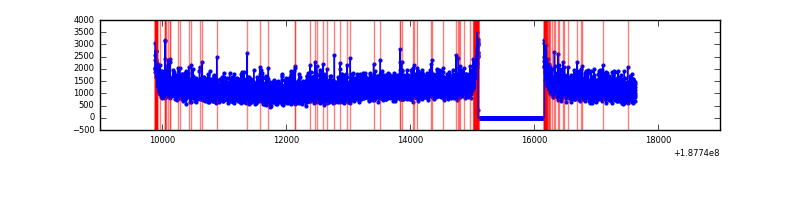 |
| B | 7740 | 6675 | 228 | 228 | 2.95% | 3.42% | 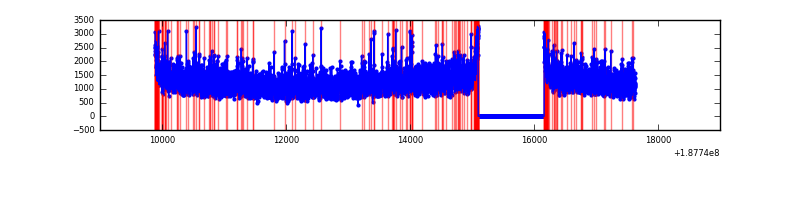 |
| C | 7740 | 6676 | 169 | 169 | 2.18% | 2.53% | 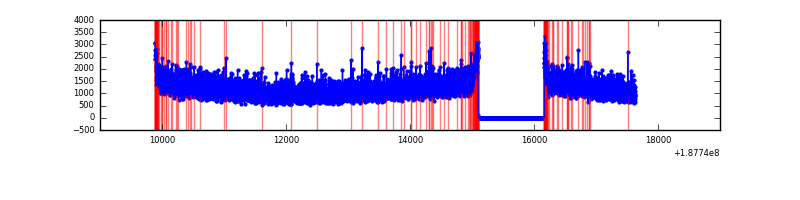 |
| D | 7740 | 6676 | 89 | 89 | 1.15% | 1.33% | 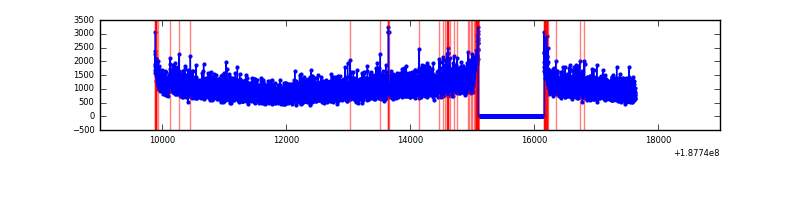 |
Top three noisy pixels from each quadrant. If the there are fewer than three noisy pixels in the level2.evt file, extra rows are filled as -1
| Pixel properties | Quadrant properties | ||||||
|---|---|---|---|---|---|---|---|
| Quadrant | DetID | PixID | Counts | Sigma | Mean | Median | Sigma |
| A | 0 | 175 | 14847 | 26.38 | 2021 | 2034 | 485.7 |
| A | 15 | 127 | 13430 | 23.46 | 2021 | 2034 | 485.7 |
| A | 12 | 243 | 13354 | 23.3 | 2021 | 2034 | 485.7 |
| B | 0 | 220 | 56561 | 108.63 | 2126 | 2135 | 501.0 |
| B | 15 | 22 | 55769 | 107.05 | 2126 | 2135 | 501.0 |
| B | 5 | 249 | 25472 | 46.58 | 2126 | 2135 | 501.0 |
| C | 15 | 241 | 312762 | 582.33 | 1917 | 1986 | 533.7 |
| C | 12 | 206 | 38964 | 69.29 | 1917 | 1986 | 533.7 |
| C | 9 | 52 | 28123 | 48.97 | 1917 | 1986 | 533.7 |
| D | 13 | 73 | 19375 | 30.84 | 1822 | 1890 | 566.9 |
| D | 2 | 63 | 19337 | 30.78 | 1822 | 1890 | 566.9 |
| D | 9 | 53 | 15840 | 24.61 | 1822 | 1890 | 566.9 |
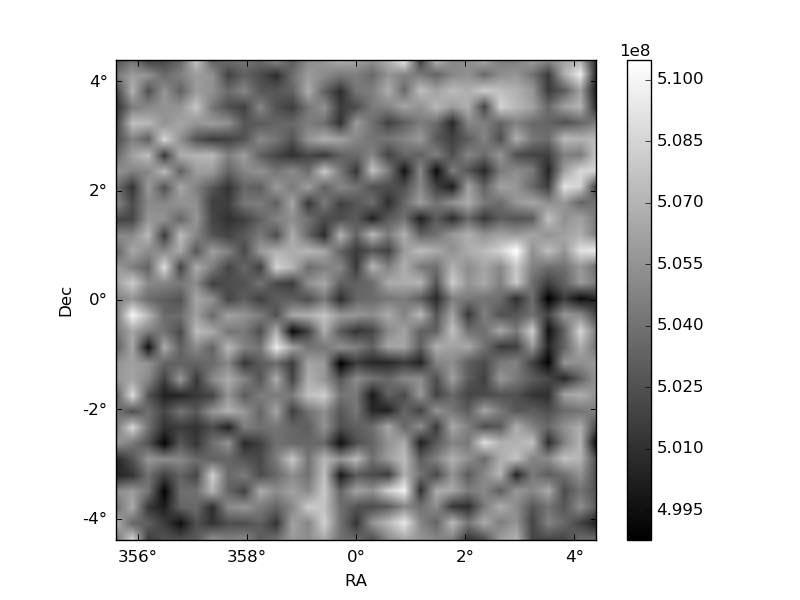
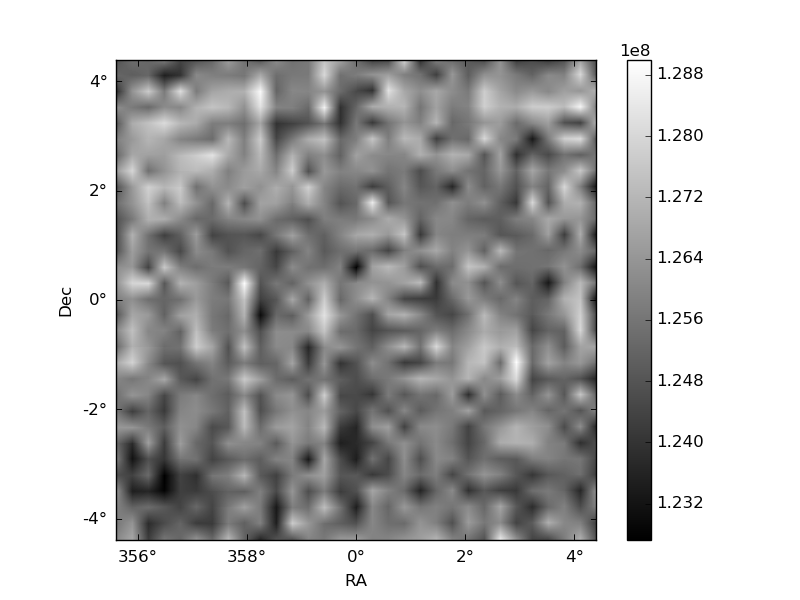
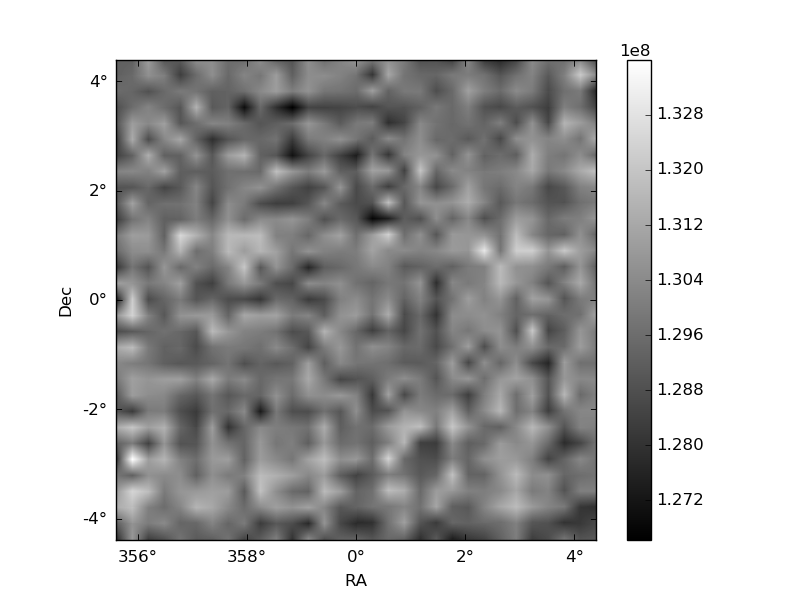
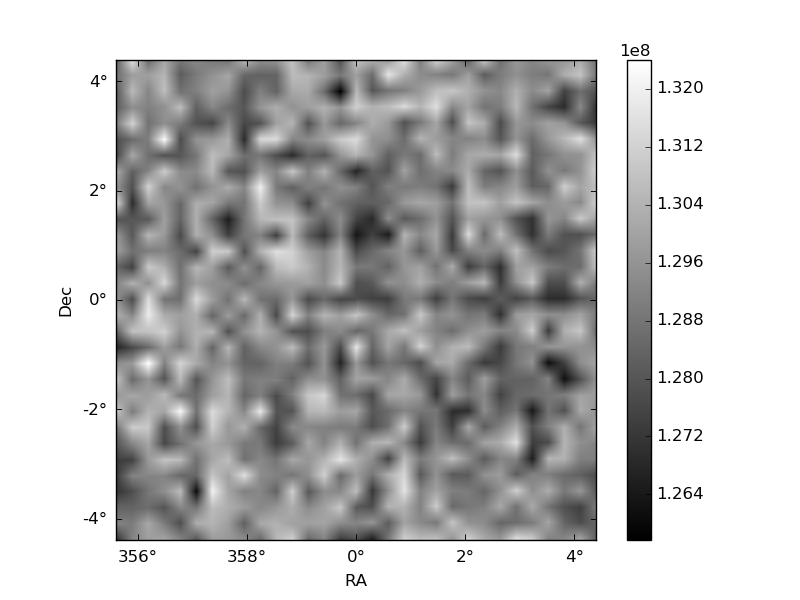
Histogram calculated using DETX and DETY for each event in the final _common_clean file
| Quadrant A | 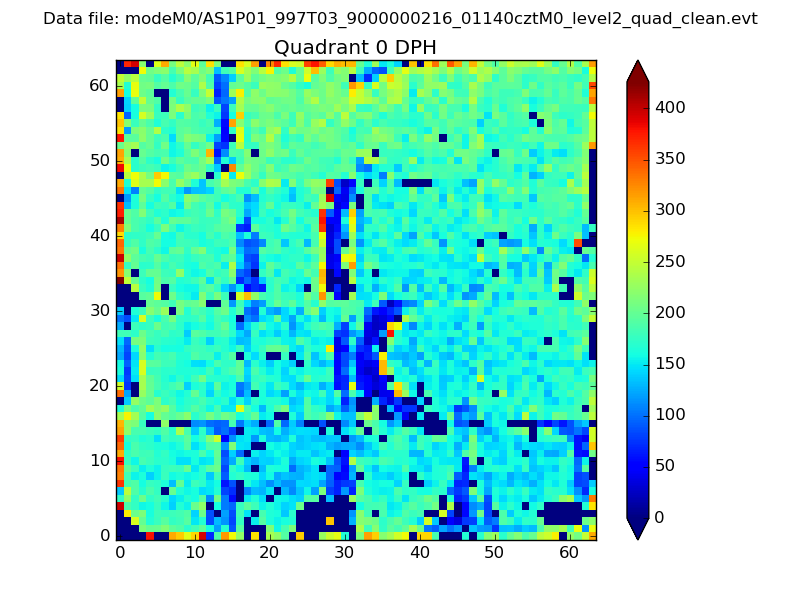 |
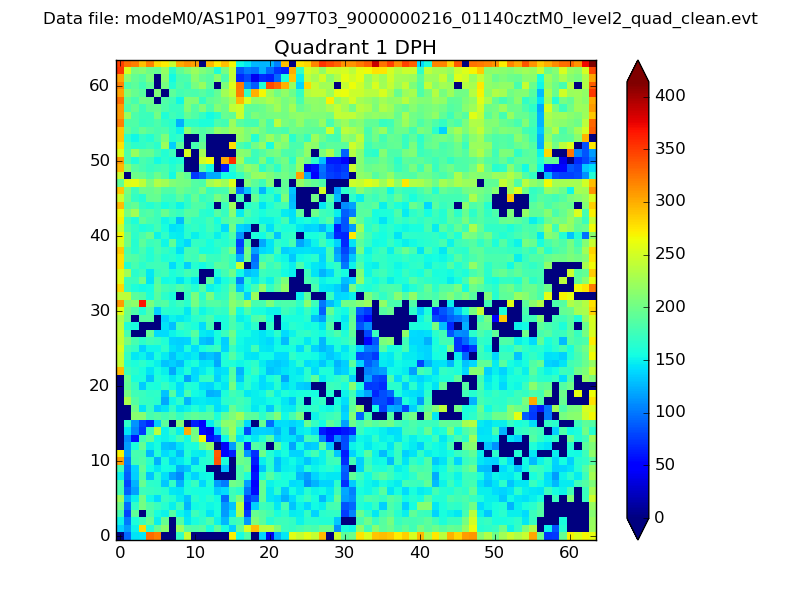 |
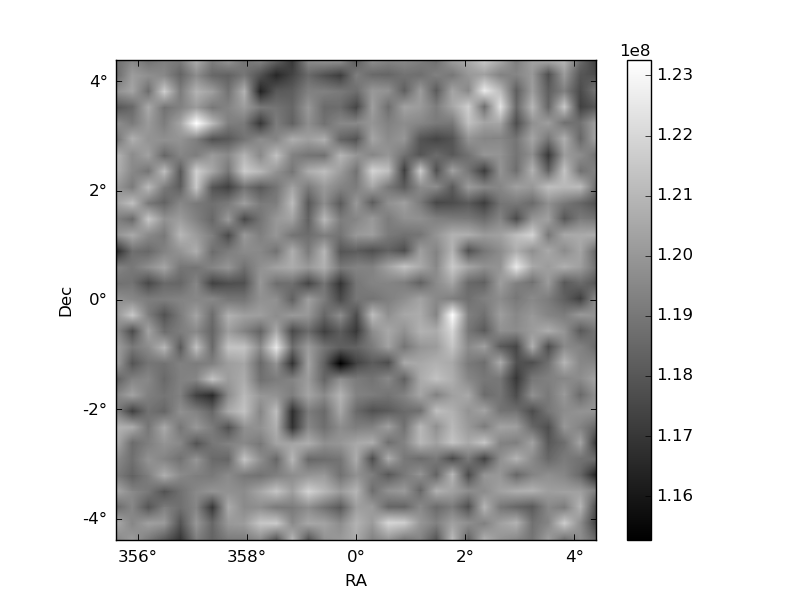
Quadrant B |
|---|---|---|---|
| Quadrant D | 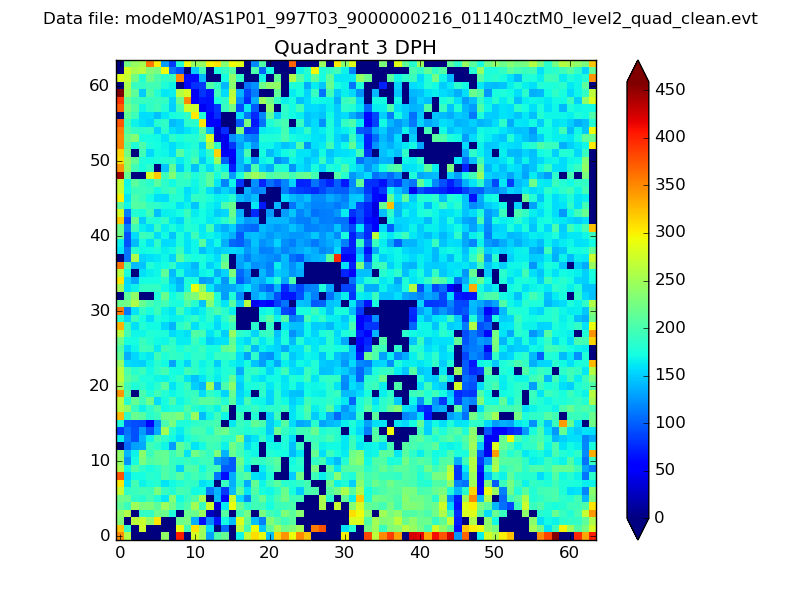 |
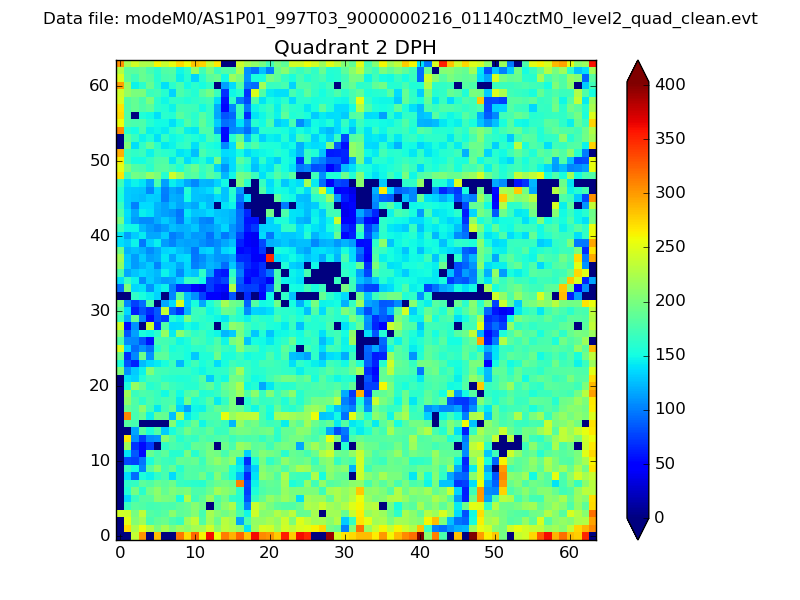 |
Quadrant C |
| Plot type | Count rate plots | Images |
|---|---|---|
| Comparison with Poisson distribution Blue bars denote a histogram of data divided into 1 sec bins. Red curve is a Poisson curve with rate = median count rate of data. |
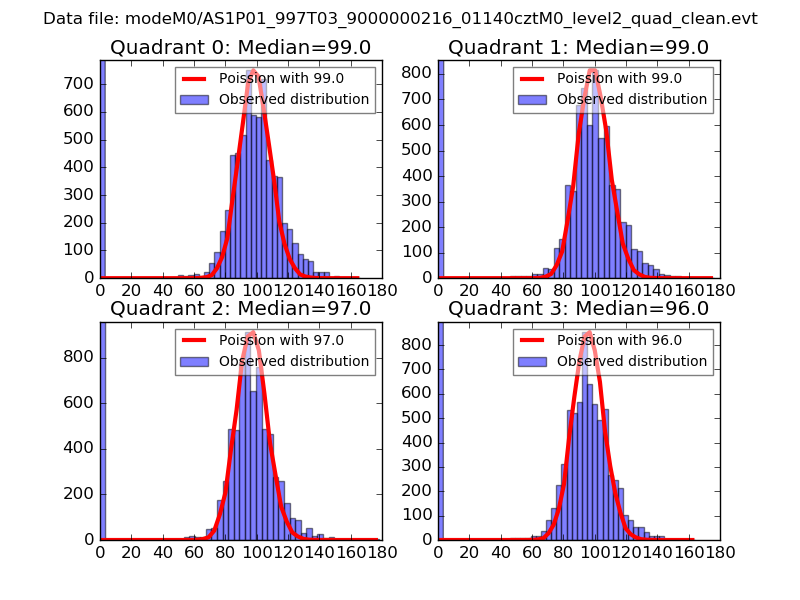 |
 |
| Quadrant-wise count rates Data is divided into 100 sec bins |
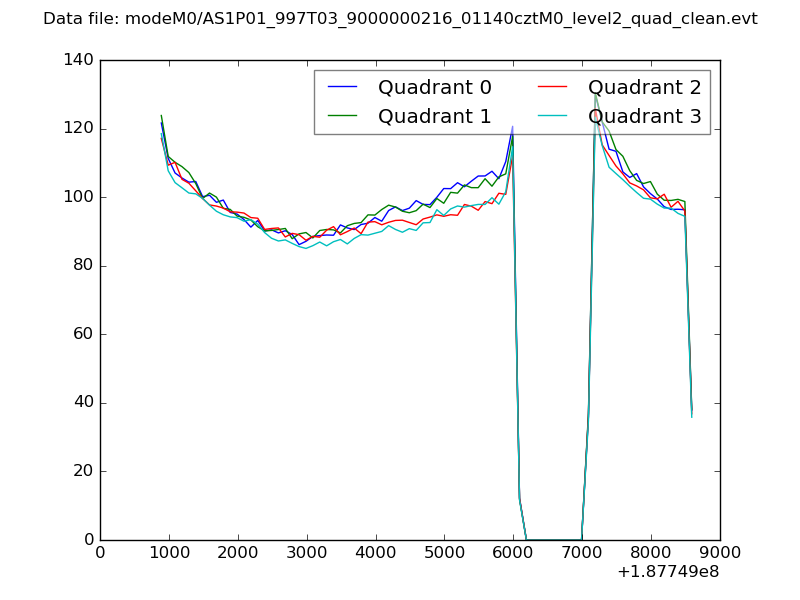 |
|
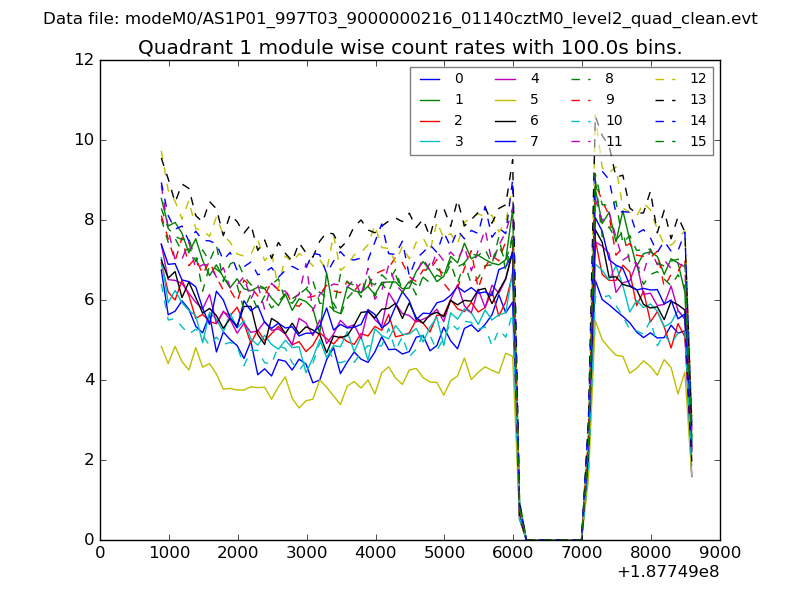
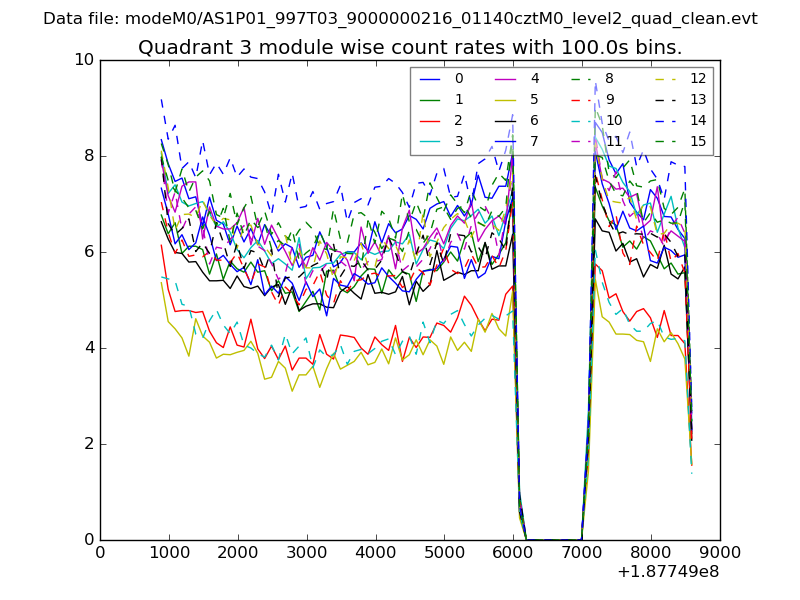
| Module-wise count rates for Quadrant A Data is divided into 100 sec bins |
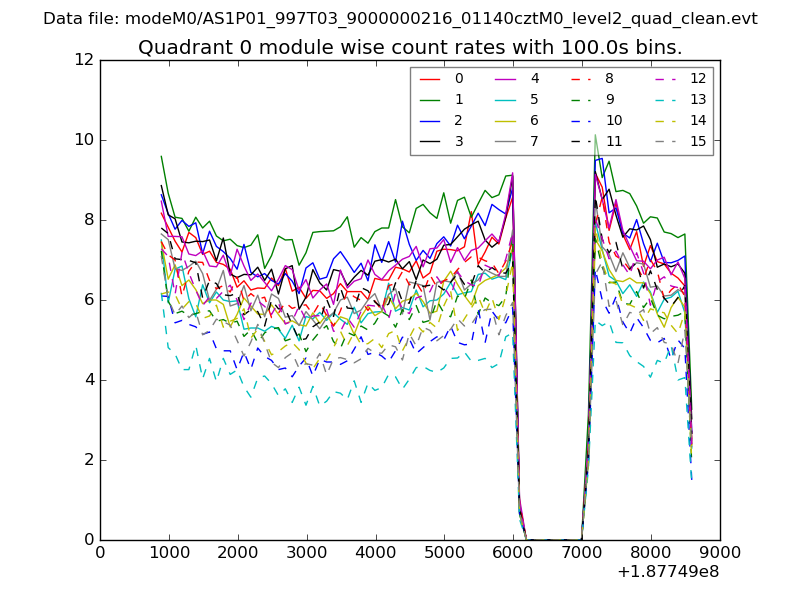 |
 |
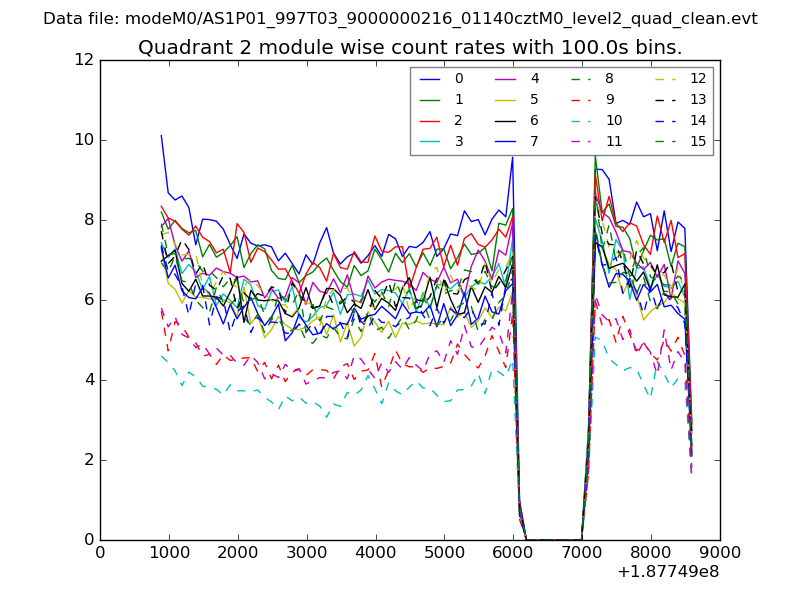
| Module-wise count rates for Quadrant B Data is divided into 100 sec bins |
 |
 |
| Module-wise count rates for Quadrant C Data is divided into 100 sec bins |
 |
 |
| Module-wise count rates for Quadrant D Data is divided into 100 sec bins |
 |
 |
| Parameter | Plot |
|---|---|
| CZT HV Monitor | 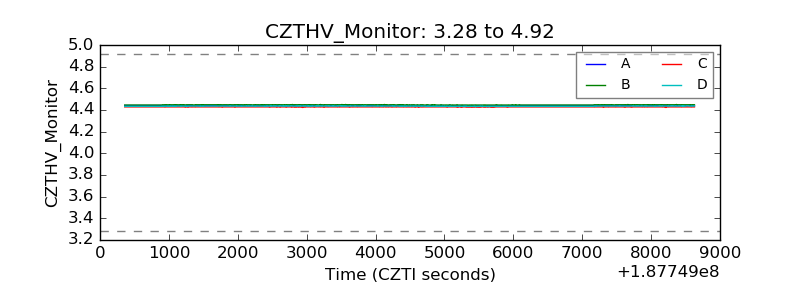 |
| D_VDD | 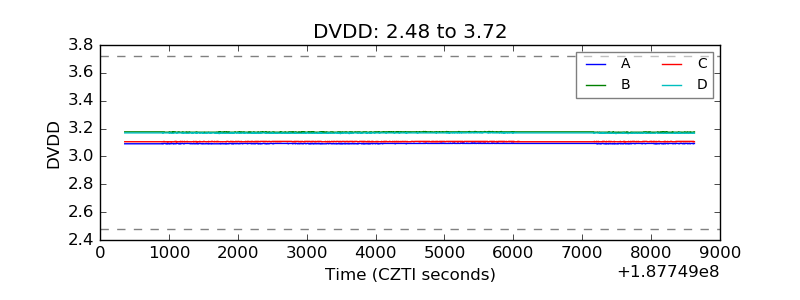 |
| Temperature 1 | 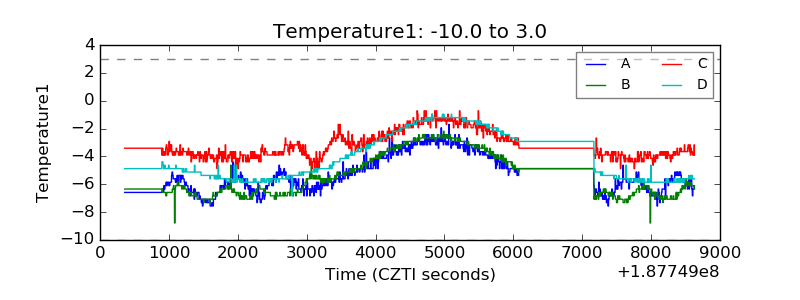 |
| Veto HV Monitor | 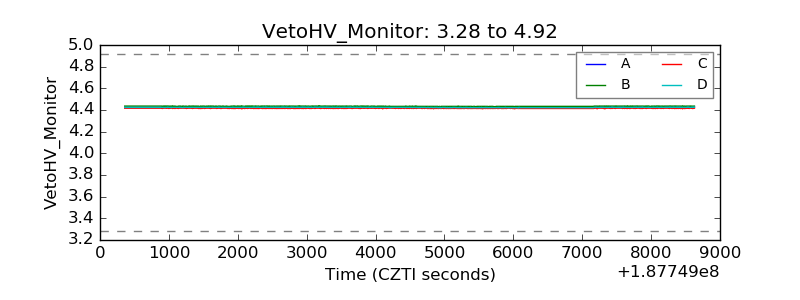 |
| Veto LLD | 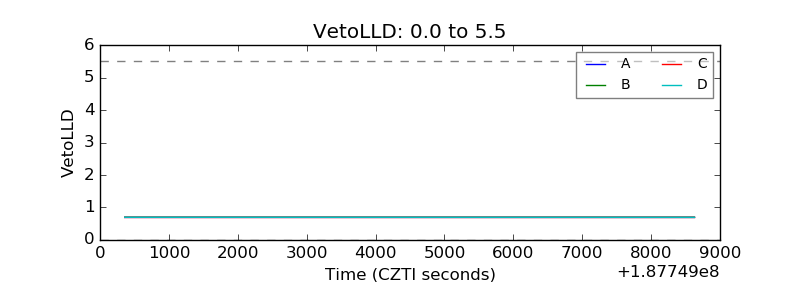 |
| Alpha Counter | 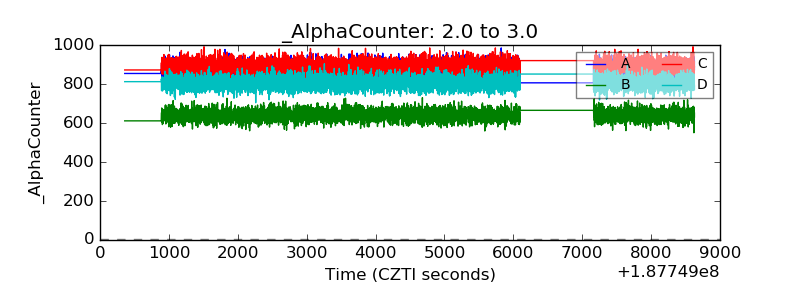 |
| _CPM_Rate | 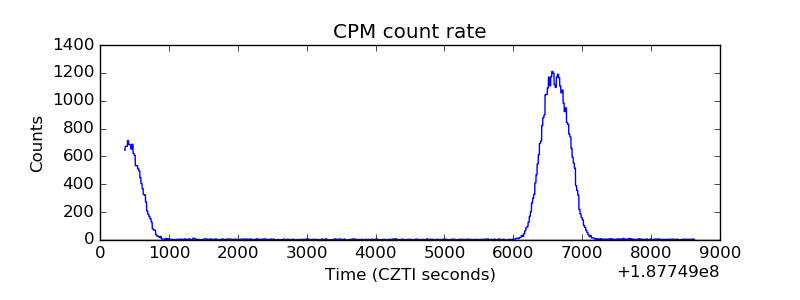 |
| CZT Counter | 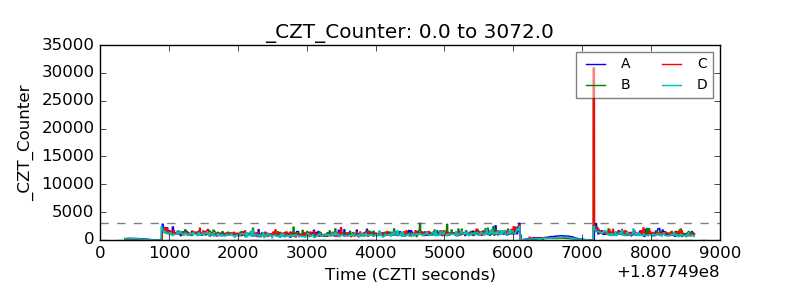 |
| +2.5 Volts monitor |  |
| +5 Volts monitor |  |
| _ROLL_ROT | 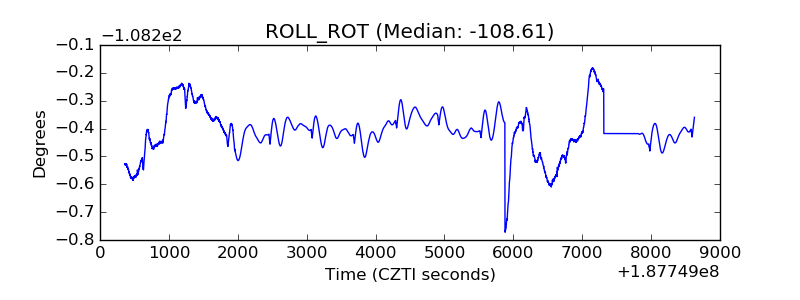 |
| _Roll_DEC | 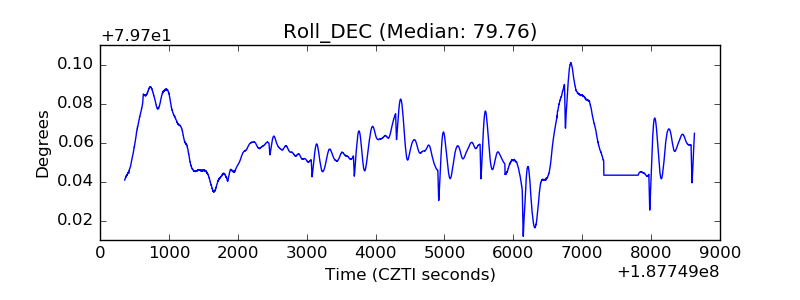 |
| _Roll_RA | 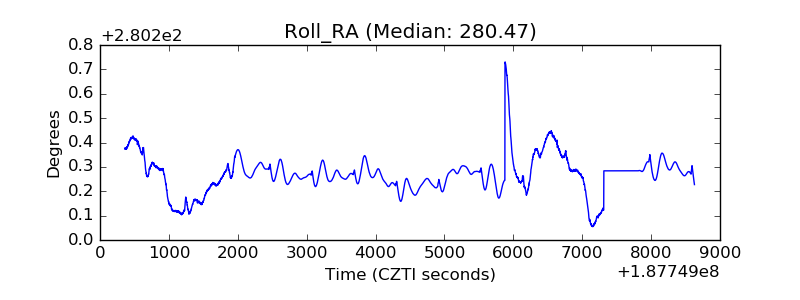 |
| Veto Counter | 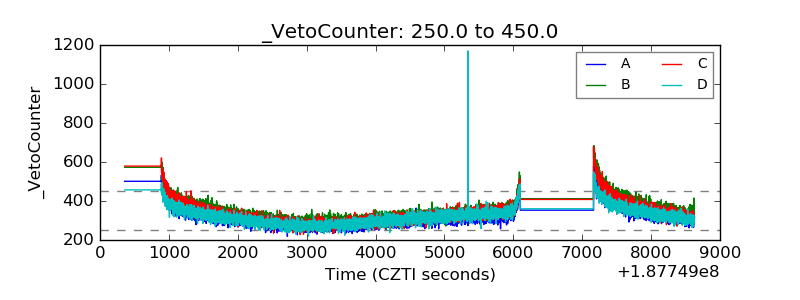 |