| Param | Original file | Final file |
|---|---|---|
| Filename | modeM0/AS1P01_997T03_9000000216_01141cztM0_level2.evt | modeM0/AS1P01_997T03_9000000216_01141cztM0_level2_quad_clean.evt |
| Size (bytes) | 409,645,440 | 42,949,440 |
| Size | 390.7 MB | 41.0 MB |
| Events in quadrant A | 3,207,449 | 274,759 |
| Events in quadrant B | 3,256,132 | 281,779 |
| Events in quadrant C | 3,005,824 | 272,427 |
| Events in quadrant D | 2,741,528 | 264,595 |
| Mode M0 | |||
|---|---|---|---|
| Quadrant | BADHDUFLAG | Total packets | Discarded packets |
| A | 0 | 11596 | 0 |
| B | 0 | 11717 | 0 |
| C | 0 | 10988 | 0 |
| D | 0 | 10226 | 0 |
| Mode SS | |||
|---|---|---|---|
| Quadrant | BADHDUFLAG | Total packets | Discarded packets |
| A | 0 | 58 | 0 |
| B | 0 | 58 | 0 |
| C | 0 | 58 | 0 |
| D | 0 | 58 | 0 |
| Quadrant | Total seconds | Saturated seconds | Saturation percentage |
|---|---|---|---|
| A | 2895 | 0 | 0.000000% |
| B | 2895 | 0 | 0.000000% |
| C | 2895 | 0 | 0.000000% |
| D | 2895 | 0 | 0.000000% |
Noise dominated data is calculated using 1-second bins in cleaned event files. If a bin has >2000 counts, and if more than 50% of those come from <1% of pixels, then it is considered to be noise-dominated and hence unusable.
| Quadrant | # 1 sec bins | Bins with >0 counts | Bins with >2000 counts | High rate bins dominated by noise | Noise dominated (total time) | Noise dominated (detector-on time) | Marked lightcurve |
|---|---|---|---|---|---|---|---|
| A | 2895 | 2895 | 17 | 17 | 0.59% | 0.59% | 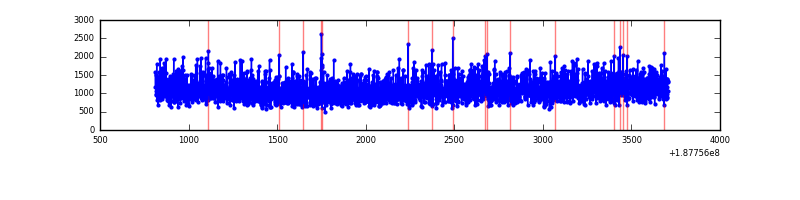 |
| B | 2895 | 2895 | 20 | 20 | 0.69% | 0.69% | 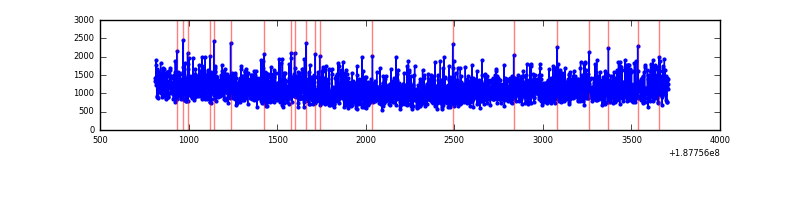 |
| C | 2895 | 2895 | 10 | 10 | 0.35% | 0.35% | 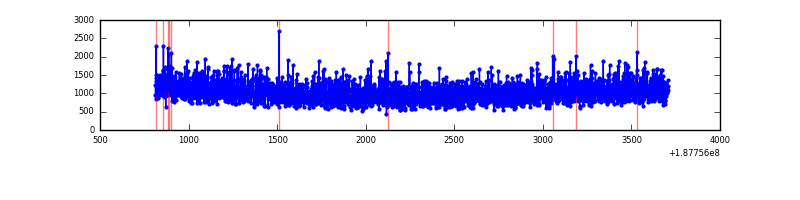 |
| D | 2895 | 2895 | 4 | 4 | 0.14% | 0.14% | 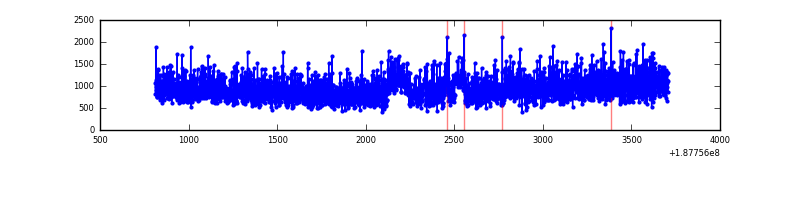 |
Top three noisy pixels from each quadrant. If the there are fewer than three noisy pixels in the level2.evt file, extra rows are filled as -1
| Pixel properties | Quadrant properties | ||||||
|---|---|---|---|---|---|---|---|
| Quadrant | DetID | PixID | Counts | Sigma | Mean | Median | Sigma |
| A | 15 | 127 | 85807 | 435.52 | 812 | 819 | 195.1 |
| A | 12 | 243 | 6196 | 27.55 | 812 | 819 | 195.1 |
| A | 11 | 79 | 4554 | 19.14 | 812 | 819 | 195.1 |
| B | 0 | 220 | 26381 | 129.1 | 835 | 843 | 197.8 |
| B | 4 | 187 | 20483 | 99.29 | 835 | 843 | 197.8 |
| B | 8 | 38 | 15303 | 73.1 | 835 | 843 | 197.8 |
| C | 15 | 241 | 131160 | 646.68 | 725 | 748 | 201.7 |
| C | 9 | 83 | 9668 | 44.23 | 725 | 748 | 201.7 |
| C | 12 | 206 | 9598 | 43.88 | 725 | 748 | 201.7 |
| D | 2 | 16 | 86945 | 390.95 | 708 | 732 | 220.5 |
| D | 10 | 154 | 4047 | 15.03 | 708 | 732 | 220.5 |
| D | 13 | 252 | 3540 | 12.73 | 708 | 732 | 220.5 |
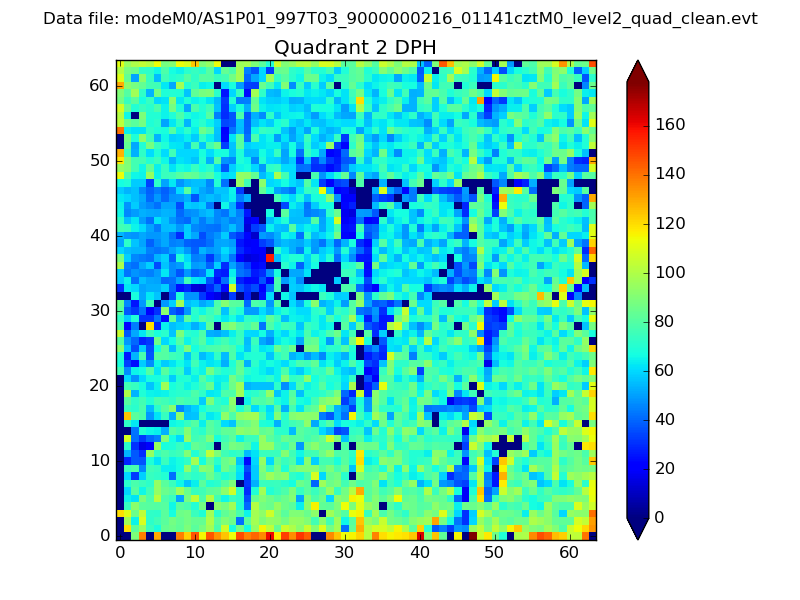
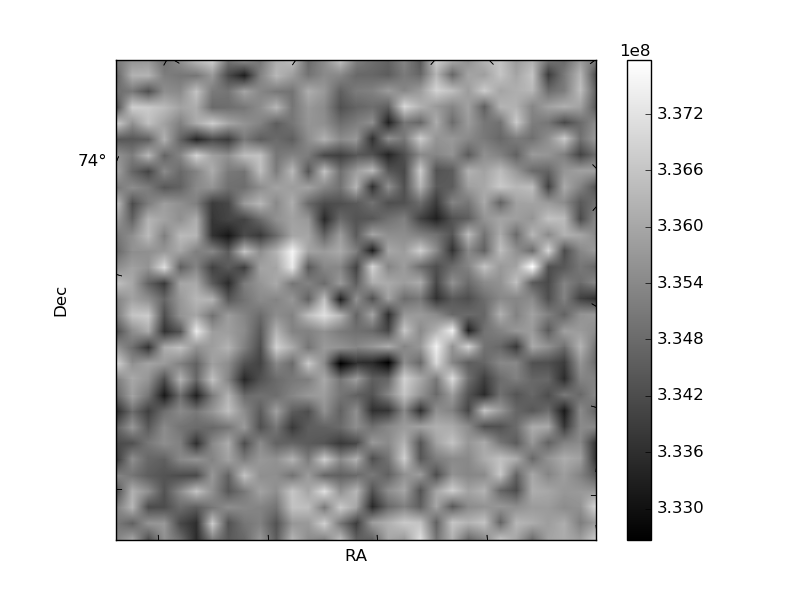
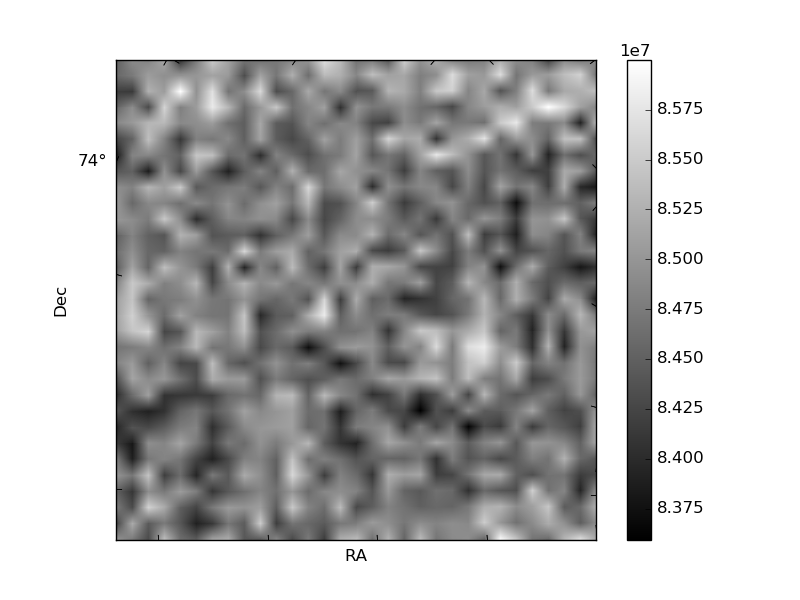
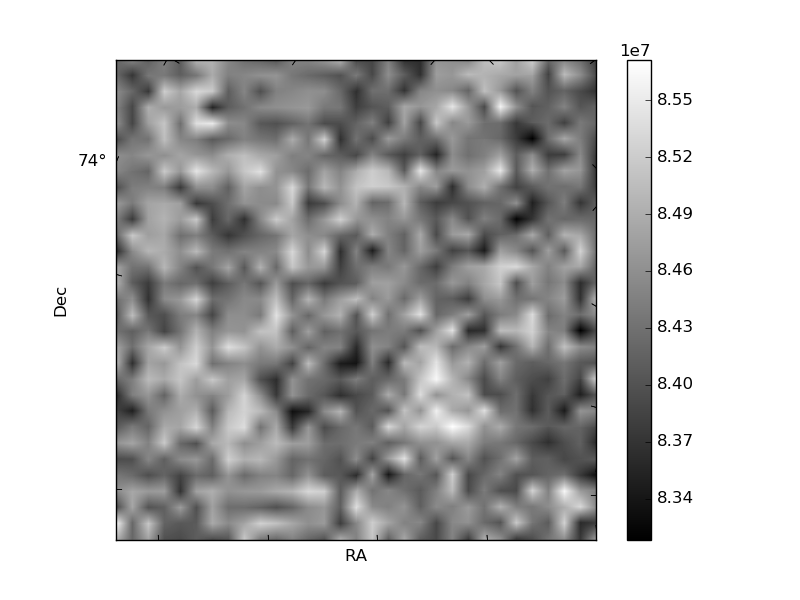
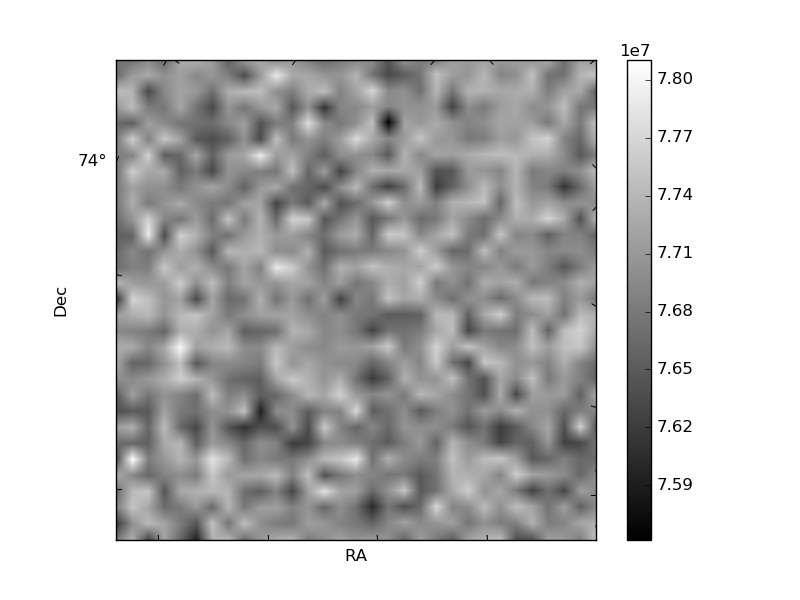
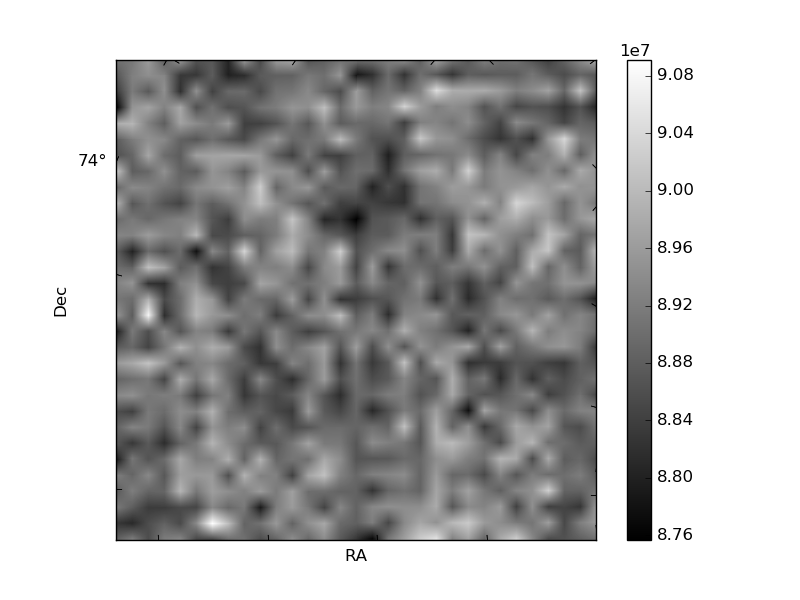
Histogram calculated using DETX and DETY for each event in the final _common_clean file
| Quadrant A | 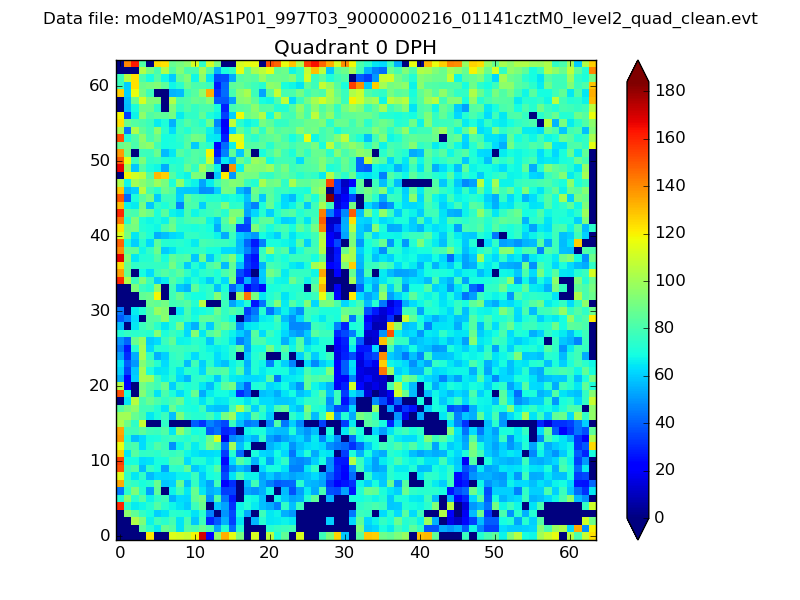 |
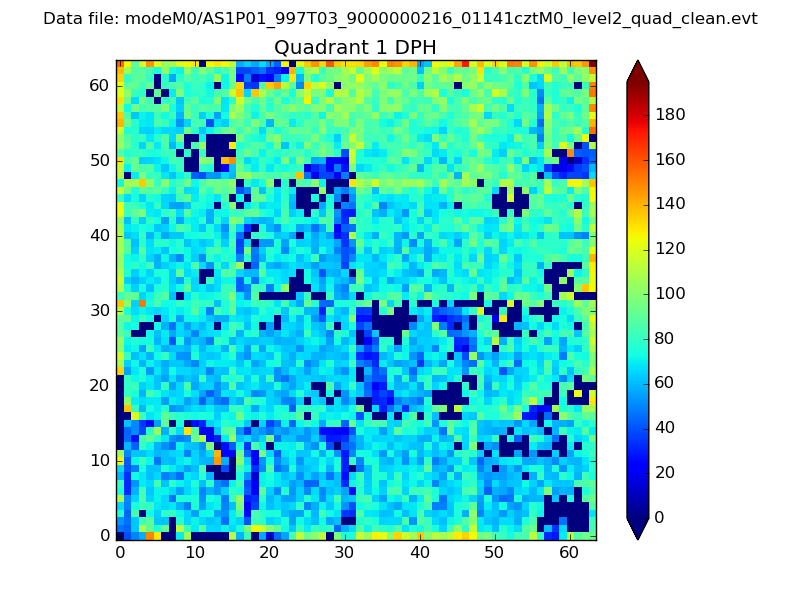 |
Quadrant B |
|---|---|---|---|
| Quadrant D | 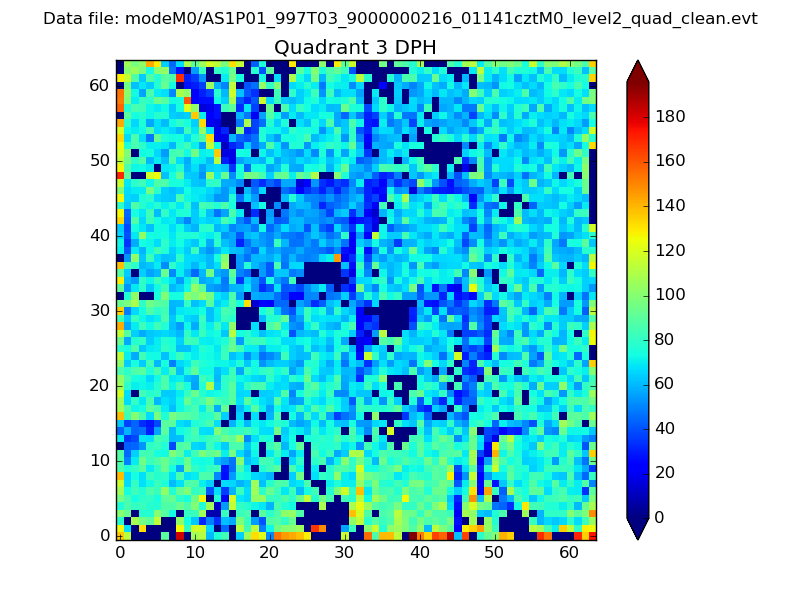 |
 |
Quadrant C |
| Plot type | Count rate plots | Images |
|---|---|---|
| Comparison with Poisson distribution Blue bars denote a histogram of data divided into 1 sec bins. Red curve is a Poisson curve with rate = median count rate of data. |
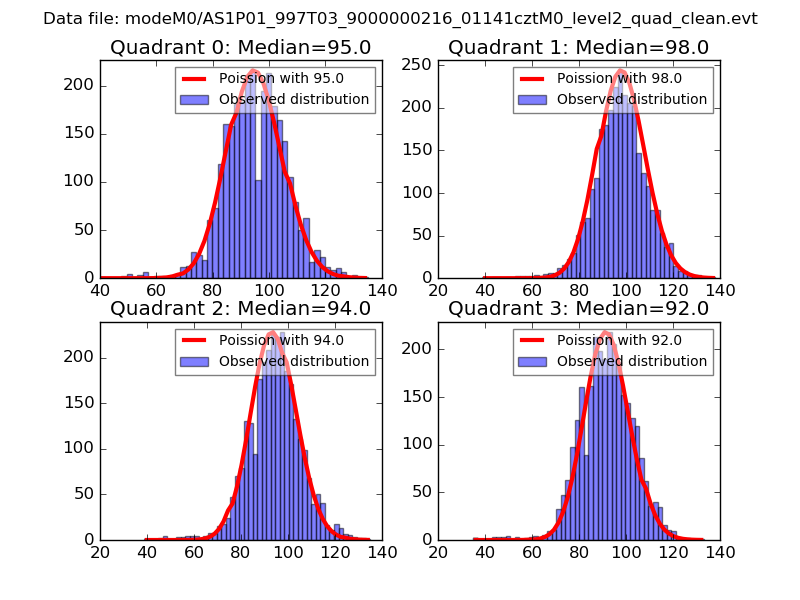 |
 |
| Quadrant-wise count rates Data is divided into 100 sec bins |
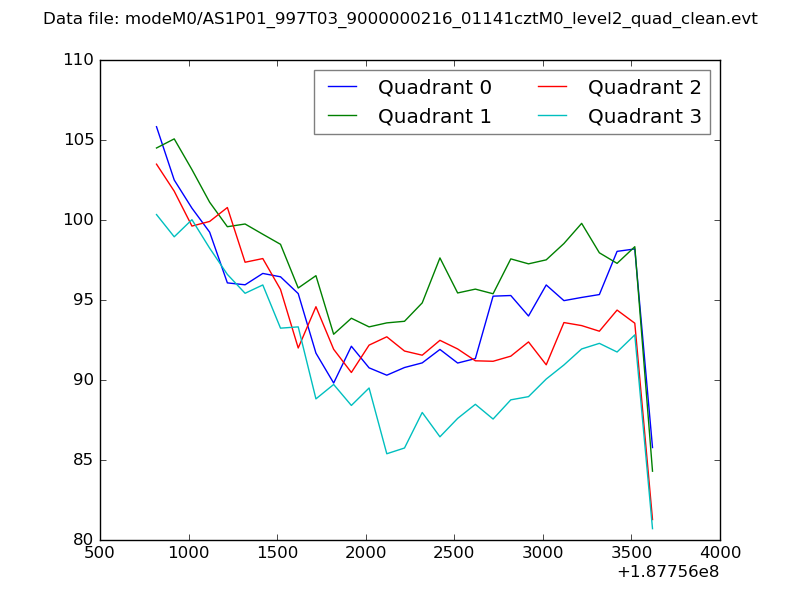 |
|
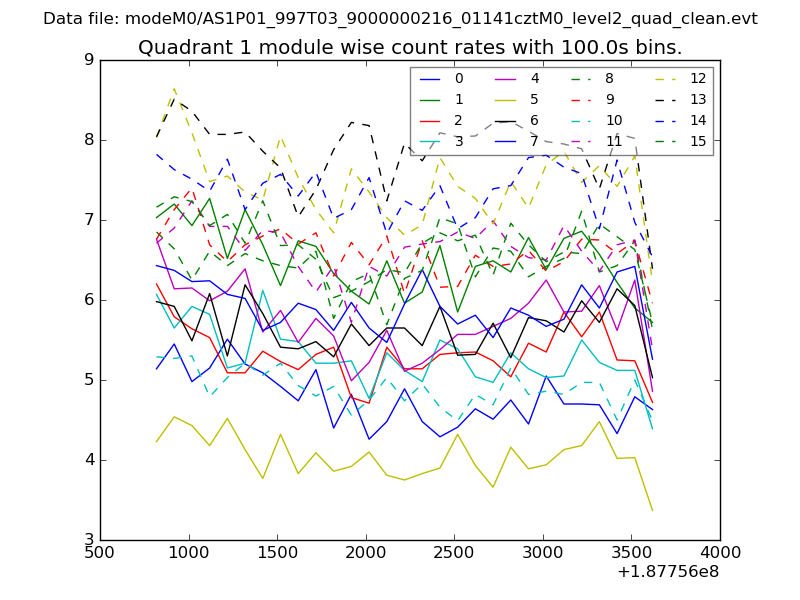
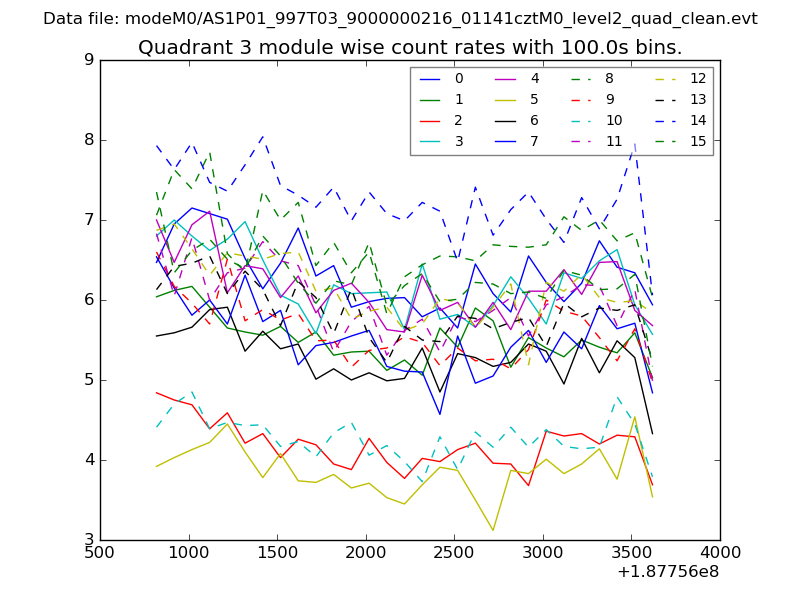
| Module-wise count rates for Quadrant A Data is divided into 100 sec bins |
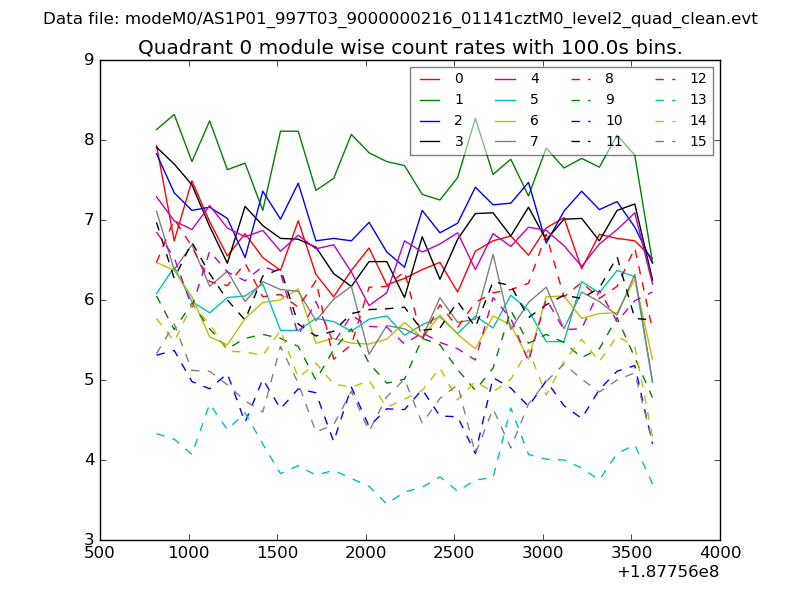 |
 |
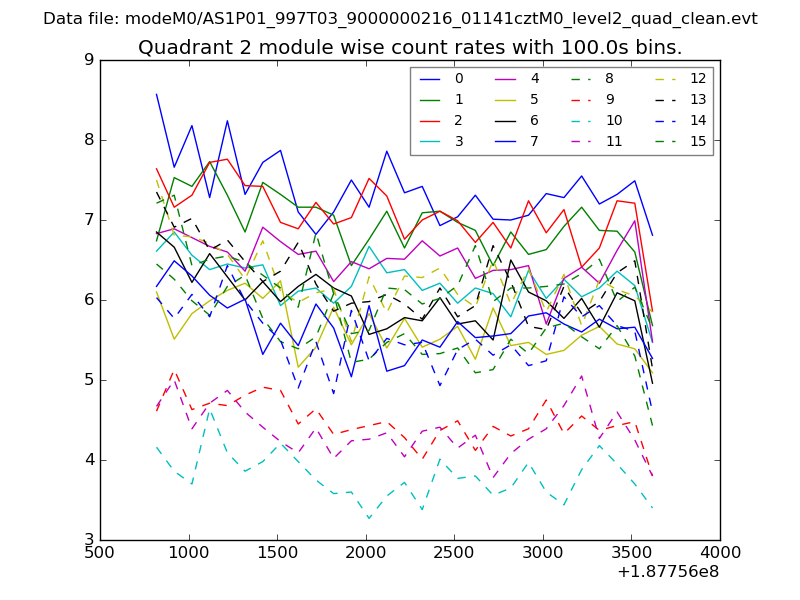
| Module-wise count rates for Quadrant B Data is divided into 100 sec bins |
 |
 |
| Module-wise count rates for Quadrant C Data is divided into 100 sec bins |
 |
 |
| Module-wise count rates for Quadrant D Data is divided into 100 sec bins |
 |
 |
| Parameter | Plot |
|---|---|
| CZT HV Monitor | 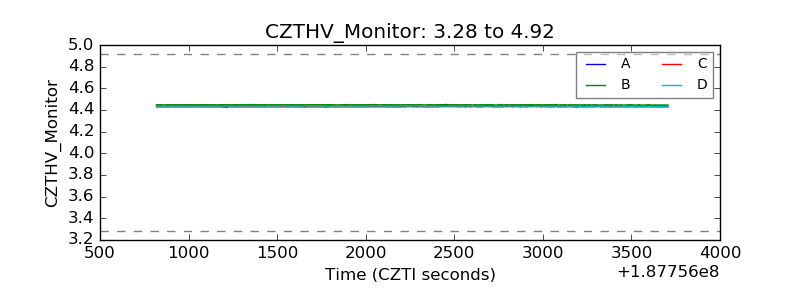 |
| D_VDD |  |
| Temperature 1 | 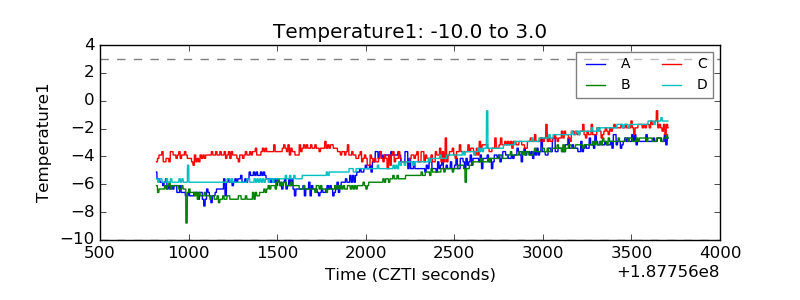 |
| Veto HV Monitor | 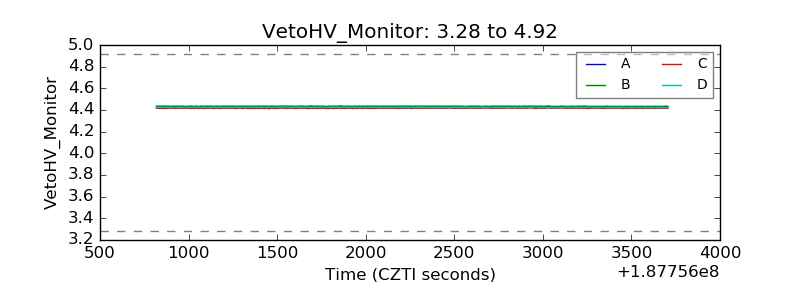 |
| Veto LLD | 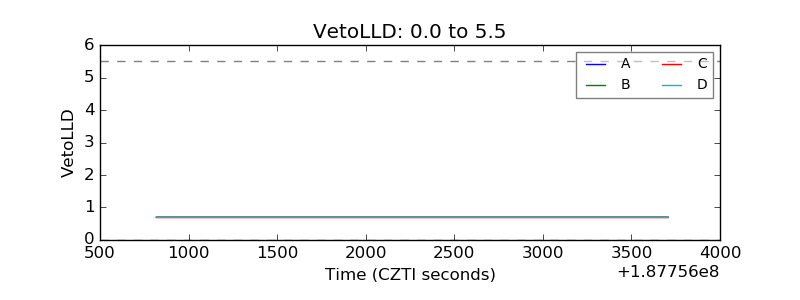 |
| Alpha Counter | 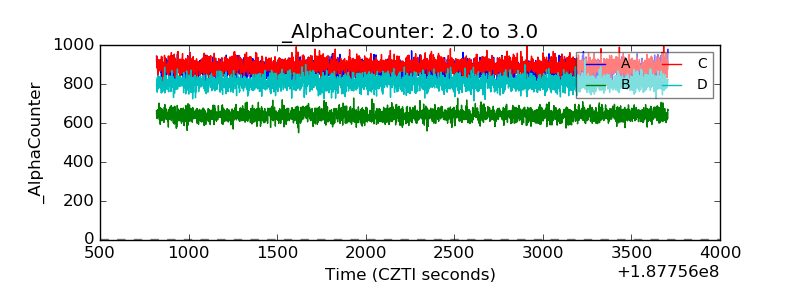 |
| _CPM_Rate | 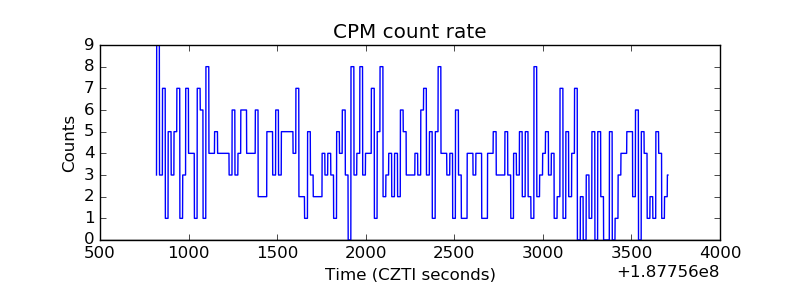 |
| CZT Counter | 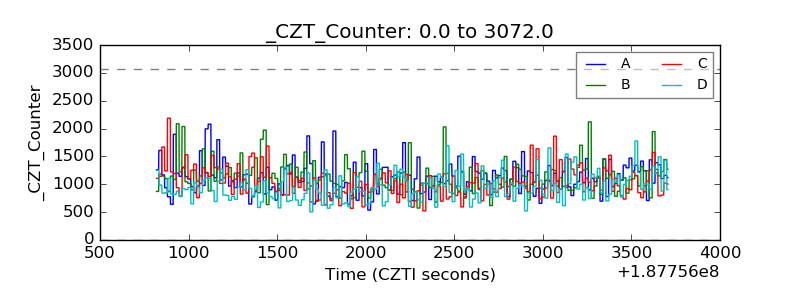 |
| +2.5 Volts monitor |  |
| +5 Volts monitor |  |
| _ROLL_ROT | 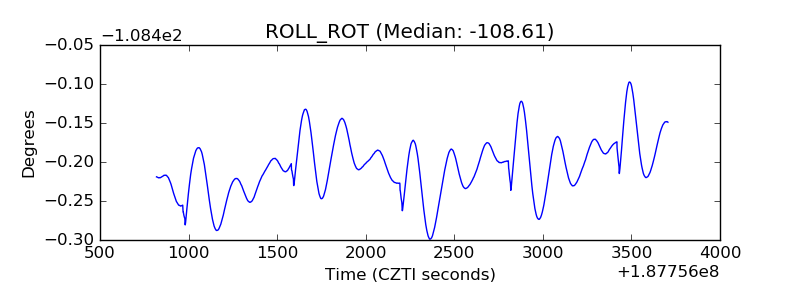 |
| _Roll_DEC | 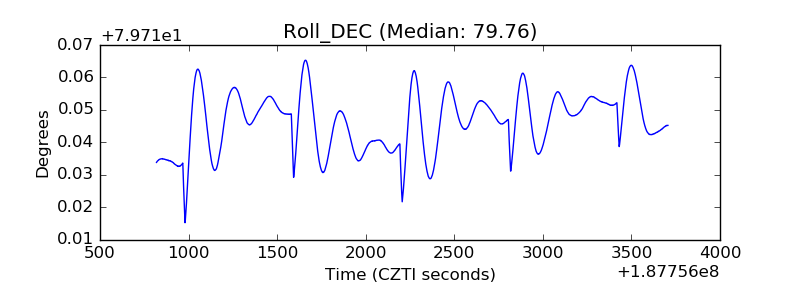 |
| _Roll_RA | 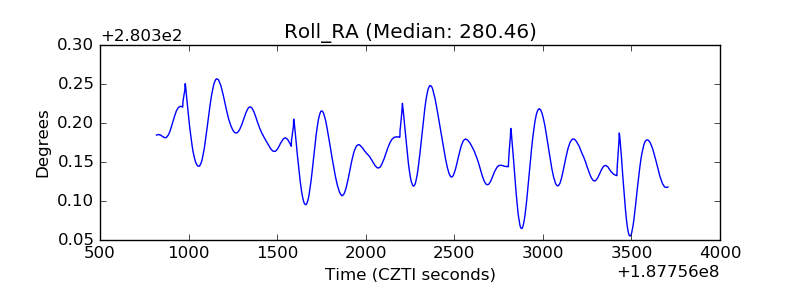 |
| Veto Counter | 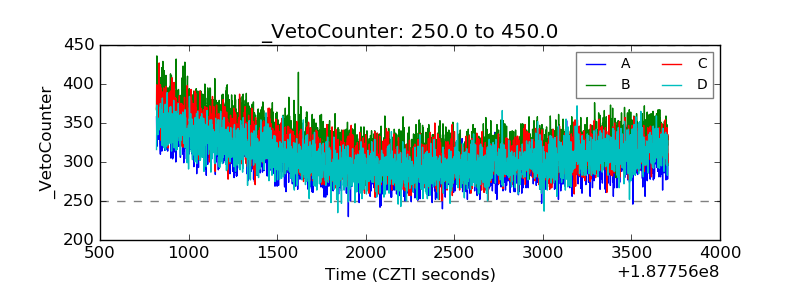 |