| Param | Original file | Final file |
|---|---|---|
| Filename | modeM0/AS1P01_997T03_9000000216_01143cztM0_level2.evt | modeM0/AS1P01_997T03_9000000216_01143cztM0_level2_quad_clean.evt |
| Size (bytes) | 911,551,680 | 92,269,440 |
| Size | 869.3 MB | 88.0 MB |
| Events in quadrant A | 7,053,140 | 613,853 |
| Events in quadrant B | 7,221,008 | 616,539 |
| Events in quadrant C | 6,867,695 | 581,757 |
| Events in quadrant D | 6,081,741 | 579,333 |
| Mode M0 | |||
|---|---|---|---|
| Quadrant | BADHDUFLAG | Total packets | Discarded packets |
| A | 0 | 25043 | 2 |
| B | 0 | 25545 | 1 |
| C | 0 | 24512 | 1 |
| D | 0 | 22182 | 1 |
| Mode SS | |||
|---|---|---|---|
| Quadrant | BADHDUFLAG | Total packets | Discarded packets |
| A | 0 | 118 | 0 |
| B | 0 | 118 | 0 |
| C | 0 | 118 | 0 |
| D | 0 | 118 | 0 |
| Mode M9 | |||
|---|---|---|---|
| Quadrant | BADHDUFLAG | Total packets | Discarded packets |
| A | 0 | 12 | 0 |
| B | 0 | 12 | 0 |
| C | 0 | 12 | 0 |
| D | 0 | 12 | 0 |
| Quadrant | Total seconds | Saturated seconds | Saturation percentage |
|---|---|---|---|
| A | 5761 | 30 | 0.520743% |
| B | 5761 | 45 | 0.781114% |
| C | 5761 | 56 | 0.972053% |
| D | 5761 | 8 | 0.138865% |
Noise dominated data is calculated using 1-second bins in cleaned event files. If a bin has >2000 counts, and if more than 50% of those come from <1% of pixels, then it is considered to be noise-dominated and hence unusable.
| Quadrant | # 1 sec bins | Bins with >0 counts | Bins with >2000 counts | High rate bins dominated by noise | Noise dominated (total time) | Noise dominated (detector-on time) | Marked lightcurve |
|---|---|---|---|---|---|---|---|
| A | 6971 | 5761 | 218 | 218 | 3.13% | 3.78% | 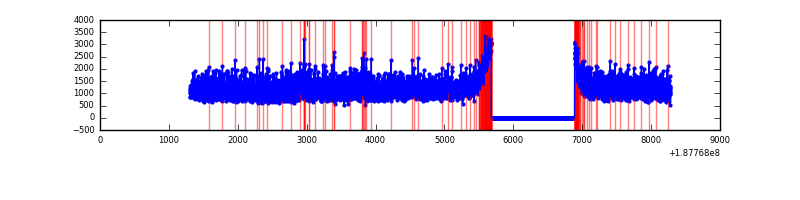 |
| B | 6971 | 5761 | 288 | 288 | 4.13% | 5.00% | 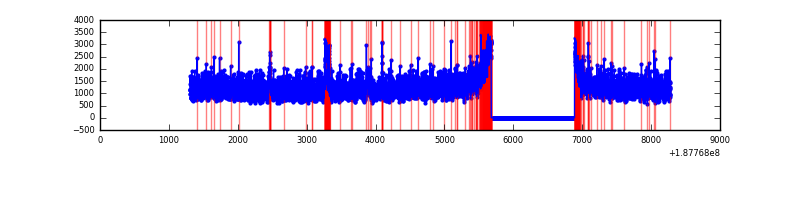 |
| C | 6971 | 5762 | 230 | 230 | 3.30% | 3.99% | 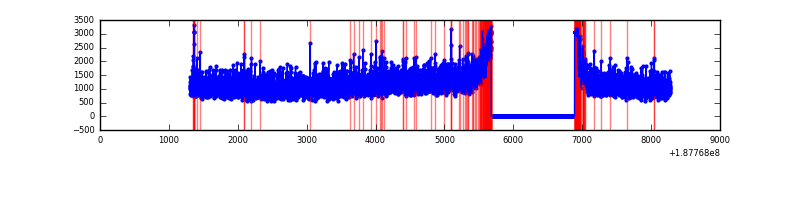 |
| D | 6971 | 5762 | 113 | 113 | 1.62% | 1.96% | 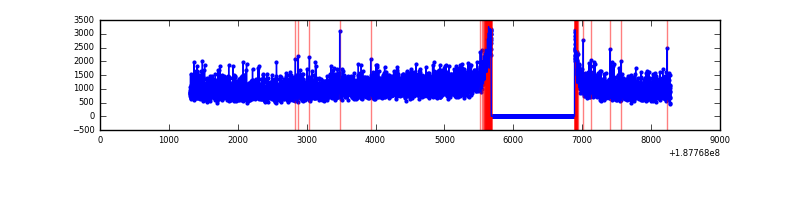 |
Top three noisy pixels from each quadrant. If the there are fewer than three noisy pixels in the level2.evt file, extra rows are filled as -1
| Pixel properties | Quadrant properties | ||||||
|---|---|---|---|---|---|---|---|
| Quadrant | DetID | PixID | Counts | Sigma | Mean | Median | Sigma |
| A | 15 | 127 | 153707 | 352.22 | 1797 | 1808 | 431.3 |
| A | 11 | 79 | 6171 | 10.12 | 1797 | 1808 | 431.3 |
| A | 3 | 111 | 5890 | 9.47 | 1797 | 1808 | 431.3 |
| B | 5 | 191 | 111238 | 251.1 | 1841 | 1850 | 435.6 |
| B | 15 | 22 | 39481 | 86.38 | 1841 | 1850 | 435.6 |
| B | 15 | 85 | 32375 | 70.07 | 1841 | 1850 | 435.6 |
| C | 15 | 241 | 266860 | 589.35 | 1630 | 1680 | 450.0 |
| C | 12 | 206 | 157786 | 346.94 | 1630 | 1680 | 450.0 |
| C | 9 | 52 | 28383 | 59.35 | 1630 | 1680 | 450.0 |
| D | 13 | 138 | 9159 | 14.91 | 1623 | 1681 | 501.6 |
| D | 10 | 84 | 6198 | 9.0 | 1623 | 1681 | 501.6 |
| D | 2 | 63 | 5134 | 6.88 | 1623 | 1681 | 501.6 |
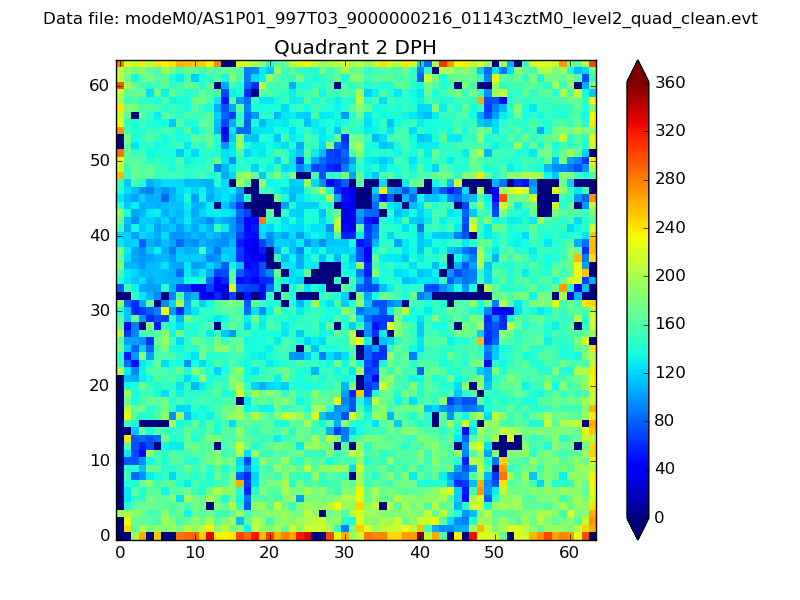
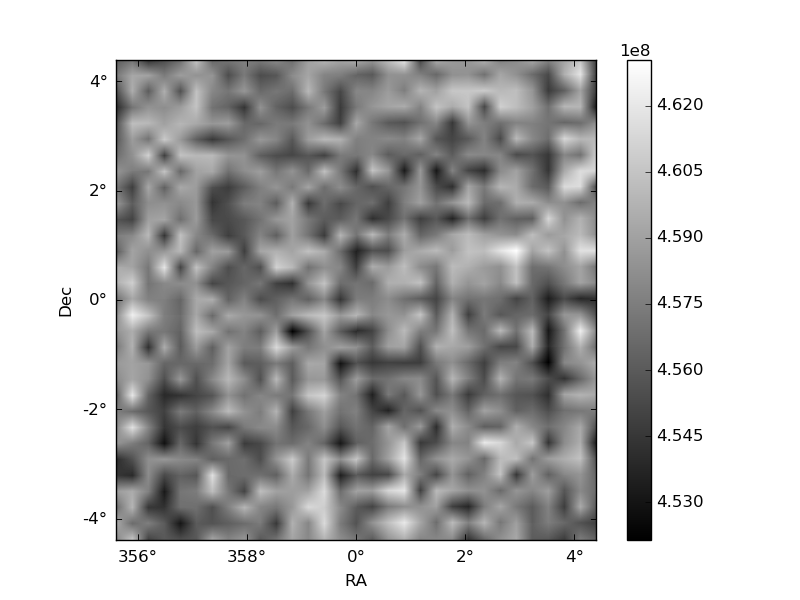
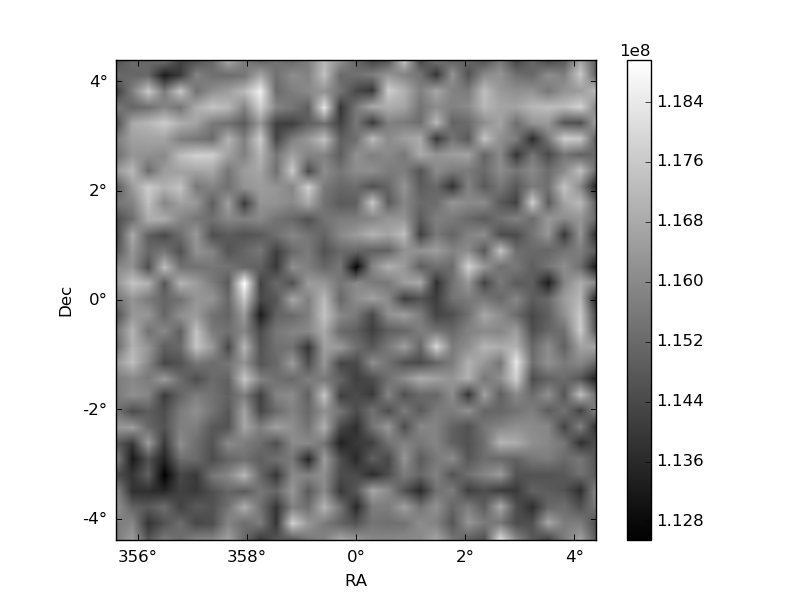
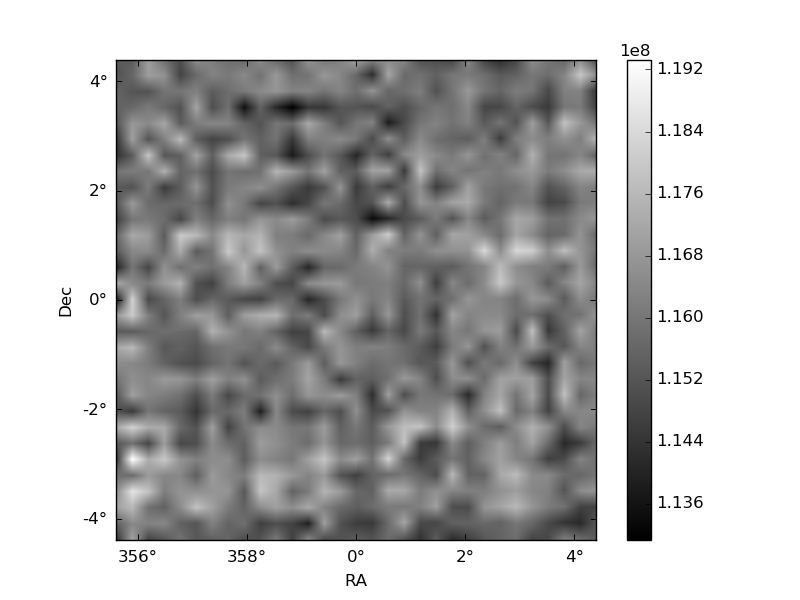
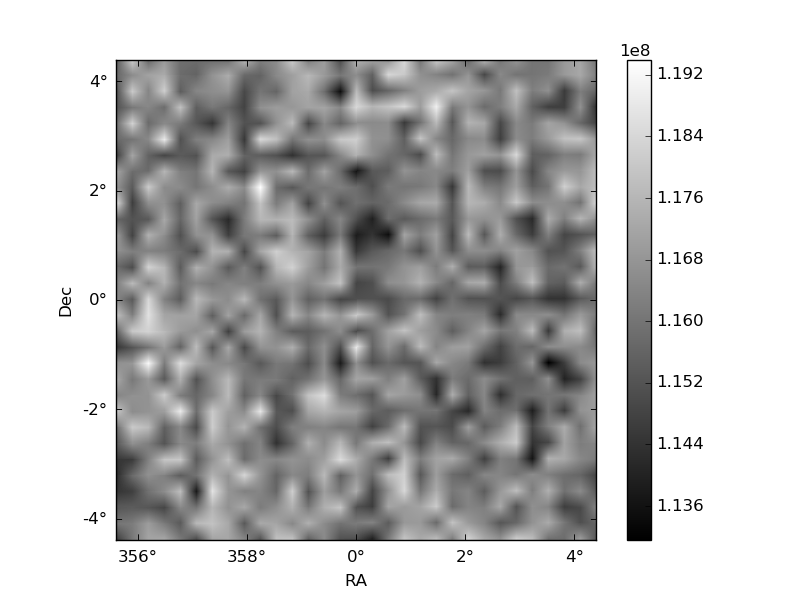
Histogram calculated using DETX and DETY for each event in the final _common_clean file
| Quadrant A | 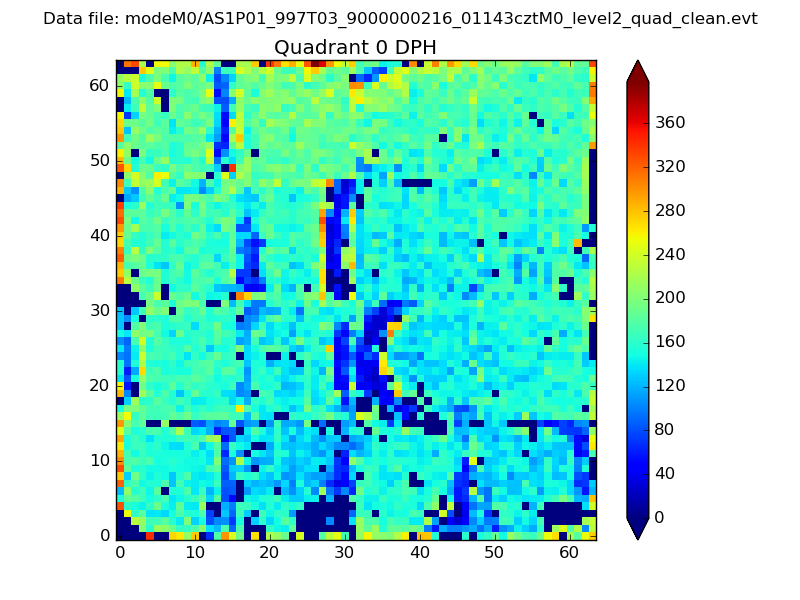 |
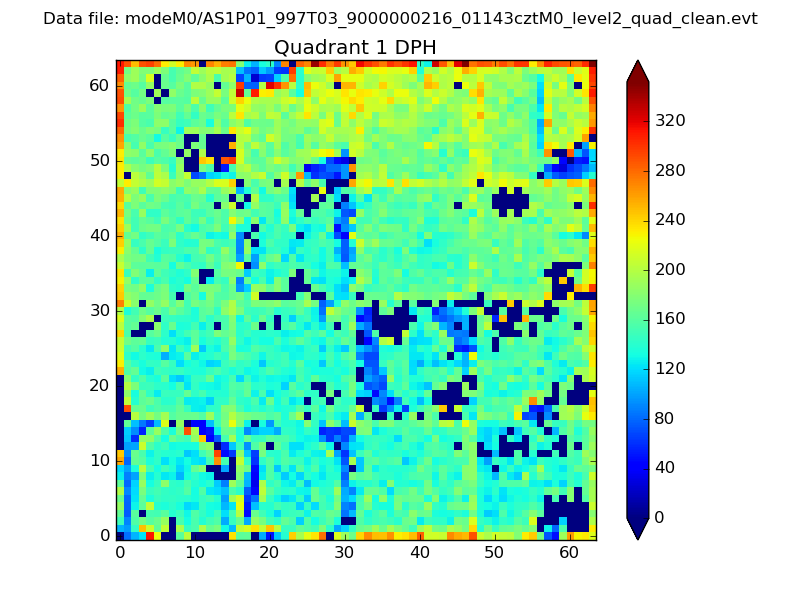 |
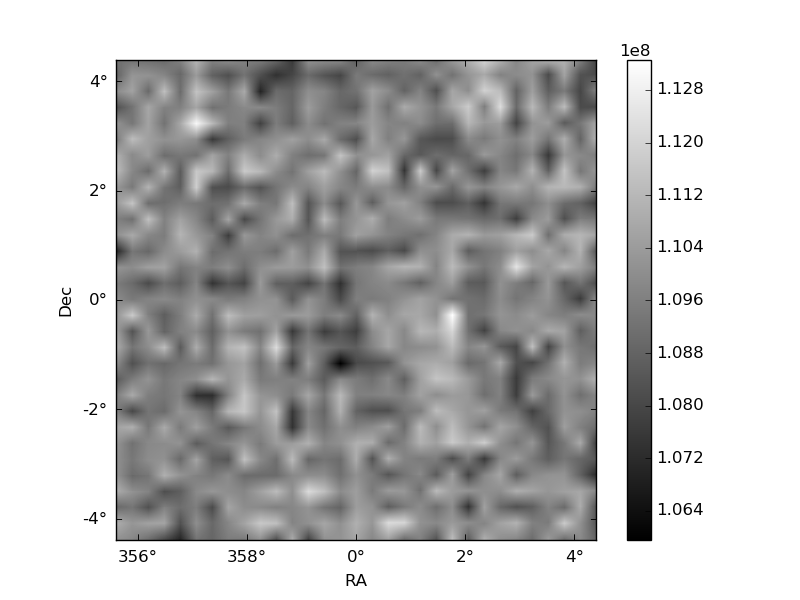
Quadrant B |
|---|---|---|---|
| Quadrant D | 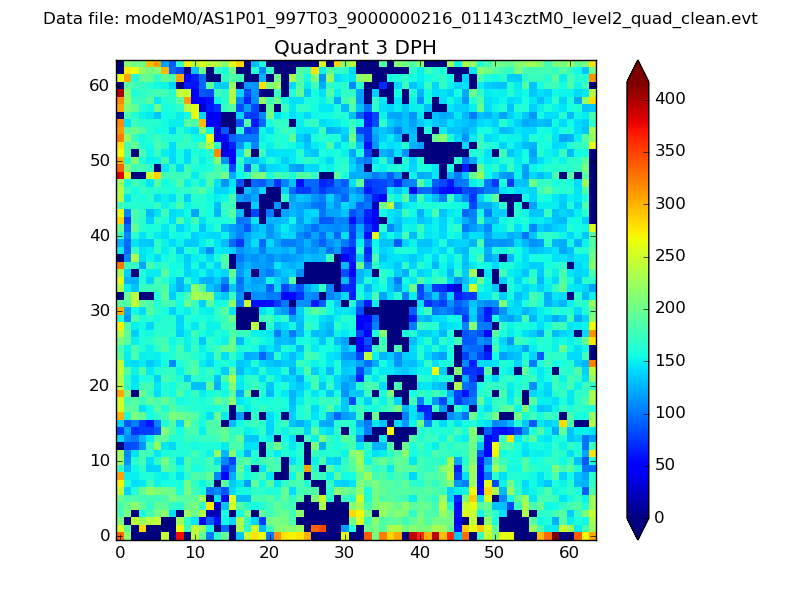 |
 |
Quadrant C |
| Plot type | Count rate plots | Images |
|---|---|---|
| Comparison with Poisson distribution Blue bars denote a histogram of data divided into 1 sec bins. Red curve is a Poisson curve with rate = median count rate of data. |
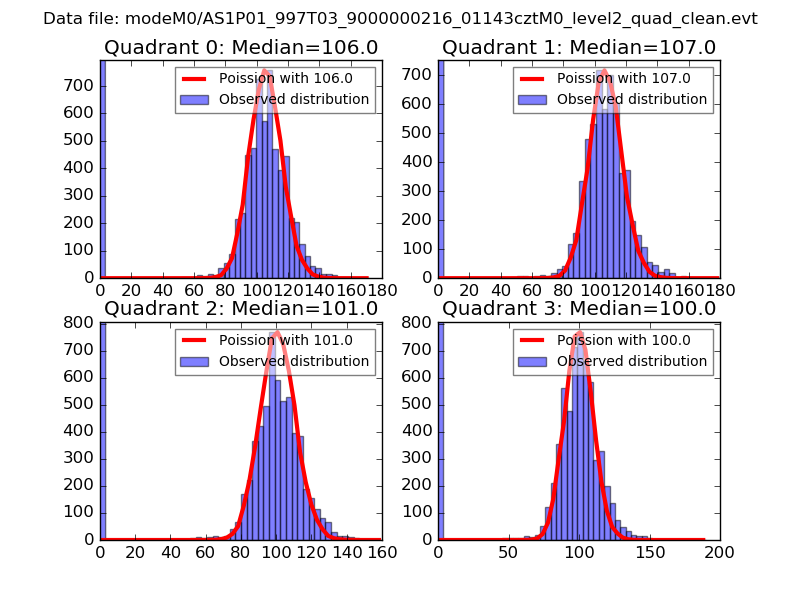 |
 |
| Quadrant-wise count rates Data is divided into 100 sec bins |
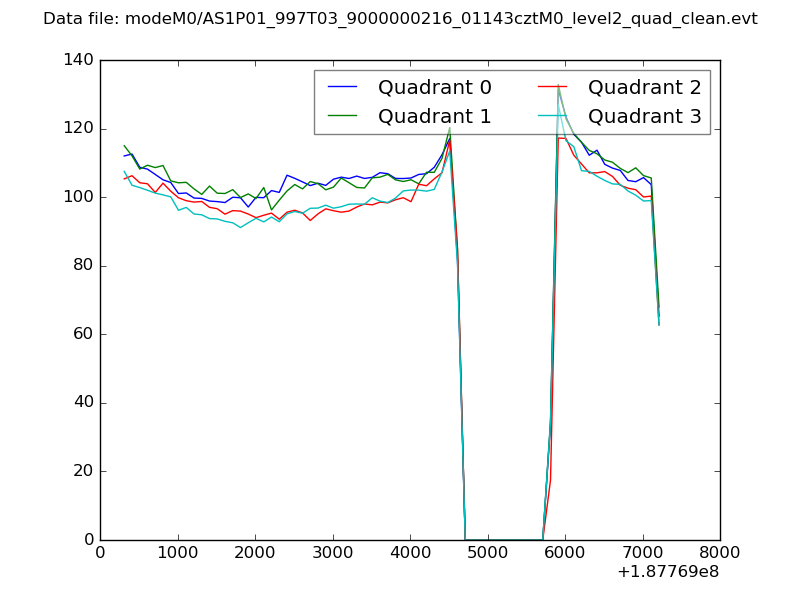 |
|
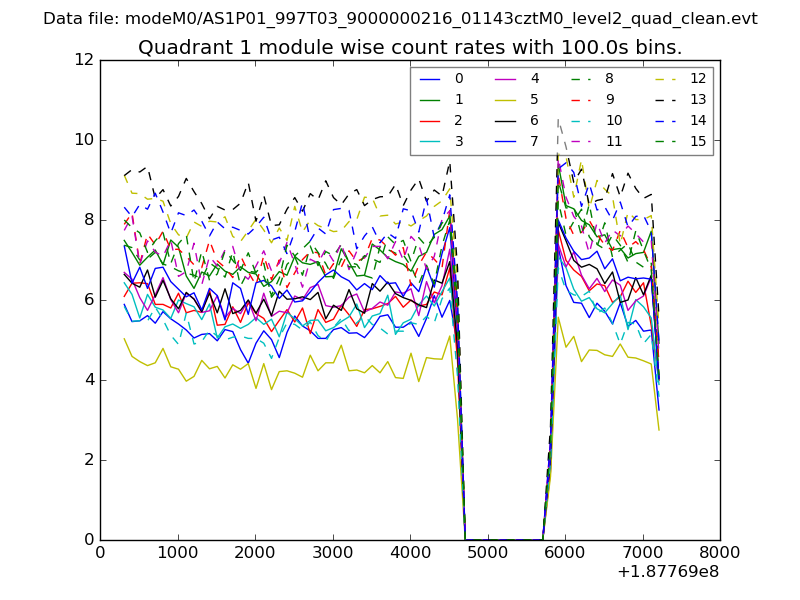
| Module-wise count rates for Quadrant A Data is divided into 100 sec bins |
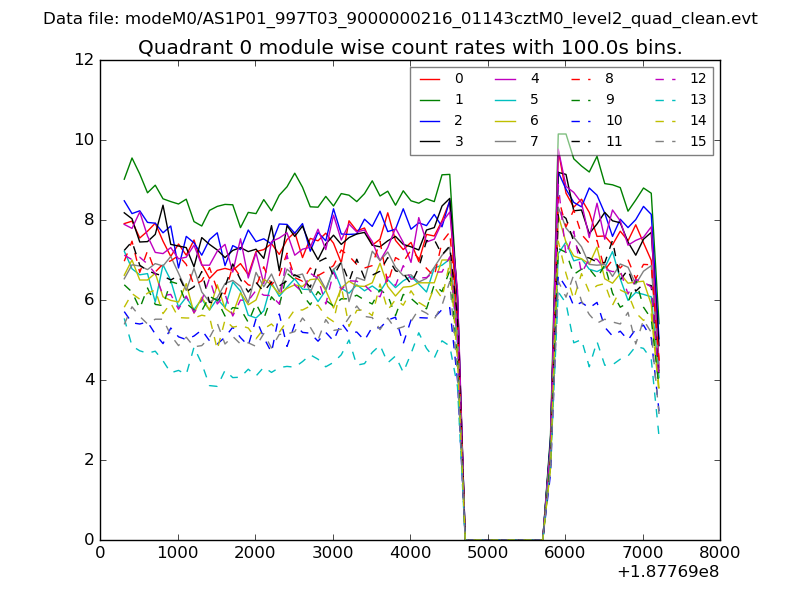 |
 |
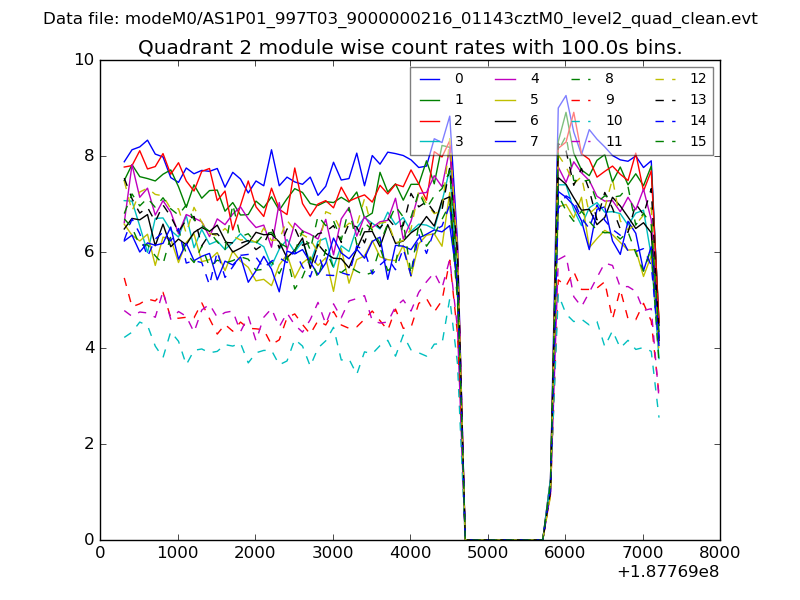
| Module-wise count rates for Quadrant B Data is divided into 100 sec bins |
 |
 |
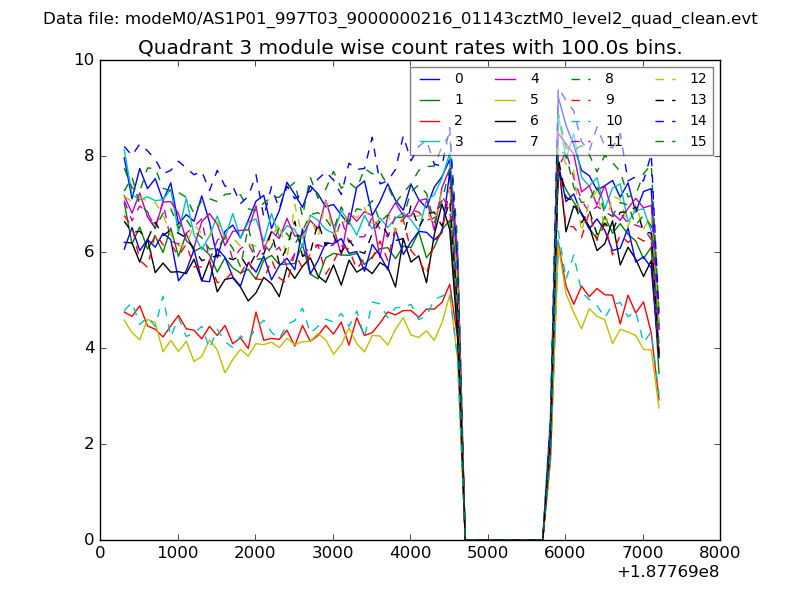
| Module-wise count rates for Quadrant C Data is divided into 100 sec bins |
 |
 |
| Module-wise count rates for Quadrant D Data is divided into 100 sec bins |
 |
 |
| Parameter | Plot |
|---|---|
| CZT HV Monitor | 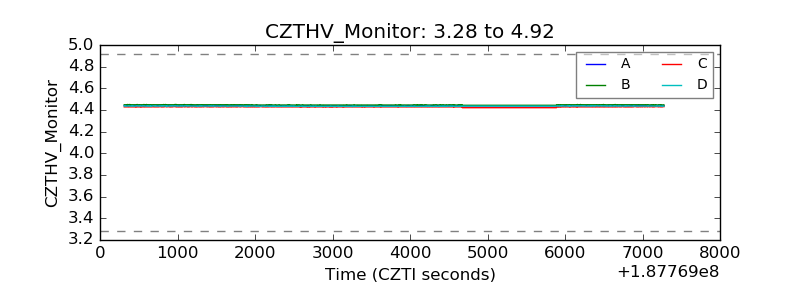 |
| D_VDD | 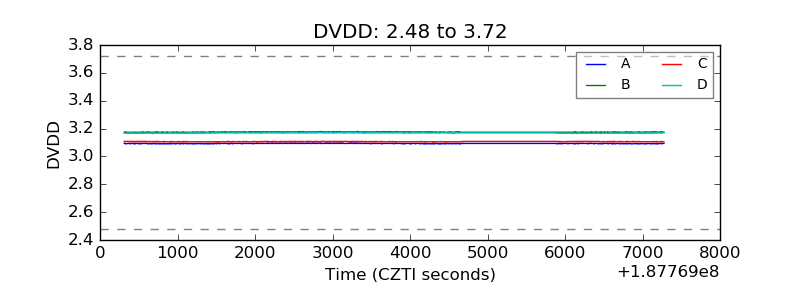 |
| Temperature 1 | 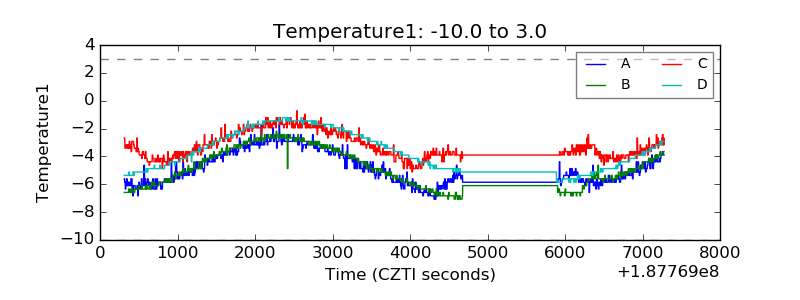 |
| Veto HV Monitor | 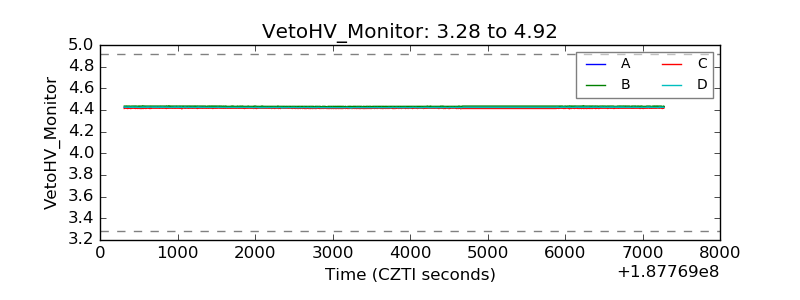 |
| Veto LLD | 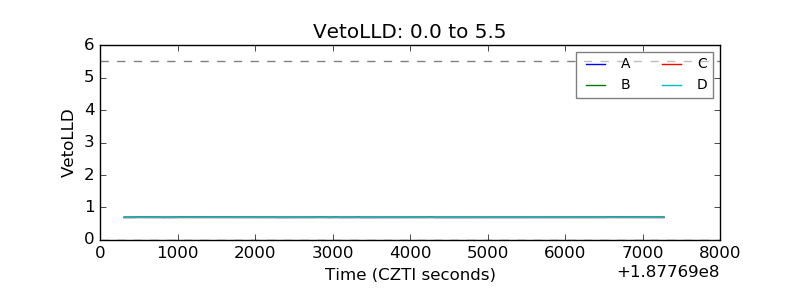 |
| Alpha Counter | 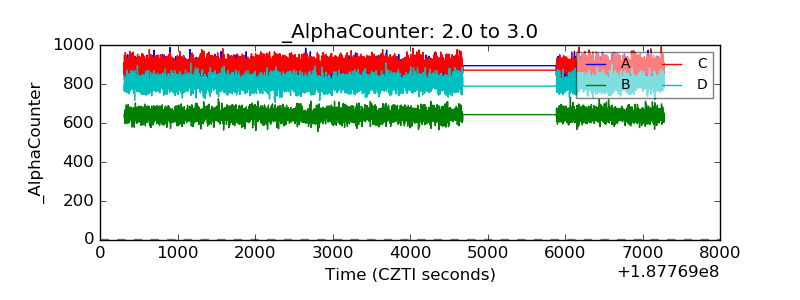 |
| _CPM_Rate | 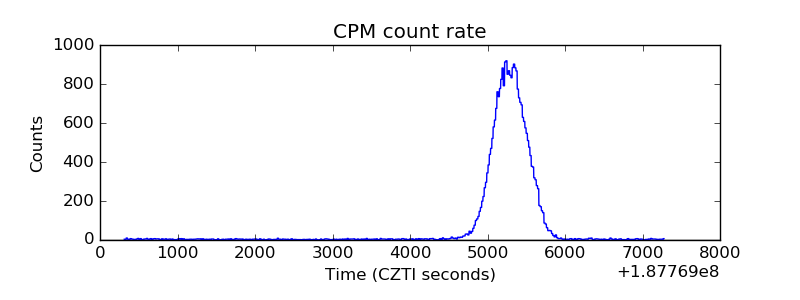 |
| CZT Counter | 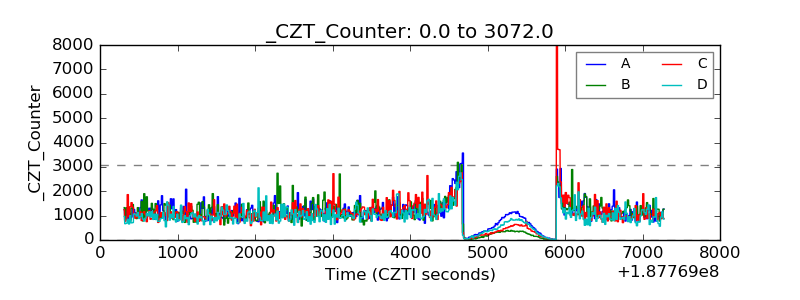 |
| +2.5 Volts monitor | 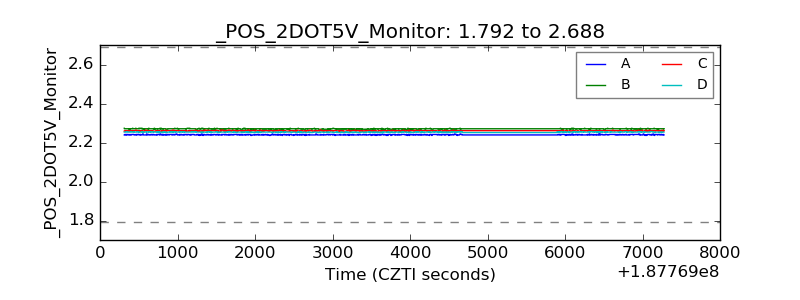 |
| +5 Volts monitor | 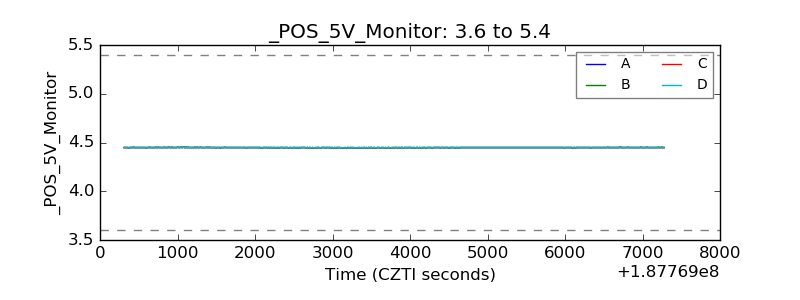 |
| _ROLL_ROT | 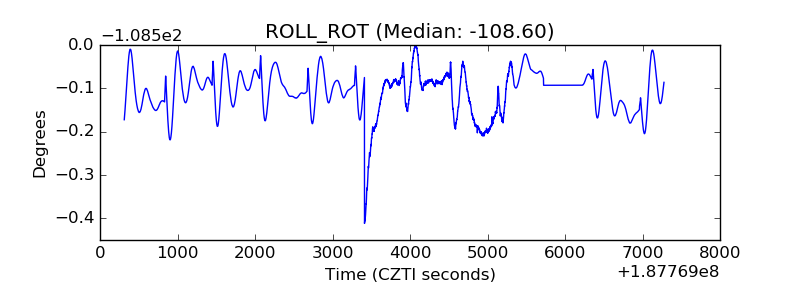 |
| _Roll_DEC | 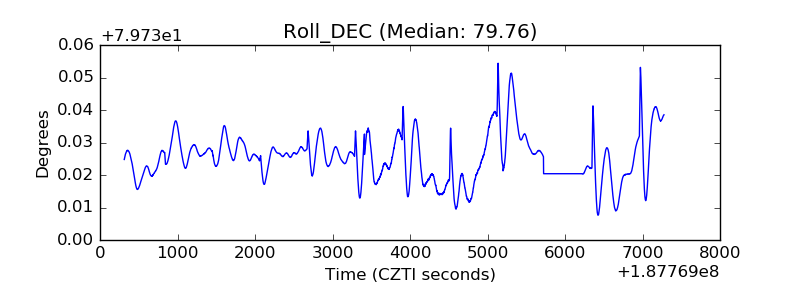 |
| _Roll_RA | 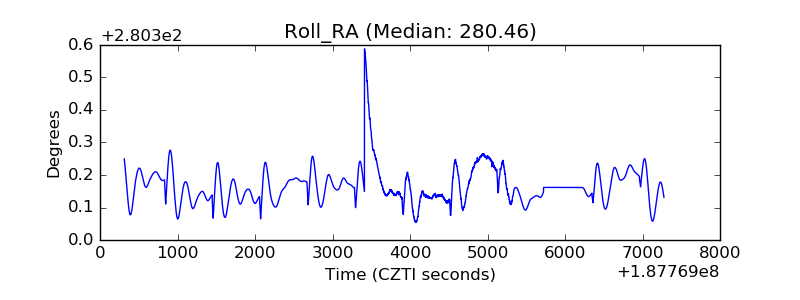 |
| Veto Counter | 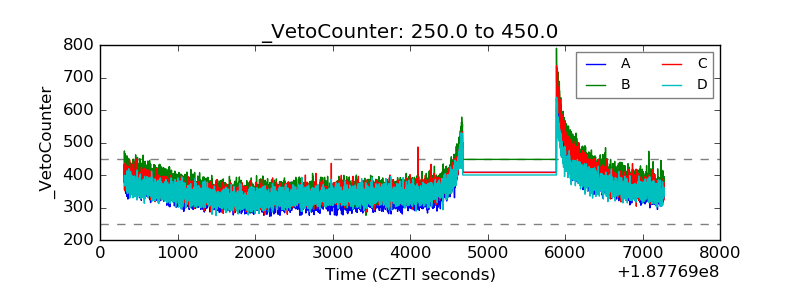 |